A unified model for Duchenne muscular dystrophy gene involvement in cancer: context‐dependent tumour suppression and oncogenicity
Lee Machado, Leanne Jones, Sonika Divakar, Michael Naidoo, Karen Anthony

TL;DR
This study shows that the DMD gene, known for causing Duchenne muscular dystrophy, can act as both a tumor suppressor and an oncogene depending on the cancer type.
Contribution
The paper introduces a unified, context-dependent model for DMD's dual role in cancer.
Findings
High DMD expression is linked to improved or worsened survival outcomes depending on cancer type.
The Dp71ab transcript mirrors total DMD trends and distinguishes two tumor groups with opposing survival associations.
Divergent DMD effects may be linked to signaling and adhesion-related DAPC components.
Abstract
Evidence implicates the Duchenne muscular dystrophy gene (DMD) in tumorigenesis, but survival trends are inconsistent. To resolve this, we conducted a comprehensive global analysis of DMD expression and survival outcomes across 33 tumour types using bulk RNA sequencing data from The Cancer Genome Atlas. We examined the impact of total DMD, individual transcript and dystrophin‐associated protein complex (DAPC) gene expression levels on overall survival using Kaplan–Meier analysis, Cox proportional hazard modelling and pathway analysis. DMD expression was significantly associated with survival in nine cancers after Bonferroni correction (α = 0.0015), with high expression linked to either improved or worsened outcomes depending on cancer type. The most abundant DMD transcript, Dp71ab, mirrored total DMD trends, distinguishing two tumour groups with opposing survival associations.…
Genes, proteins, chemicals, diseases, species, mutations and cell lines named across the full text — each resolved to its canonical identifier and authoritative record.
Click any figure to enlarge with its caption.
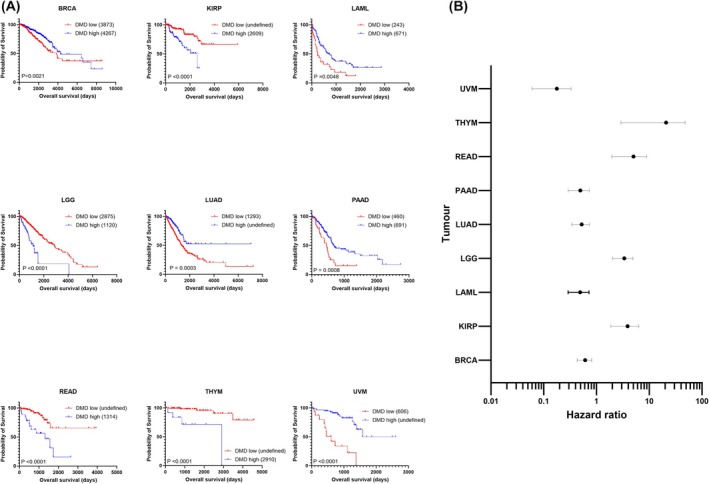 Fig. 1
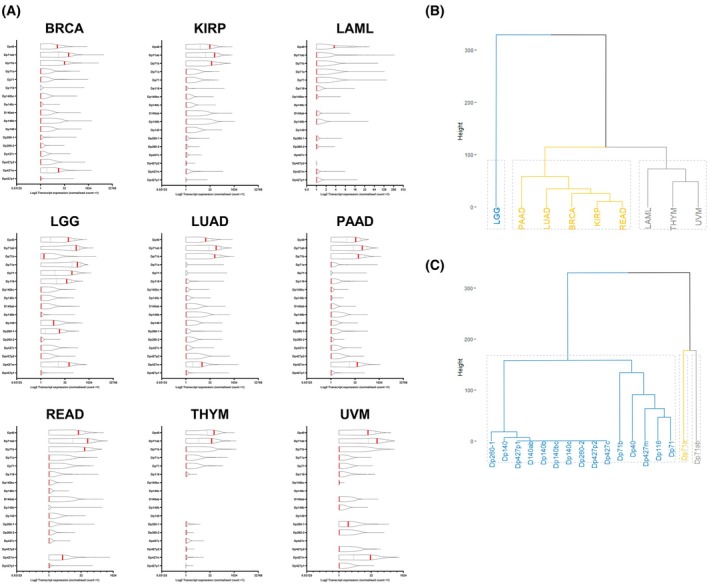 Fig. 2
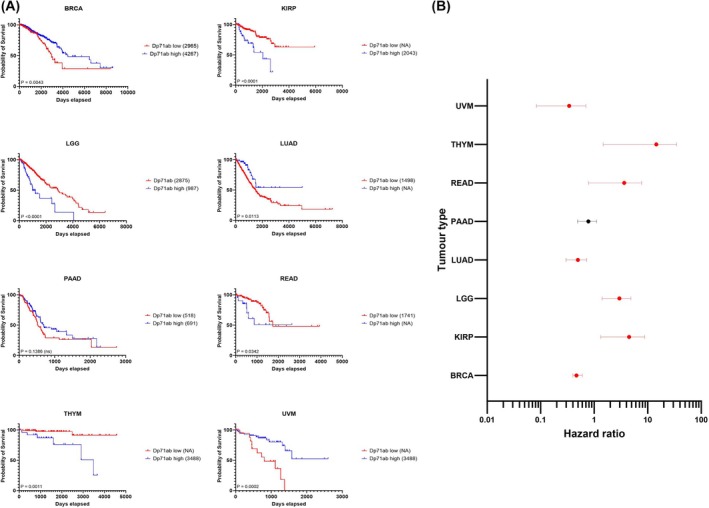 Fig. 3
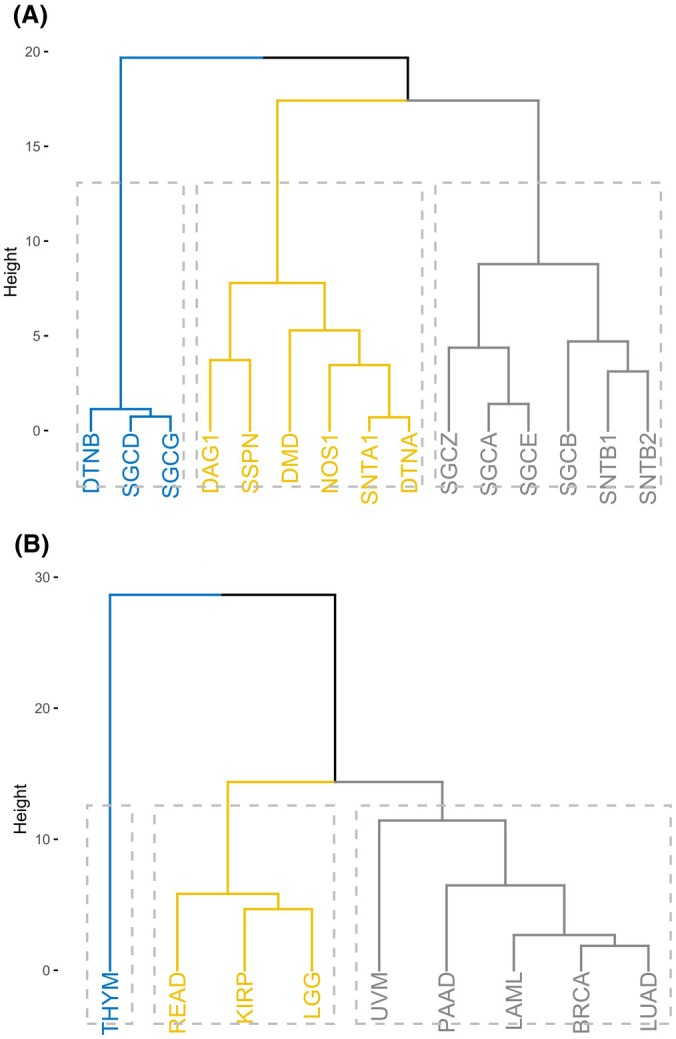 Fig. 4
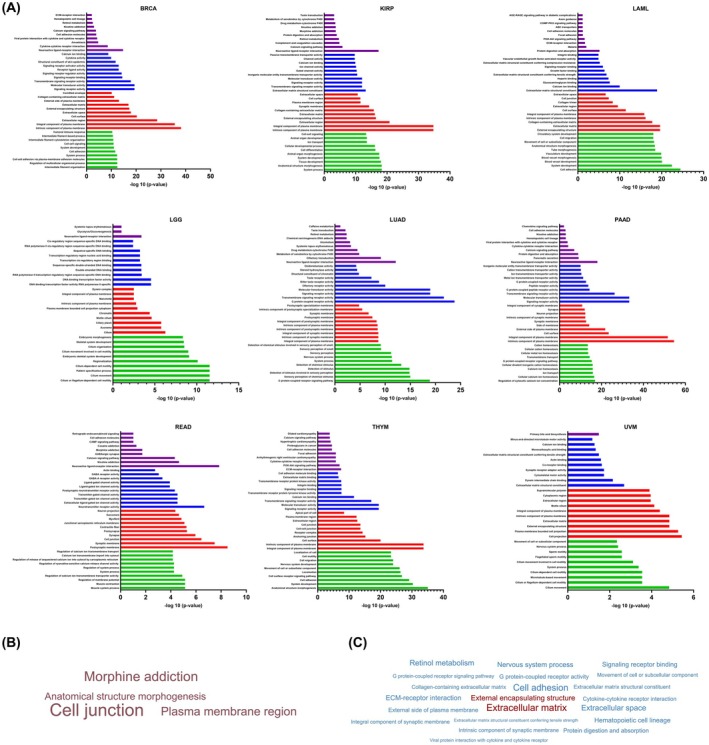 Fig. 5
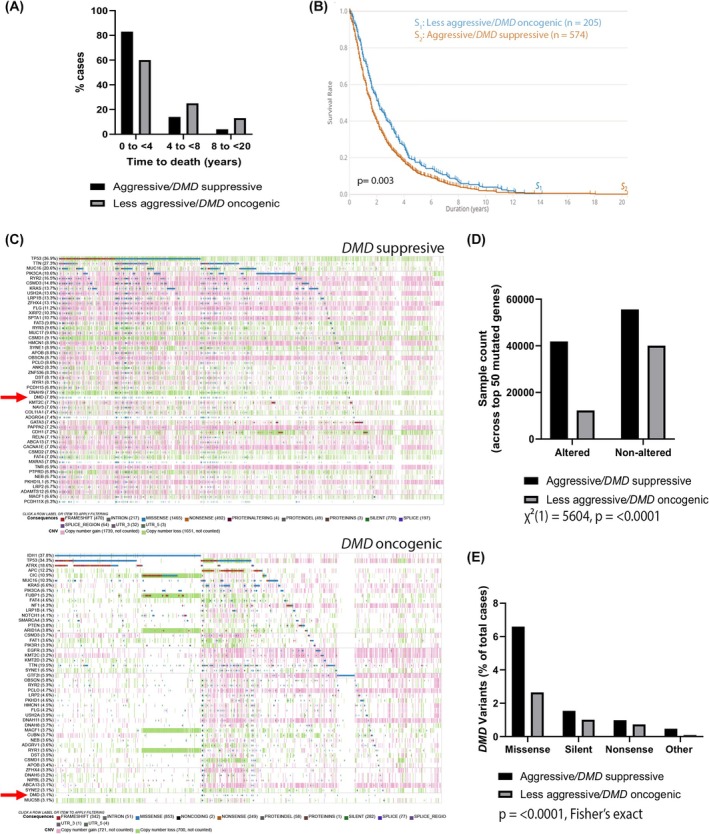 Fig. 6
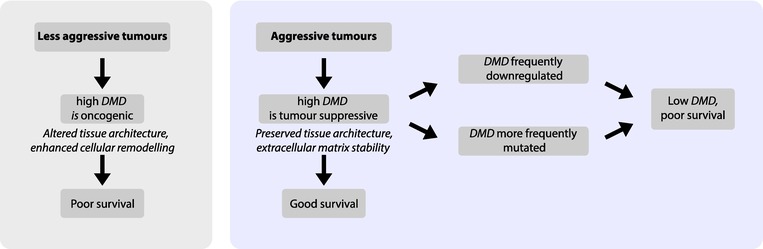 Fig. 7
| UVM | PAAD | LUAD | LAML | BRCA | SARC | HNSCC | LGG | THYM | READ | KIRP | MESO | |
|---|---|---|---|---|---|---|---|---|---|---|---|---|
|
|
| |||||||||||
| Metastatic potential | High, liver metastases common | High, frequent early spread to liver/lung | High | Spreads systemically | Metastatic subtypes common | High, especially osteosarcoma | Lymph node and distant metastases common | Rarely metastasizes outside central nervous system | Distant metastasis is rare | Metastasis occurs but at later stage | Less frequent than clear cell renal cell carcinoma | Locally invasive but rarely distant metastasis |
| Overall survival | Poor, aggressive cases have < 1 year survival | Poor, ~ 10% 5‐year survival | Poor, late‐stage survival low | Poor, aggressive subtypes have short survival | Variable, aggressive subtypes have poor survival | Poor, depends on subtype | Poor, HPV negative cases worse | Better than glioblastoma | Generally good prognosis | Moderate outcomes | Moderate survival | Poor, median survival ~ 12 months |
| Therapy resistance | Resistant to chemotherapy | Highly resistant | Resistant to some therapies | Relapses common | Therapy resistant subtypes exist | Chemotherapy resistance is common | Resistant to chemotherapy/radiotherapy | Somewhat therapy responsive | Usually therapy sensitive | Therapy responsive in many cases | Can respond to targeted therapy | Therapy resistant |
| Tumour mutational burden | High | High | High | High chromosomal instability | Genetic instability in aggressive cases | High genetic heterogeneity | High | Lower mutational burden than glioblastoma | Low | Moderate | Lower mutational burden | Low |
Peer Reviews
No public reviews on file for this paper yet. If you reviewed it on a platform where reviews are public (OpenReview, ICLR, NeurIPS, ICML), you can paste yours below so the community can read it here.
Videos
No videos yet. Explain this paper in a talk, walkthrough, or lecture? Add one.
Taxonomy
TopicsMuscle Physiology and Disorders · RNA Research and Splicing · Virus-based gene therapy research
The Duchene muscular dystrophy gene (DMD) is named after the clinical condition of the same name and is one of the largest genes in the human genome, comprised of 79 exons spanning 2 Mb on the short arm of chromosome X (ChrX (p21.2‐p21.1)). [Correction added on 9 September 2025 after first online publication: The number of exons has been updated to “79” from “97”]. It resides within a known fragile site [1, 2] and encodes a large 427 KDa dystrophin protein. As part of the dystrophin‐associated protein complex (DAPC), dystrophin bridges the inner cytoskeleton to the extracellular matrix. Dystrophin and the DAPC have unique structural and biochemical roles that are tissue dependent. The canonical role of the DAPC is mechanical, where it stabilises the plasma membrane of striated muscle cells, but it also plays a role in cell signalling [3, 4, 5]. Mutations in many DAPC and DAPC‐associated protein encoding genes cause muscular dystrophy, highlighting its importance in muscle [6], but intriguingly, mutations and alterations in their expression are also associated with numerous types of cancer (including sarcomas, leukaemia's, lymphomas, nervous system tumours, melanomas and carcinomas), recently reviewed by us [2]. DMD downregulation is shown to correlate with age of onset, staging and survival in some tumours but gene expression and survival trends vary across others [7, 8, 9, 10, 11, 12].
The DMD gene contains seven independent alternative promoters producing multiple dystrophin protein variants, and splice isoforms thereof, which contribute to the complexity of dystrophin biology [13, 14]. Most notably dystrophin protein (Dp) 71, Dp71, is ubiquitously expressed, predominant in the adult brain and alternatively spliced (at exons 71 and 78) to produce four major isoforms that appear to have tissue‐specific expression and functions [14]. The roles of these Dp71 isoforms in membrane stabilisation and cell signalling remain considerably less well‐characterised compared to full‐length dystrophin. It is unclear whether each of these isoforms interact with the DAPC in a manner analogous to the full‐length protein, or whether such interactions result in comparable structural or signalling outcomes across different cell types. Previous studies have shown the normal balance of DMD gene products is disrupted in cancer and have linked Dp71 expression to tumorigenesis, but the findings are conflicting, with some suggesting it is oncogenic and others indicating a tumour‐suppressive role [2, 7, 8, 9, 10, 11, 12, 15, 16, 17, 18]. To address these discrepancies, we conducted a comprehensive bioinformatic analysis of DMD expression and its prognostic significance across 33 tumour types. Our study examines how DMD, its gene variants, and DAPC gene expression are linked to patient survival outcomes and aims to theorise why survival trends differ by cancer type.
Materials and methods
All data preprocessing and analyses were conducted using the r statistical Software (version 4.0.3; R Foundation for Statistical Computing, Vienna, Austria) and/or graphpad prism 10 (GraphPad Software, LLC, San Diego, CA, USA) unless otherwise stated.
Data acquisition
Clinical and transcriptomic data for 33 tumour types were obtained from The Cancer Genome Atlas (TCGA) through the Genomic Data Commons (GDC) portal. Transcriptomic data included normalised RNA‐seq data using the FPKM‐UQ (Fragments Per Kilobase Million Upper Quartile) workflow, and isoform expression data retrieved from the GDC Legacy Archive. FPKM‐UQ files were available as tab delimited files with the Ensembl gene IDs in the first column and the expression values in the second. The r/bioconductor package tcgabiolinks [19] version 2.24 was used employing GDCquery(), GDCdownload() and GDCprepare() functions and using data.catagory as ‘Transcriptome profiling’, data.type as ‘Gene Expression quantification’ and workflow.type as ‘HTSeq – FPKM‐UQ’. Nonprimary tumours were filtered out during preprocessing.
Gene expression and survival analysis
To analyse the association of DMD gene expression (and DAPC gene expression) with patient survival outcomes, RNAseq data from 33 tumour types from the Genomic Data Commons (GDC) were imported into rstudio using an r tcgabiolinks library [19]. Associated harmonised clinical data were also imported into rstudio. *DMD/*DAPC RNAseq gene expression was linked to patient clinical data to perform survival analysis. High versus low *DMD/*DAPC expressing patients were dichotomised using cut point selection using the R library maxstat. maxstat uses maximally selected rank statistics (smethod = LogRank) to evaluate a simple estimated cut point. Simulation was done using conditional Monte Carlo with B = 9999 replications [20]. Kaplan–Meier survival curves were generated using the survival r package or in graphpad, and differences in survival were assessed via the log‐rank test. For univariate hazard modelling, Cox proportional hazards regression was applied using DMD or DAPC gene expression as a sole covariate. Hazard ratios (HR) and 95% confidence intervals (CI) were calculated for each tumour type, focussing on the nine cancers with significant survival differences after Bonferroni correction (α = 0.0015). Results were visualised through forest plots and Kaplan–Meier curves and unweighted pair group method with arithmetic mean hierarchical clustering analysis using a Euclidean distance matrix with the hclust Ward D2 method. Cancers were subsequently grouped according to DMD expression survival trends, and the two cohorts compared using the GDC Data Portal Cohort Builder and Analysis Center tools: Cohort Comparison and ProteinPaint available at: https://portal.gdc.cancer.gov/analysis_page?app=.
Transcript‐specific analysis
To assess the prognostic importance of specific DMD transcripts, survival analyses were repeated with patient cohorts stratified by isoform expression. Isoform expression data from the GDC legacy archive data were extracted using the r/bioconductor package tcgabiolinks [19] version 2.24 using GDCquery(), GDCdownload() and GDCprepare() functions for primary tumour samples.types as well as using data.type as ‘Isoform expression quantification’ and file.type as ‘normalized’. This pipeline used mapsplice [21] to do the alignment and RSEM to perform the quantification [22]. Output files contained UCSC isoform identifiers (curated from the UCSC Table browser), which were used to convert them to specific DMD gene products for processing and survival analysis. Hazard ratios for these genes were calculated using univariate Cox modelling. Only transcripts with sufficient read coverage and quantification confidence were included to ensure robust expression estimates and avoid artefacts from low‐abundance or poorly annotated isoforms.
Differential gene expression and functional pathway analysis
Differential gene expression (DEG) analysis and functional enrichment analysis of DEGs was performed using idep, which integrates 63 r/bioconductor packages for pathway analysis [23, 24]. DEG analysis was conducted between high and low DMD‐expressing tumours using the limma r package. Genes with a false discovery rate (FDR) < 0.1 and a fold change > 2 were identified as significant. For pathway analysis, Gene Ontology (GO) terms (biological processes, molecular functions and cellular components) and Kyoto Encyclopedia of Genes and Genomes (KEGG) pathways were assessed.
Results
DMD
expression is significantly associated with survival outcomes across at least nine tumour types
Applying an outcome‐based cut‐point approach, survival analysis was employed for 33 TCGA tumours, dichotomising patients into high or low expressing groups (Fig. S1). Of the 33 tumour types examined, nine had significant differences in survival outcomes (Log‐Rank test) after Bonferroni correction (Fig. 1A). These were as follows: breast invasive carcinoma (BRCA, P = 0.0001), kidney renal papillary cell carcinoma (KIRP, P < 0.001), acute myeloid leukaemia (LAML, P = 0.0006), low‐grade glioma (LGG, P < 0.0001), lung adenocarcinoma (LUAD, P = 0.0003), pancreatic adenocarcinoma (PAAD, P = 0.0008), rectum adenocarcinoma (READ, P < 0.0001), thymoma (THYM, P < 0.0001) and uveal melanoma (UVM, P < 0.0001). For BRCA, LAML, LUAD, PAAD, and UVM, patient overall survival was better in those patients with high total DMD tumour RNA expression. Conversely, in KIRP, LGG, READ and THYM, high expression of DMD was associated with worse survival outcomes. As an example, and shown previously using a different bioinformatic pipeline [10], median survival of LGG patients with high expression of DMD was 1120 days compared with patients with low tumour expression of DMD who lived for a median of 2875 days (2.57‐fold increase in overall survival time and a nearly 5‐year difference in survival). To better quantify the strength of these associations, we generated a forest plot of univariate hazard ratios (HR) with confidence intervals (Fig. 1B). THYM had the highest risk of poor survival (HR 11.8, 95% CI: 2.9 to 47.8) and UVM had the lowest risk of poor survival (HR 0.14, 95% CI: 0.06 to 0.33), though with wide confidence intervals in both cases.
DMD expression is significantly associated with survival across tumour types (A) TCGA RNAseq data from nine TCGA cancer cases were dichotomised into high (blue) and low (red) DMD expressing groups and survival analysis performed in graphpad using the log‐rank test. Numbers in brackets are median overall survival times in days. (B) Forest plot revealing significant log‐rank hazard ratios illustrated with 95% confidence intervals in selected TCGA tumours. UVM n = 80, THYM n = 121, READ n = 177, PAAD n = 182, LUAD n = 594, LGG n = 529, LAML n = 151, KIRP n = 321, BRCA n = 1222.
Dp71ab and Dp40 are predominant
DMD transcripts in solid tumours
To determine whether the above findings can be attributed to specific DMD transcripts, we investigated the expression of 17 DMD transcripts across the nine tumours of interest (Fig. 2A). The results show that Dp71ab (an isoform lacking DMD exons 71 and 78) is a predominant transcript across all but one tumour type (LAML). LAML unusually only expresses Dp40 and at weaker levels than for other tumours where Dp40 is also largely predominant. Most tumours express multiple transcripts, with Dp71 variants consistently amongst the highest. Interestingly, only three tumours (THYM, LAML and KIRP) appear to lack full‐length dystrophin transcript expression: Dp427c (cortical promoter), Dp427m (muscle promoter) or Dp427l (lymphocyte promoter). Dp427m is the most predominant full‐length dystrophin transcript, but its expression is variable. UVM uniquely expresses Dp260‐1. LGG exhibited the broadest profile and forms its own distinct cluster expressing nine different transcripts. These findings underscore the tissue specificity of DMD transcript expression and their emerging functional diversity. Our results suggest that Dp71ab may be of relevance for tumourigenesis given its predominant expression and the fact that it clusters separately from other transcripts, including Dp40 (Fig. 2C).
Expression of individual DMD gene transcripts in selected TCGA cancers. (A) Normalised counts were Log2 transformed. Red bars represent median values; dashed lines represent 95% confidence intervals. (B) Tumour‐based dendrogram cluster analysis. (C) DMD transcript‐based dendrogram cluster analysis. Three clusters were specified for both dendrograms, using Euclidean distance as a distance metric and the Ward D2 clustering algorithm. Dendrograms were generated in r (https://github.com/lrmacha/TCGA).
Dp71ab is a key prognostic factor across multiple tumours
Given the expression of multiple DMD transcripts in various tumour tissues, we next repeated our survival analysis to determine which gene product(s) are most strongly linked to overall survival. The direction of hazard and survival trends across (and sometimes within) cancer types varies when comparing high versus low expression of different DMD gene products (Fig. S2). We focussed our survival analysis on Dp71ab expression given it is the most predominant DMD transcript for the largest number of cancers and has a recognised involvement in tumorigenesis [2, 7, 8, 9, 10, 12, 15, 16]. LAML was excluded from analysis due to undetectable Dp71ab expression; out of the eight remaining tumours with significant differences in overall survival after Bonferroni correction, PAAD was the only one that did not exhibit significantly different survival outcomes based on Dp71ab expression (Fig. 3). In line with total DMD, high Dp71ab expression in THYM, READ, LGG and KIRP is indicative of poor survival, whilst in UVM, LUAD and BRCA, it is predictive of good survival. This suggests that the effect of DMD expression on survival across several tumour types may be attributed to Dp71ab expression.
Dp71ab expression is broadly associated with survival across tumour types (A) TCGA RNAseq data from nine TCGA cancer cases were dichotomised into high (blue) and low (red) Dp71ab expressing groups, and survival analysis was performed in graphpad using the log‐rank test. Numbers in brackets are median overall survival times in days. (B) Forest plot revealing log‐rank hazard ratios in selected TCGA tumours illustrated with 95% confidence intervals. UVM n = 80, THYM n = 121, READ n = 177, PAAD n = 182, LUAD n = 594, LGG n = 529, KIRP n = 321, BRCA n = 1222. Red indicates significance.
Hazard ratio profiling of DAPC genes reveals tumour‐specific prognostic clusters in TCGA data
To investigate whether other DAPC genes exhibit similar prognostic patterns to *DMD/*Dp71ab, we adopted a candidate approach by profiling the hazard ratios for 14 additional DAPC genes across the nine tumour types with significant DMD‐associated survival differences (Fig. 4; Fig. S3). Among the nine tumour types examined, LGG uniquely exhibited statistically significant hazard ratios for all DAPC genes, with nine associated with increased hazard and six linked to reduced hazard. Across the other tumour types, no consistent trends emerged; however, in LUAD and BRCA, high expression of DAPC genes was predominantly protective, with only two (LUAD) or three (BRCA) DAPC genes significantly associated with increased hazard (Fig. S3). To further explore these patterns, hierarchical clustering was performed using hazard ratio values. Clustering by DAPC genes identified three distinct groups (Fig. 4A). The first cluster contained genes encoding two sarcoglycans (gamma and delta) and dystrobrevin beta; the second cluster contained sarcospan, dystrophin, nNOS, dystrobrevin alpha, alpha syntrophin and dystroglycan. The third cluster contained sarcoglycans (alpha, beta, zeta and epsilon) and beta syntrophin 1 and 2 (Fig. 4A). When tumours were clustered based on tumour type instead, three distinct groups emerged, which included two major clusters and a third cluster containing only THYM. The middle cluster contained READ, KIRP and LGG, and the largest cluster contained UVM, PAAD, LAML, BRCA and LUAD (Fig. 4B). This analysis identifies two major tumour clusters and distinct gene clusters, highlighting tumour‐ and gene‐specific variations in prognostic hazard ratio profiles across the nine cancers. These results show that DMD groups with a subset of DAPC genes (known for their signalling and adhesion‐related roles) however, unlike DMD, individual DAPC gene expression patterns do not clearly separate into two prognostic groups, suggesting more varied or context‐specific roles within tumour progression.
Cluster dendrograms based on DAPC gene hazard ratios. (A) DAPC gene‐based dendrogram cluster analysis of tumours. (B) Tumour‐based dendrogram cluster analysis of DAPC genes. Significant univariate hazard ratio values were used. Three clusters were specified for both dendrograms, using Euclidean distance as a distance metric and the Ward D2 clustering algorithm. Dendrograms were generated in r (https://github.com/lrmacha/TCGA).
Distinct pathway enrichment profiles in tumours stratified by
DMD expression
To aid future investigation of functional role(s) for the DMD gene across tumour types a pathway analysis of DEGs was undertaken in cases comparing high verses low DMD expression. idep was used to identify differentially expressed genes using the deseq2 method [25]. To examine the functional annotations of the DEGs, enrichment analysis gene ontology [GO] biological processes, cellular component, molecular function, and KEGG was explored for the differentially expressed genes (Fig. 5A). The top upregulated GO and KEGG terms highlight key roles in membrane processes, cell signalling, cell communication and extracellular interactions. Enrichment in ‘integral component of plasma membrane’, ‘extracellular matrix structural constituent’ and ‘G protein‐coupled receptor activity’ indicates the importance of membrane structure and receptor‐mediated pathways. Processes including ‘cell adhesion’, ‘focal adhesion’ and ‘extracellular matrix (ECM)‐receptor interaction’ emphasise importance of cell–cell and cell‐matrix communication, supported by ‘extracellular matrix remodelling’. ‘PI3K‐Akt signalling’, ‘cytokine‐cytokine receptor interaction’ and ‘cell migration’ also highlight active intracellular signalling, immune responses and motility. Neural activity is also reflected in ‘synaptic membrane’ and ‘neuron projection’, indicating dynamic cellular interactions and signalling.
Enrichment analysis of the differentially expressed genes upon high versus low DMD expression in selected TCGA tumours. (A) Enrichment analysis against Gene Ontology for Molecular Function (GO MF; Blue), Cellular Component (GO CC; Red), Biological Process (GO BP; Green) and Kyoto Encyclopedia of Genes and Genomes (KEGG; Purple) are shown for the top 10 most significantly increased terms. (B) Sentence cloud depicting uniquely enriched GO and KEGG terms across the tumour dataset where high DMD is associated with worse outcomes (i.e. KIRP, LGG, READ and THYM). (C) Sentence cloud depicting uniquely enriched GO and KEGG terms across the tumour dataset where low DMD is associated with worse outcomes (i.e. BRCA, LAML, LUAD, PAAD and UVM). Sentence clouds were generated in r (https://github.com/lrmacha/TCGA).
To determine commonalities across the group of tumours where high DMD expression is linked to improved survival (the DMD‐suppressor group, suggesting a tumour‐suppressive role) versus those where high DMD expression is associated with poorer survival (the DMD‐oncogenic group, indicating an oncogenic role), we identified the recurrent GO and KEGG terms that are uniquely enriched in each group (Fig. 5B,C). In the group of tumours where high DMD expression correlates with poorer survival (Fig. 5B), unique enrichment of pathways including ‘anatomical structure morphogenesis’, ‘cell junction’ and ‘plasma membrane region’ point towards enhanced cellular remodelling and dynamic morphogenic processes in high DMD versus low DMD cases. These pathways are commonly associated with increased cell plasticity, motility and altered tissue architecture, which may contribute to local tumour progression and poor prognosis. In contrast, in the group with high DMD expression linked to improved survival (Fig. 5C), unique enrichment of terms such as ‘extracellular matrix’, ‘ECM‐receptor interaction’ and ‘cell adhesion’ emphasise the preservation of extracellular matrix integrity and cell–cell communication in high DMD versus low DMD cases. Since loss of ECM integrity and adhesion is a well‐recognised trigger for increased invasiveness and metastatic spread, we propose that in these tumours, high DMD expression serves as a safeguard, counteracting intrinsic aggressiveness. Conversely, in the DMD‐oncogenic group, the association of high DMD with pathways promoting dynamic cellular remodelling and motility suggests that these tumours might be less reliant on ECM stability and thus may be inherently less invasive. We therefore hypothesised that tumours in the DMD‐suppressor group (where high DMD is beneficial) may possess a higher intrinsic potential for invasion and metastasis, which is counteracted by high DMD expression, while those in the DMD‐oncogenic group may be less aggressive and/or invasive.
DMD
exhibits tumour suppressive behaviour in more aggressive cancers and oncogenic behaviour in less aggressive cancers
To test our hypothesis and proposed classification of tumours into aggressive versus less aggressive groups, we used a combination of widely accepted clinical and molecular indicators of tumour aggressiveness. These included median overall survival, metastatic potential, recurrence rates, therapeutic resistance and the burden of somatic alterations (mutations and/or copy number variations), based on publicly available data from the TCGA via the GDC Data Portal and supported by published literature. Tumours exhibiting multiple markers of poor prognosis were designated as ‘aggressive’, while those with comparatively better clinical outcomes and lower genomic instability were grouped as ‘less aggressive’. This classification is summarised in Table 1 and served as the foundation for our downstream comparisons of DMD‐related survival trends and mutation profiles.
We first compared time to death and overall survival statistics between the aggressive versus less aggressive groups using the GDC Data Portal Cohort Builder and Analysis Center tools. A large majority of cases in the proposed aggressive group (83%) survived less than 4 years, compared to only 60% in the proposed less aggressive group (Fig. 6A). In the 4 to < 8‐year category, 14% of the aggressive group survived, compared to 25% in the less aggressive group. In the 8 to < 20‐year category, survival rates were 4% and 13%, respectively. A chi‐squared test (χ^2^(2) = 11.52, P = 0.0031) confirmed a statistically significant difference in time to death distributions between the two groups. This supports the classification of the DMD suppressor group as more aggressive/invasive, with shorter survival times compared to the DMD oncogenic group. Similarly, we compared overall survival across the two cohorts of tumours, which also showed a significant difference (P = 0.003, Fig. 6B). Since aggressive tumours often have a higher rate of genetic mutation [24], we used the GDC Analysis Center tools to also explore the alteration frequencies of the top 50 mutated genes in each cohort of tumours (Fig. 6C). There are more gene alterations (including copy number variations) in the DMD suppressive group than in the DMD oncogenic group (Fig. 6D; χ^2^(1) = 5604, P < 0.0001). Interestingly, DMD appears among the top 50 mutated genes in both groups at position 29 (altered in 7.8% of cases) in the DMD suppressive group and at position 49 (altered in 3.1% of cases) in the DMD oncogenic group (Fig. 6D [red arrows], 6E and Fig. S4). The distribution of DMD alterations significantly differs between the DMD‐suppressive and DMD‐oncogenic groups (Fig. 6D, P < 0.0001, Fisher's exact test on raw sample counts with/without alterations). A total of 206 DMD variants were identified from 153 samples (out of 2148 total cases) in the aggressive/DMD‐suppressive group (predominantly missense mutations) compared to only 49 DMD variants from 33 samples (out of 1093 total cases) in the less aggressive/DMD‐oncogenic group (Fig. 6E). Thus, these data support our hypothesis and the classification of the DMD suppressive tumour group as more aggressive than the DMD oncogenic tumour group. This highlights a complex relationship between DMD expression and tumour aggressiveness.
DMD acts as a tumour suppressor in more aggressive cancers and as an oncogene in less aggressive tumours. (A) Time to death distributions for the groups of tumours where high DMD is associated with better (DMD suppressive, n = 588) or worse (DMD oncogenic, n = 205) survival. A chi‐squared test (χ2(2) = 11.52, P = 0.0031) confirmed a significant difference between the two groups. (B) Overall survival for the proposed less aggressive/DMD oncogenic (n = 205) versus aggressive/DMD suppressive (n = 574) group, log rank test P value = 0.003. (C) Oncoplots of the DMD suppressive (top) and DMD oncogenic (bottom) tumour groups showing the top 50 mutated genes in each cohort. The position of DMD within each group is indicated by a red arrow. (D) Aggregated altered/unaltered sample counts across the top 50 genes for each group, χ2(1) = 5604, P < 0.0001. (E) The percentage of DMD gene alterations per group are shown, the distribution of alterations differs between the DMD‐suppressive and DMD‐oncogenic groups (P < 0.0001, Fisher's exact test on raw sample counts with/without alterations).
Proposed model and evaluation
The distinct pathway enrichment profiles and our survival and alteration frequency analyses presented above support a context‐dependent role for DMD (and most notably, the Dp71ab gene product) in cancer, which reconciles conflicting reports of its oncogenic versus tumour‐suppressive functions. Based on these findings, we propose a unified model in which DMD acts as a tumour suppressor in aggressive cancers but exhibits oncogenic properties in less aggressive cancers (Fig. 7). For this model, we define aggressive cancers as those typically characterised by a combination of high metastatic potential, poor overall survival, frequent recurrence, resistance to therapy and a high burden of genetic alterations, with multiple factors typically present. Based on our findings here and the literature [2], we additionally theorise that DMD is more frequently mutated and/or downregulated in aggressive tumours (Fig. 7). To validate the model, we examined additional cancers known from the literature to also be significantly associated with DMD expression but that were not identified as significant in our bioinformatic analysis when stringently adjusting for multiple comparisons. These were sarcoma, head and neck squamous cell carcinoma (HNSCC) and mesothelioma. Based on previously published known survival associations, sarcoma and HNSCC belong to the DMD‐suppressor group, since high DMD expression is associated with improved survival [9, 12, 26], while mesothelioma aligns with the DMD‐oncogenic group, since high DMD expression correlates with poorer survival [7]. For our model to stand, sarcoma and HNSCC should be considered as aggressive, whilst our model posits that mesothelioma be less aggressive. Sarcoma and HNSCC are indeed highly aggressive and metastatic cancers with early and frequent distant spread [27, 28] supporting their categorisation into our more aggressive/DMD suppressive group (Table 1). Additionally, sarcoma (which has high genomic instability [29]) and head and neck cancer are also amongst the tumours with the highest number of DMD alterations [2] and HNSCC appears amongst the lists of tumours where DMD expression is significantly downregulated compared to control tissue [8]. HNSCC is recognised for therapy resistance and high recurrence rates, further supporting our model classification [30]. Moreover, in a recent focused study of DMD in HNSCC, we also revealed an upregulation of ECM structure and ECM organisation processes in DMD high versus low tumours, in alignment with the DMD suppressive group presented here [12]. Whilst mesothelioma has a poor prognosis, it remains largely confined to its site of origin, primarily spreading via local invasion rather than distant dissemination [31]. DMD alterations are also less frequent in mesothelioma, and it has a low tumour mutation burden [2, 32]. Given our model's definition of aggressive, mesothelioma can fit as a less aggressive tumour despite some inconsistencies (Table 1). Thus, our model for the first time successfully integrates conflicting findings on DMD's oncogenic versus tumour‐suppressive behaviours, demonstrating that DMD behaves as a tumour suppressor in more characteristically metastatic (i.e. aggressive) cancers but exhibits oncogenic properties in less aggressive, locally invasive tumours (Fig. 7 and Table 1). These findings provide a unifying framework for interpreting the role of DMD and its gene products in cancer progression and lay the groundwork for further functional validation.
A unified model for DMD gene involvement in cancer. In less aggressive tumours high DMD expression leads to poor survival, whereas in aggressive tumours, high DMD expression is associated with better survival outcomes. However, in aggressive tumours, DMD is more frequently downregulated and/or mutated leading to low DMD expression and poor survival. We therefore propose that DMD can act as a tumour suppressor or an oncogene in a context‐dependent manner during tumorigenesis.
Discussion
We comprehensively explored the prognostic significance of DMD and DAPC gene expression across TCGA cancer types. We identified nine cancers where high versus low DMD expression was significantly associated with overall survival and present a model for a context‐dependent dual role of DMD in cancer that reconciles previous conflicting reports. In aggressive tumours with high metastatic potential, low DMD expression correlates with poor survival, supporting a tumour suppressor function. Additionally, the higher frequency of DMD mutations in this group suggests a selective pressure for DMD loss in aggressive cancers, reinforcing its tumour‐suppressive role. Conversely, in less aggressive tumours, high DMD expression correlates with poor survival, suggesting an oncogenic role in these settings. Our study highlights Dp71ab as an important dystrophin variant influencing tumorigenesis and survival in alignment with total DMD survival trends. We also found that the relatively poorly characterised dystrophin isoform, Dp40, was expressed in all nine cancers. We present evidence that the role of DMD and dystrophin variants in cancer may be linked to a subset of signalling and adhesion‐related DAPC components, which cluster separately from the sarcoglycans, suggesting that DMD may influence tumour progression via signalling pathways rather than mechanical stability alone. Investigating the mechanistic roles of DMD gene product expression in driving tumour aggression and/or modulating oncogenic transcriptional programs was beyond the scope of this in silico study; this remains a critical knowledge gap that warrants a focused in‐depth investigation.
We tested our model, confirming its consistency with established findings in the literature. Our own prior work in LGG and HNSCC [10, 12] provides immunohistochemical validation, confirming dystrophin protein expression in both the nucleus and cytoplasm of tumour cells. Notably, a significant correlation between dystrophin protein expression and patient survival is observed, reinforcing survival trends seen at the RNA level and demonstrating the clinical relevance of dystrophin protein localisation in tumour biology. Our model is further supported by the observation that DMD survival trends differ between less and more aggressive cancers of the same tissue type. For instance, DMD expression is prognostic in low‐grade glioma (LGG) but not in the more aggressive glioblastoma [10].
Using a mathematical approach, Padder et al. [33] also recently developed a model that simulates interactions between dystrophin and tumour microenvironment components to predict how changes in dystrophin levels affect tumour growth and progression. Their model only focuses on tumours where downregulated dystrophin is correlated with reduced survival (i.e., the aggressive tumour group in our model). Their bifurcation analyses suggest that, in these tumours, the strength of feedback between dystrophin expression and tumour growth is a critical factor influencing stability. Their simulations, in line with our model, suggest that when dystrophin is lost, the tumour destabilises faster, pushing it towards uncontrolled growth, suggesting that dystrophin helps regulate tumour dynamics. Our model supports and extends this to show that DMD has both tumour‐suppressive and oncogenic roles, depending on the context. It unifies existing conflicting knowledge into a single model, addressing cancers where low DMD is harmful as well as those where low DMD is beneficial.
Whilst other DMD transcripts and dystrophin proteins may be relevant to tumourigenesis in some specific contexts [34], our work supports Dp71ab as a ubiquitously expressed key player in DMD‐associated cancers. Functionally, previous studies in sarcoma and HNSCC cell models have shown that Dp71ab overexpression leads to reduced proliferation [12, 26], aligning with our proposed tumour‐suppressive role for DMD in aggressive sarcomas and HNSCC. The ablation of Dp71 isoforms lacking exon 78 (collectively known as Dp71f) in sarcoma cell lines has also been shown to increase proliferation, enhance colony formation and disrupt ECM‐receptor interaction pathways [9], providing further support for our model. Though no significant changes in migration or invasion assays in this study were observed, there was an increase in the levels of matrix metalloproteases (MMP) 9 and 2 released into the media in Dp71f ablated cells compared to control. MMPs are recognised to facilitate tumour cell invasion and metastasis by degrading the ECM [35, 36].
While our findings provide strong support for a dual role of DMD in cancer, we acknowledge limitations. We have defined aggressiveness based on several factors including metastatic potential instead of just survival rates, but we recognise that labelling tumours simply as aggressive/less aggressive does not fully capture the complexity of tumour behaviour, which is influenced by molecular, genetic and environmental factors. Survival trends (and DMD transcript expression) may also not be uniform across all tumour subtypes and may be confounded by clinicopathological variables. Indeed, we have previously shown differences across IDH wild‐type and mutant LGG subtypes and HPV positive and negative HNSCC subtypes [10, 12] highlighting heterogeneity across tumour subtypes that our model does not necessarily capture. While functional validation now exists for several cancers [9, 10, 12, 26], more work is required to establish clear mechanisms and validate DMD/Dp71ab as a therapeutic target in physiologically relevant model systems.
Currently, most studies on DMD‐associated cancers have ignored the complex pattern of DMD gene product expression and the multiple isoforms of Dp71; our model is also not yet fully tested to this level of complexity. A current limitation of the field is the lack of suitable antibody reagents that distinguish the different Dp protein gene products expressed in cancer tissues. Nonetheless, there is precedent for genes to act as either a tumour suppressor or oncogene, depending on context. For example, full‐length isoforms of the transcription factor p63 (Tap63 isoforms) are tumour suppressive in some contexts, but the N‐terminally truncated ΔNp63 isoforms are oncogenic in others [37, 38, 39]. Whilst we are not implying there is a correlation of DMD with p63 status, our work provides robust evidence for a similar context‐dependent role for DMD, where its high expression may support tumour‐promoting processes in some cancers while reinforcing tumour‐suppressive mechanisms in others. Previously, we suggested that the ratio of Dp427 to Dp71, rather than their absolute levels, may be a key factor in disease progression [2]. While this balance may still play a role, our updated model expands on this by demonstrating that total DMD expression, in a context‐dependent manner, is also a critical determinant of tumour behaviour. This broader perspective integrates both gene product levels and tumour‐specific factors to better explain the dual role of DMD in cancer progression. As the field begins to move towards validating DMD and/or its gene products as therapeutic targets in cancer, it is vital to consider context such as tumour type/subtype, stage, and microenvironment to avoid unintended consequences.
Conclusions
Our findings reinforce a nuanced role for DMD in tumorigenesis. In aggressive cancers, high DMD expression appears to preserve DAPC‐mediated signalling and adhesion, countering metastatic potential, whereas in less aggressive tumours, elevated DMD may drive oncogenic pathways through enhanced cellular remodelling. This duality offers a novel perspective with significant implications for developing targeted therapeutic strategies that must consider the distinct tumour context.
Conflict of interest
The authors declare no conflict of interest.
Author contributions
LM and KA conceived the project; LM conducted most data analyses and prepared the first draft of the manuscript. KA helped to conceive and supervised the project, contributed data analysis, and critically edited the manuscript. LJ, MN, and SD contributed to data analysis and critically edited the manuscript. All authors have read and approved the final version of the manuscript.
Supporting information
Fig. S1. DMD expression is significantly associated with survival in specific tumour types. Fig. S2. Hazard ratios of TCGA tumours expressing specific DMD gene products. Fig. S3. Association of DAPC gene expression with hazard ratios in selected TCGA tumours. Fig. S4. DMD mutation frequencies across the aggressive/DMD suppressive and less aggressive/DMD oncogenic groups.
The reference list from the paper itself. Each links out to its DOI / PubMed record.
- 1Mc Avoy S , Ganapathiraju SC , Ducharme‐Smith AL , Pritchett JR , Kosari F , Perez DS , Zhu Y , James CD and Smith DI (2007) Non‐random inactivation of large common fragile site genes in different cancers. Cytogenet Genome Res 118, 260–269.18000379 10.1159/000108309 · doi ↗ · pubmed ↗
- 2Jones L , Naidoo M , Machado LR and Anthony K (2020) The Duchenne muscular dystrophy gene and cancer. Cell Oncol 1, 19–32.10.1007/s 13402-020-00572-y PMC 790693333188621 · doi ↗ · pubmed ↗
- 3Ervasti JM and Campbell KP (1993) A role for the dystrophin‐glycoprotein complex as a transmembrane linker between laminin and actin. J Cell Biol 122, 809–823.8349731 10.1083/jcb.122.4.809PMC 2119587 · doi ↗ · pubmed ↗
- 4Whitmore C and Morgan J (2014) What do mouse models of muscular dystrophy tell us about the DAPC and its components? Int J Exp Pathol 95, 365–377.25270874 10.1111/iep.12095 PMC 4285463 · doi ↗ · pubmed ↗
- 5Constantin B (2014) Dystrophin complex functions as a scaffold for signalling proteins. Biochim Biophys Acta 1838, 635–642.24021238 10.1016/j.bbamem.2013.08.023 · doi ↗ · pubmed ↗
- 6Emery AEH (2002) Muscular dystrophy into the new millennium. Neuromuscul Disord 12, 343–349.12062251 10.1016/s 0960-8966(01)00303-0 · doi ↗ · pubmed ↗
- 7Alnassar N , Derry JMJ , Banna GL and Gorecki DC (2024) Differential expression of DMD transcripts as a novel prognostic biomarker in histologically diverse mesotheliomas. Transl Lung Cancer Res 13, 733–748.38736495 10.21037/tlcr-24-28PMC 11082705 · doi ↗ · pubmed ↗
- 8Alnassar N , Borczyk M , Tsagkogeorga G , Korostynski M , Han N and Górecki DC (2023) Downregulation of dystrophin expression occurs across diverse tumors, correlates with the age of onset, staging and reduced survival of patients. Cancers (Basel) 15, 1378.36900171 10.3390/cancers 15051378 PMC 10000051 · doi ↗ · pubmed ↗