Risk Assessment of Venous Thromboembolism in Neurocritical Patients: Construction and Validation of a Clinical Prediction Model
Meili Zhou, Rui Wang, Longhai Zhu, Chentao Wang, Weidong Hu, Jijun Shi

TL;DR
This study creates a prediction model to assess the risk of blood clots in critically ill neurology patients, helping doctors prevent such events more effectively.
Contribution
The study introduces a validated clinical prediction model specifically tailored for venous thromboembolism risk in neurocritical patients.
Findings
The model achieved strong discrimination with an AUC of 0.763 in training and 0.809 in testing.
Key predictors included age, NICU length of stay, APTT, D-dimer, and clinical factors like tracheotomy and antibiotic use.
The model showed good calibration and consistent clinical net benefit across risk thresholds.
Abstract
Venous thromboembolism (VTE) remains a significant challenge in neurocritical care, with limited tailored risk assessment tools available for clinical practice. This study aimed to develop and validate a practical prediction model to support VTE prevention strategies in neurocritical patients. A total of 605 neurocritical patients were retrospectively enrolled in the neurologic intensive care unit (NICU) from May 2022 to April 2024. The eligible patients were randomly divided into a training dataset and a testing dataset in a ratio of 7:3. Variables with significant univariate effects in the training dataset were selected for multivariable stepwise regression analysis. The model fitting goodness was tested using the Hosmer–Lemeshow test, the area under the receiver operating characteristic (ROC) curve (AUC) was used to evaluate the model discrimination, and decision curve analysis…
Genes, proteins, chemicals, diseases, species, mutations and cell lines named across the full text — each resolved to its canonical identifier and authoritative record.
Click any figure to enlarge with its caption.
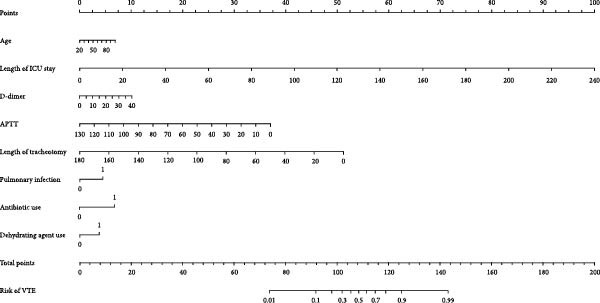 Figure 1
| Variable | Training dataset ( | Testing dataset ( | |||||
|---|---|---|---|---|---|---|---|
|
Non‐VTE ( |
VTE ( |
|
Non‐VTE ( |
VTE ( |
| ||
| Age (years) | 70.00 (57.50–79.00) | 72.50 (66.00–80.00) | 0.046 | 69.50 (58.00–78.00) | 74.00 (64.50–83.75) | 0.009 | |
| Gender | — | — | 0.661 | — | — | 0.683 | |
| Female, | 111 (35.24%) | 42 (38.18%) | — | 46 (34.33%) | 18 (39.13%) | — | |
| Male, | 204 (64.76%) | 68 (61.82%) | — | 88 (65.67%) | 28 (60.87%) | — | |
| BMI (kg/m2) | 23.66 (21.25–26.60) | 22.89 (20.99–24.99) | 0.145 | 23.82 ± 4.04 | 23.96 ± 4.56 | 0.842 | |
| NLR | 8.47 (5.06–13.08) | 10.21 (6.40–15.42) | 0.034 | 9.10 (4.94–14.67) | 11.15 (4.83–17.02) | 0.293 | |
| Creatinine (μmol/L) | 66.00 (52.00–83.50) | 72.50 (57.25–107.75) | 0.042 | 67.00 (53.00–87.00) | 74.50 (60.50–92.00) | 0.188 | |
| CRP (mg/L) | 10.30 (5.30–45.55) | 17.55 (5.30–49.67) | 0.570 | 10.85 (5.30–50.55) | 11.00 (5.40–65.35) | 0.618 | |
| PT (s) | 13.30 (12.25–14.10) | 13.36 (12.50–14.20) | 0.408 | 13.30 (12.33–14.30) | 13.50 (12.03–14.17) | 0.651 | |
| APTT (s) | 31.50 (26.30–36.05) | 29.40 (24.88–34.75) | 0.025 | 31.30 (25.97–37.38) | 28.55 (26.27–34.20) | 0.164 | |
| Fibrinogen (g/L) | 3.31 (2.59–4.45) | 3.70 (2.73–4.36) | 0.179 | 3.41 (2.60–4.74) | 3.48 (2.75–4.60) | 0.836 | |
| D‐dimer (μg/mL) | 1.52 (0.70–3.38) | 2.14 (1.07–6.84) | 0.003 | 1.41 (0.69–2.90) | 2.50 (1.02–9.51) | 0.006 | |
| INR | 1.06 (1.00–1.14) | 1.08 (1.03–1.17) | 0.063 | 1.08 (1.00–1.15) | 1.08 (1.00–1.18) | 0.584 | |
| Length of ICU stay (day) | 10.00 (5.00–16.00) | 16.00 (11.00–28.00) | <0.001 | 9.00 (5.25–14.75) | 17.00 (11.25–26.75) | <0.001 | |
| Length of CVC (day) | 2.00 (0.00–12.00) | 12.00 (1.00–22.00) | <0.001 | 0.00 (0.00–10.00) | 14.50 (0.50–20.50) | <0.001 | |
| Length of tracheal intubation (day) | 0.00 (0.00–2.00) | 0.00 (0.00–10.00) | 0.003 | 0.00 (0.00–4.00) | 0.00 (0.00–10.00) | 0.100 | |
| Length of ventilator use (day) | 0.00 (0.00–2.00) | 0.00 (0.00–12.25) | 0.002 | 0.00 (0.00–4.00) | 0.00 (0.00–15.00) | 0.018 | |
| Length of tracheotomy (day) | 0.00 (0.00–0.00) | 0.00 (0.00–0.00) | 0.002 | 0.00 (0.00–0.00) | 0.00 (0.00–0.00) | <0.001 | |
| Etiology, | — | — | 0.135 | — | — | <0.001 | |
| Ischemic stroke | 218 (69.21%) | 80 (72.73%) | — | 87 (64.93%) | 33 (71.74%) | — | |
| Intracerebral hemorrhage | 14 (4.44%) | 9 (8.18%) | — | 5 (3.73%) | 8 (17.39%) | — | |
| Other | 83 (26.35%) | 21 (19.09%) | — | 42 (31.34%) | 5 (10.87%) | — | |
| Complications, | |||||||
| Pulmonary infection | 135 (42.86%) | 60 (54.55%) | 0.045 | 47 (35.07%) | 18 (39.13%) | 0.752 | |
| Gastrointestinal bleeding | 49 (15.56%) | 37 (33.64%) | <0.001 | 25 (18.66%) | 14 (30.43%) | 0.143 | |
| Epilepsy | 2 (0.63%) | 0 (0.00%) | 0.977 | 1 (0.75%) | 1 (2.17%) | 1.000 | |
| Electrolyte disturbance | 189 (60.00%) | 77 (70.00%) | 0.080 | 68 (50.75%) | 29 (63.04%) | 0.203 | |
| Thrombolysis therapy, | 25 (7.94%) | 11 (10.00%) | 0.638 | 12 (8.96%) | 2 (4.35%) | 0.492 | |
| CVC, | 167 (53.02%) | 84 (76.36%) | <0.001 | 66 (49.25%) | 34 (73.91%) | 0.006 | |
| Tracheal intubation (day) | 109 (34.60%) | 50 (45.45%) | 0.056 | 49 (36.57%) | 20 (43.48%) | 0.512 | |
| Ventilator use (day) | 108 (34.29%) | 51 (46.36%) | 0.032 | 49 (36.57%) | 21 (45.65%) | 0.360 | |
| Tracheotomy (day) | 17 (5.40%) | 16 (14.55%) | 0.004 | 2 (1.49%) | 9 (19.57%) | <0.001 | |
| Sedation, | 115 (36.51%) | 56 (50.91%) | 0.011 | 56 (41.79%) | 17 (36.96%) | 0.688 | |
| Analgesia, | 105 (33.33%) | 49 (44.55%) | 0.046 | 50 (37.31%) | 21 (45.65%) | 0.410 | |
| Vasoactive agent, | 89 (28.25%) | 33 (30.00%) | 0.821 | 36 (26.87%) | 14 (30.43%) | 0.783 | |
| Antibiotic use, | 246 (78.10%) | 104 (94.55%) | <0.001 | 101 (75.37%) | 40 (86.96%) | 0.150 | |
| Dehydrating agent use, | 177 (56.19%) | 83 (75.45%) | <0.001 | 70 (52.24%) | 37 (80.43%) | 0.001 | |
| Variables |
| SE |
|
| OR | 95% CI |
|---|---|---|---|---|---|---|
| Constant | −2.927 | 0.840 | −3.483 | 0.001 | 0.054 | 0.010–0.278 |
| Age | 0.012 | 0.009 | 1.413 | 0.158 | 1.013 | 0.995–1.030 |
| Length of ICU stay | 0.055 | 0.015 | 3.732 | <0.001 | 1.056 | 1.026–1.087 |
| APTT | −0.037 | 0.015 | −2.516 | 0.012 | 0.964 | 0.936–0.992 |
| D‐dimer | 0.035 | 0.015 | 2.361 | 0.018 | 1.035 | 1.006–1.065 |
| Length of tracheotomy day | −0.046 | 0.017 | −2.711 | 0.007 | 0.955 | 0.923–0.987 |
| Pulmonary infection | 0.564 | 0.290 | 1.946 | 0.052 | 1.758 | 0.996–3.105 |
| Antibiotic use | 0.809 | 0.480 | 1.685 | 0.092 | 2.246 | 0.876–5.759 |
| Dehydrating agent use | 0.476 | 0.276 | 1.722 | 0.085 | 1.610 | 0.936–2.767 |
- —Shaanxi Provincial Natural Science Basic Research Program
- —Nuclear Medical Technology Innovation Key Project
- —Suzhou Science and Technology Development Plan Project
- —Clinical Research Center of Neurological Disease of the Second Affiliated Hospital of Soochow University
- —Jiangsu Provincial Medical Key Discipline
- —Project of China International Medical Foundation
Peer Reviews
No public reviews on file for this paper yet. If you reviewed it on a platform where reviews are public (OpenReview, ICLR, NeurIPS, ICML), you can paste yours below so the community can read it here.
Videos
No videos yet. Explain this paper in a talk, walkthrough, or lecture? Add one.
Taxonomy
TopicsVenous Thromboembolism Diagnosis and Management · Sepsis Diagnosis and Treatment · Atrial Fibrillation Management and Outcomes
1. Introduction
Venous thromboembolism (VTE), which includes deep vein thrombosis (DVT) and pulmonary embolism (PE), is a common complication in neurocritical patients [1]. Literature reports that the incidence of DVT after craniotomy in brain tumor patients is 10.5%−12.34% [2, 3], the VTE incidence in ischemic stroke patients is 2.5% [4], and the VTE incidence in patients with traumatic brain injury is 21% [5]. Neurocritical patients refer to those suffering from neurological diseases and have organ dysfunction (or are at risk of potential organ dysfunction). Due to paralysis and prolonged coma leading to blood stasis, their incidence of VTE is higher than other patients [6, 7].
In patients with severe neurological conditions, ~3/4 of thrombus occurrences are located in either one or both sided muscular veins. Literature reports that 50% of venous thrombi in the lower limbs originate from calf vein thrombi, and 50% of calf vein thrombi come from the intermuscular veins of the calf [8]. DVT incidence was 35.7% and 75.6% were in the muscular calf vein 1 week after neurologic intensive care unit (NICU) hospitalization [6]. DVT not only exacerbates patient suffering and diminishes quality of life but also increases the risk of in‐hospital mortality and medical expenses, thereby contributing to a substantial disease burden [9]. Consequently, the prevention and effective management of DVT are of paramount importance in clinical practice. Neurocritical care patients are presumed to be at high risk for VTE; however, data regarding risk factors in this population are limited [6, 10–13]. Therefore, it is crucial to explore the risk factors for VTE occurrence and establish a prediction model for neurocritical patients, so as to early identify, prevent, and treat neurocritical patients with high VTE risks.
Currently, clinical prediction models as quantitative tools for risk assessment are widely used in the health field. However, these models are less applied in VTE for neurocritical patients, and the quality and applicability of these models in clinical practice and future research remain unknown. A systematic review in 2021 evaluating risk assessment models for VTE in hospitalized adults demonstrated that Caprini RAM (22 studies), Padua prediction score (16 studies), IMPROVE models (8 studies), the Geneva risk score (4 studies), and the Kucher score (4 studies) have generally weak predictive accuracy [13]. There is insufficient evidence and too much heterogeneity to recommend the use of any particular RAM [13]. A 2024 meta‐analysis of nine DVT prediction models in acute stroke patients reported an incidence of 0.4%–28%, identified D‐dimer and age as common predictors, and showed area under the receiver operating characteristic (ROC) curves (AUCs) of 0.70–0.912, although all models carried a high risk of bias [14]. Meanwhile, the logistic regression analysis model can effectively explain the direction of variable effects and relative risk.
In this study, we develop an optimized VTE risk prediction model for neurocritical patients through integrated RF and logistic regression analyses, providing an evidence‐based tool for clinical prevention and management.
2. Materials and Methods
2.1. Participants
This study was designed as a single‐center retrospective cohort study. Patients with neurological critical illness who were admitted to the NICU of the Second Affiliated Hospital of Soochow University between May 2022 and April 2024 were enrolled in this study. Patients with hospitalization durations of 48 h or less or missing data were excluded. All participants received comprehensive VTE prophylaxis in accordance with current clinical guidelines [15, 16]. Enrolled patients were stratified into different VTE risk levels based on the Caprini score or Padua score, and prophylactic protocols were selected accordingly. Preventive measures included mechanical prophylaxis (intermittent pneumatic compression and lower‐limb elevation), pharmacologic prophylaxis with low‐molecular‐weight heparin when not contraindicated, or a combination of both. The selection and timing of prophylactic strategies were individually determined by experienced neurocritical care physicians according to each patient’s VTE risk profile and bleeding tendency, assessed using guideline‐recommended tools.
2.2. Data Collection
Demographic characteristics include age, gender, body mass index (BMI), risk factors, medical history, clinical laboratory parameters such as white blood cell (WBC) count, hemoglobin (Hb), platelet (PLT) count, albumin (ALB), total cholesterol (TC), triglycerides (TGs), high‐density lipoprotein cholesterol (HDL‐C), low‐density lipoprotein cholesterol (LDL‐C), homocysteine (HCY), D‐dimers, C‐reactive protein, etc., were collected. Comorbidities—including pulmonary infection, gastrointestinal bleeding, and epilepsy—were collected through the hospital information system during admission assessment and clinical management. Treatment modalities, such as thrombolytic therapy, anticoagulation, and anti‐PLT therapy, antibiotic use, and administration of dehydrating agents, as well as the duration of tracheotomy, length of stay in the ICU, and imaging findings, were also recorded.
2.3. Measurements of DVT and PE
In‐hospital VTE was defined as a newly diagnosed acute episode of DVT (involving either the upper or lower extremities) or PE, or both, confirmed by duplex venous ultrasonography, computed tomographic venography (CTV), computed tomographic pulmonary angiography (CTPA), or ventilation–perfusion (V/Q) lung scan, occurring more than 24 h after hospital admission [1, 10]. Lower extremity vascular ultrasound was performed using a Mindray portable color Doppler system (Model: M9) equipped with a high‐frequency linear probe (L12‐4S; 3–13 MHz). To monitor for DVT, routine duplex ultrasonography was conducted at the time of admission and was repeated during hospitalization if patients exhibited elevated D‐dimer levels, limb swelling, or localized pain. In cases where patients presented with elevated D‐dimer levels, tachypnea, abnormal electrocardiographic findings, signs of respiratory failure, or other clinical features highly suggestive of PE, CTPA was employed to confirm the diagnosis. However, due to the poor baseline condition and multiple comorbidities commonly observed in patients with severe neurological disorders, many were unable to tolerate this imaging procedure. In addition, multiple measures were implemented for the prevention of VTE. As a result, no cases of confirmed PE were identified in this study. All imaging assessments were conducted by a team of experienced radiologists. The occurrence of VTE and relevant clinical outcomes were documented throughout the hospital stay.
2.4. Statistical Analysis
Multiple imputation was used to handle missing values (missing rate <5%). The detailed procedures for data imputation and variable selection are provided in the Supporting Information. Categorical variables were presented as frequencies and percentages, and comparisons between groups were made using the χ ^2^ test or Fisher’s exact probability method; continuous variables that followed a normal distribution were statistically described as mean ± SD; if they did not follow a normal distribution, they were statistically described as M (P25, P75), and comparisons between groups were made using the t‐test or Mann–Whitney U test. The eligible patients were randomly divided into a training dataset (425 patients) and a testing dataset (180 patients) in a ratio of 7:3. Using whether to develop VTE as the dependent variable, univariate analysis was performed first. Multivariate Logistic regression analysis was performed by including all variables with p < 0.05 in univariate analysis in the training dataset. The variance inflation factor (VIF) was used for collinearity diagnosis of independent variables, and VIF > 10 indicated multicollinearity between independent variables. The nomogram was established by the independent predictors for VTE and internally validated with the data of the training dataset, and externally validated with the data of the testing dataset. The model fitting goodness was tested using the Hosmer–Lemeshow test, the AUC was used to evaluate the model discrimination, and decision curve analysis (DCA) was used to test the clinical value of the model. Data analysis was performed using R4.3.2 software, and the nomogram was constructed based on the “rms” package. The significance level was set at two‐sided α = 0.05.
3. Results
3.1. Demographic and Clinical Characteristics of Neurocritical Patients in the Training Dataset and Testing Dataset
A total of 676 patients with neurological critical illness were enrolled retrospectively. In total, 605 patients were retrospectively analyzed after excluding 56 cases with missing data and 15 cases with less than 48 h of hospitalization. In the 605 neurocritical patients, the VTE incidence was 25.8% (156/605). The overall pattern of missing data was evaluated (Figure S1). The distribution of imputed data was highly consistent with the original data, supporting the reliability of the imputation results (Figure S2).
Baseline characteristics of the study population are summarized in Table 1, and detailed subgroup comparisons are provided in Table S1. The VIF results for all included variables are presented in Table S2. The results demonstrated that VTE patients were significantly older (training cohort: median 72.5 vs. 70.0 years, p = 0.046; testing cohort: 74.0 vs. 69.5 years, p = 0.009) and had substantially longer ICU stays (training: 16 vs. 10 days, p < 0.001; testing: 17 vs. 9 days, p < 0.001). Key laboratory differences included lower activated partial thromboplastin time (APTT) (training: 29.4 vs. 31.5 s, p = 0.025) and elevated D‐dimer levels (training: 2.14 vs. 1.52 μg/mL, p = 0.003; testing: 2.50 vs. 1.41 μg/mL, p = 0.006) in VTE patients. Clinical interventions showed significant associations, with higher rates of tracheostomy (training: 14.55% vs. 5.40%, p = 0.004; testing: 19.57% vs. 1.49%, p < 0.001), antibiotic use (training: 94.55% vs. 78.10%, p < 0.001), and dehydrating agent administration (training: 75.45% vs. 56.19%, p < 0.001; testing: 80.43% vs. 52.24%, p = 0.001) in the VTE groups. No significant differences were observed in gender distribution, BMI, or most routine laboratory parameters between groups. These findings collectively identify critical risk factors that can inform surveillance protocols for high‐risk neurocritical patients.
3.2. Multivariate Logistic Regression Analysis for the Risk Factors Associated With VTE
In the training set (Table 1), a single‐factor analysis was conducted on the variables included in the study between the two groups, and 21 variables had statistically significant differences between the two groups (p < 0.05). Table 2 presents the final multivariate logistic regression model for VTE risk prediction in neurocritical patients. The analysis identified eight significant predictors: age (OR = 1.013, 95% CI: 0.995–1.030, p = 0.158), length of ICU stay (OR = 1.056, 95% CI: 1.026–1.087, p < 0.001), APTT (OR = 0.964, 95% CI: 0.936–0.992, p = 0.012), D‐dimer (OR = 1.035, 95% CI: 1.006–1.065, p = 0.018), length of tracheotomy (OR = 0.955, 95% CI: 0.923–0.987, p = 0.007), pulmonary infection (OR = 1.758, 95% CI: 0.996–3.105, p = 0.052), antibiotic use (OR = 2.246, 95% CI: 0.876–5.759, p = 0.092), and dehydrating agent use (OR = 1.610, 95% CI: 0.936–2.767, p = 0.085). Notably, prolonged ICU stay and elevated D‐dimer levels showed the strongest positive associations with VTE risk, while higher APTT values and longer tracheotomy duration appeared protective. The model demonstrated good predictive accuracy (AUC = 0.763 in training, 0.809 in testing) and calibration (Hosmer–Lemeshow p = 0.126), suggesting its potential utility for risk assessment in neurocritical care settings. These findings highlight modifiable clinical factors (e.g., infection control and medication management) that could be prioritized in nursing care plans for VTE prevention.
3.3. Development of a Nomogram Predicting the Risk of VTE in Neurocritical Patients
Figure 1 presents a clinically practical nomogram developed from the multivariate logistic regression model to predict individualized VTE risk in neurocritical patients. Based on the stepwise regression results, the VTE risk prediction model is established as follows: Z = −2.927 + 0.012 × age + 0.055 length of ICU stay − 0.037 × APTT + 0.035 × D‐dimer − 0.046 × length of tracheotomy + 0.564 × pulmonary infection + 0.809 × antibiotic use + 0.476 × dehydrating agent use.
Nomogram for predicting the risk of VTE in neurocritical patients.
Each variable was assigned weighted points on a 0–100 scale, with D‐dimer levels and ICU stay duration contributing most significantly to the total score. The clinicians can readily use this tool by plotting patient‐specific values for each parameter, summing the corresponding points, and mapping the total score to a predicted VTE probability ranging from <10% (low risk) to >60% (high risk). The nomogram’s alignment with established risk factors (e.g., D‐dimer) while incorporating neurocritical‐specific elements (e.g., dehydrating agents) enhances its clinical utility for clinical assessment. The clear graphical presentation facilitates rapid risk stratification without complex calculations, making it particularly valuable for time‐sensitive nursing interventions in critical care settings.
The predictors that ultimately entered the prediction model were age, length of ICU stay, APTT, D‐dimer, length of tracheotomy, pulmonary infection, antibiotic use, and dehydrating agent use.
3.4. The Evaluation and Validation of the Nomogram Model Predicting the Risk of VTE in Neurocritical Patients
Figures 2–4 collectively demonstrate the robust predictive performance and clinical utility of the VTE risk model. Figure 2 presents calibration plots showing excellent agreement between predicted and observed VTE probabilities in both training (mean absolute error = 0.034) and testing (mean absolute error = 0.032) cohorts, with Hosmer–Lemeshow p‐values of 0.126 and 0.823, respectively, indicating no significant deviation from perfect calibration. Figure 3 displays AUC values of 0.763 (95% CI: 0.714–0.811) for the training set and 0.809 (95% CI: 0.732–0.885) for the testing set, confirming the model’s strong discriminatory ability to distinguish high‐risk patients. Figure 4’s DCA reveals superior net benefit across clinically relevant probability thresholds (10%–40%) compared to “treat‐all” or “treat‐none” strategies, particularly in the 20%–30% risk range where preventive interventions would typically be considered. These results validate the model’s reliability for clinical decision‐making, as it consistently identifies true‐positive cases while minimizing unnecessary prophylaxis in low‐risk patients. The combination of statistical rigor and clinical interpretability makes this tool particularly valuable to implement risk‐stratified prevention protocols in neurocritical care units.
Figure 2. The calibration chart of the nomogram model predicting VTE in the training dataset (A) and the testing dataset (B).(A)(B)
Figure 3. Nomogram model predicts the ROC curve of VTE in the training dataset (A) and the testing dataset (B). ROC, receiver operating characteristic.(A)(B)
Figure 4. The DCA of the nomogram model of VTE in the training dataset (A) and the testing dataset (B).(A)(B)
4. Discussion
This study successfully developed and validated a practical VTE risk prediction model specifically tailored for neurocritical care patients, addressing a critical gap in current assessment tools. Our findings demonstrate that eight clinically accessible variables—age, length of ICU stay, APTT, D‐dimer, tracheotomy duration, pulmonary infection, antibiotic use, and dehydrating agents—can effectively predict VTE risk. The model demonstrated excellent predictive accuracy with an AUC of 0.809 in the testing cohort, outperforming many existing general risk assessment tools. Compared with previous studies, this study integrates a more comprehensive set of laboratory parameters, clinical comorbidities, and invasive procedures, thereby enhancing its clinical relevance and applicability.
Due to paralysis and central nervous system disorders, patients in the neurocritical care unit are often at higher risk for VTE. All patients in our study underwent systematic VTE screening upon admission, followed by dynamic surveillance and re‐evaluation guided by clinical symptoms and coagulation parameters. This protocol significantly improved the detection rate of asymptomatic VTE. Although asymptomatic VTE may not pose an immediate life‐threatening risk in neurocritical patients, it can complicate therapeutic strategies and negatively impact long‐term outcomes.
This study developed a risk prediction model for VTE in neurocritical care patients by integrating an RF algorithm with logistic regression analysis, and visualized the model using a nomogram. The model demonstrated excellent discriminatory ability, achieving an AUC of 0.809, outperforming previously established models by Pan et al. (AUC = 0.756) [17] and Cheng et al. (AUC = 0.767) [18]. Calibration assessed via the Hosmer–Lemeshow goodness‐of‐fit test indicated satisfactory agreement between predicted and observed outcomes. Additionally, five‐fold cross‐validation confirmed the model’s stable predictive performance and robust discrimination, supporting its utility in the early identification of high‐risk patients and providing a practical reference for clinicians to implement timely preventive interventions.
Consistent with previous studies, this study identified age, length of hospital stay, and D‐dimer levels as significant factors associated with the development of VTE in neurocritical care patients [17, 19]. A variety of factors, including comorbidities such as stroke, diabetes, and frailty, age‐associated endothelial dysfunction, PLT functional alterations, and fluctuations in plasma components, collectively contribute to the elevated susceptibility to VTE observed in older adults [20]. Virchow’s triad of factors predisposing to thrombosis‐altered blood flow or stasis, changes in the composition of blood (hypercoagulability), and vessel wall damage, has been the foundation of the pathophysiology of VTE [21]. However, inflammatory mediators and immune cells are increasingly recognized as central players in thrombosis. Similarly, our study demonstrated that pulmonary infection and antibiotic administration are significant contributors to the development of VTE. Infection promotes thrombosis through complex, interrelated mechanisms. It triggers immune activation with upregulation of pro‐inflammatory cytokines, activates the coagulation cascade, suppresses fibrinolysis, and induces a hypercoagulable state [22]. Monocytes and neutrophils adhere to and interact with the venous endothelium, providing initiating stimuli for DVT [22]. Infection also induces exuberant formation of neutrophil extracellular traps, whose DNA–histone scaffold functions as a prothrombotic matrix that recruits PLTs and erythrocytes and facilitates fibrin polymerization, thereby promoting venous thrombus formation [23, 24]. In the ICU setting, concomitant factors—immobility, dehydration, fever, venous catheterization, and surgical or airway procedures—operationalize Virchow’s triad and accelerate the onset and progression of VTE [25]. Baseline analysis revealed that NLR levels were elevated in the VTE group compared to the non‐VTE group, further supporting this association. The Controlling Nutritional Status (CONUT) score, a widely recognized tool for assessing the risk of malnutrition, has also been shown to correlate with the degree of disability and the progression of infection in patients with stroke [26]. In our study, the CONUT score was included because most participants presented with severe stroke, making it a relevant marker of both nutritional status and prognosis in this neurocritical population. Although this variable was not retained in the final predictive model, its inclusion reflects the comprehensive and specialized nature of our study in the field of neurocritical care.
The superior predictive performance of the model developed in this study compared to existing models may be attributed to several factors. First, the use of an RF algorithm enabled effective selection of variables based on their relative importance, ensuring that only predictors with substantial contributions to the model were retained, thereby enhancing overall predictive accuracy. Second, the model incorporated both clinical characteristics and objective biochemical indicators, which improved the comprehensiveness and precision of VTE risk assessment. The model identifies several modifiable risk factors (e.g., pulmonary infection control, tracheotomy duration) that can be directly addressed through nursing interventions. Furthermore, the inclusion of key predictors such as D‐dimer levels and length of hospital stay—both recognized as significant risk factors for VTE—further strengthened the model’s discriminative capability. Therefore, the nomogram developed in this study can be utilized by healthcare professionals for dynamic risk stratification in neurocritical patients, facilitating the early identification of high‐risk individuals and enabling timely and effective preventive interventions.
This study has several limitations. First, as a retrospective study, it is subject to potential selection bias and unmeasured confounding factors. The absence of PE cases underscores the limitations of the current screening strategy and the diagnostic challenges in critically ill neurological patients, which may have led to missed asymptomatic or atypical cases and should be considered when interpreting the results. Second, due to limitations in data availability, important variables such as personal and family history of thrombosis, the Padua prediction score for medical patients, and the Caprini risk assessment model for surgical patients were not included. Third, external validation of the model has not yet been performed, and its generalizability remains to be further assessed. Although a nomogram was developed in this study, the evaluation of its clinical applicability was limited. We were unable to provide detailed operational guidelines, risk‐based management strategies, or electronic tools within the scope of this retrospective analysis. Despite alignment with contemporary VTE guidelines, real‐world heterogeneity in implementation and incomplete documentation preclude standardized quantification, potentially introducing residual confounding and affecting external validity. Future prospective studies will be needed to establish practical guidance, develop user‐friendly applications, and explore potential barriers and facilitators for clinical implementation based on existing literature.
Future work will focus on multicenter external validation. Specifically, we have initiated collaborations with tertiary hospitals and plan to recruit patients with neurological critical illness from different regions of Suzhou over the next 3 years, aiming to further assess the model’s generalizability in larger and more heterogeneous populations.
5. Conclusion
In conclusion, the VTE risk prediction model for neurocritical patients developed in this study has good predictive performance and clinical value. It can effectively predict the individualized risk of VTE occurrence in neurocritical patients, providing a reference for early prevention and treatment measures. Future research based on multicenter external validation, model optimization with prospective data, and integration with electronic health record systems is warranted to refine and recalibrate the model, thereby enhancing its applicability in real‐world clinical settings.
Ethics Statement
The study protocol was approved by the Ethics Committee of the Second Affiliated Hospital of Soochow University (JD‐HG‐2025‐059) and performed in accordance with the ethical standards laid down in the 1964 Declaration of Helsinki and its later amendments. Written informed consent was obtained from all participants or their legal guardians.
Consent
The authors have nothing to report.
Disclosure
All authors approved the protocol.
Conflicts of Interest
The authors declare no conflicts of interest.
Author Contributions
Jijun Shi and Weidong Hu: study concept and design. Meili Zhou and Rui Wang: thesis writing and revision. Meili Zhou and Chentao Wang: acquisition of data. Longhai Zhu: statistical analysis and interpreted the data. Jijun Shi and Weidong Hu: study supervision. Meili Zhou, Rui Wang, and Longhai Zhu contributed equally to this work and should be considered co‐first authors. Jijun Shi and Weidong Hu contributed equally.
Funding
This work was supported by the Shaanxi Provincial Natural Science Basic Research Program (2025JC‐YBMS‐1020), Nuclear Medical Technology Innovation Key Project (ZHYLZD2025018), Suzhou Science and Technology Development Plan Project (SKY2023180), Clinical Research Center of Neurological Disease of the Second Affiliated Hospital of Soochow University (ND2023B06), Jiangsu Provincial Medical Key Discipline (ZDXK202217), and Project of China International Medical Foundation (2022‐N‐01‐26).
Supporting Information
Additional supporting information can be found online in the Supporting Information section.
Supporting information
Supporting Information Figure S1: Visualization of missing data patterns. Figure S2: Distribution of imputed versus original data. Table S1: Comparison of demographic and clinical characteristics of patients with VTE and without VTE in the training dataset and testing dataset of neurocritical patients. Table S2: VIF values for the included variables.
The reference list from the paper itself. Each links out to its DOI / PubMed record.
- 1Khan F. , Tritschler T. , Kahn S. R. , and Rodger M. A. , Venous Thromboembolism, The Lancet. (2021) 398, no. 10294, 64–77, 10.1016/S 0140-6736(20)32658-1.33984268 · doi ↗ · pubmed ↗
- 2Guo X. , Zhang F. , and Wu Y. , et al.Coagulation Alteration and Deep Vein Thrombosis in Brain Tumor Patients During the Perioperative Period, World Neurosurgery. (2018) 114, e 982–e 991, 10.1016/j.wneu.2018.03.128, 2-s 2.0-85045324314.29588239 · doi ↗ · pubmed ↗
- 3Shi S. , Cheng J. , Chen H. , Zhang Y. , Zhao Y. , and Wang B. , Preoperative and Intraoperative Predictors of Deep Venous Thrombosis in Adult Patients Undergoing Craniotomy for Brain Tumors: A Chinese Single-Center, Retrospective Study, Thrombosis Research. (2020) 196, 245–250, 10.1016/j.thromres.2020.09.005.32919179 · doi ↗ · pubmed ↗
- 4Indredavik B. , Rohweder G. , Naalsund E. , and Lydersen S. , Medical Complications in a Comprehensive Stroke Unit and an Early Supported Discharge Service, Stroke. (2008) 39, no. 2, 414–420, 10.1161/STROKEAHA.107.489294, 2-s 2.0-39349088303.18096834 · doi ↗ · pubmed ↗
- 5Gearhart M. M. , Luchette F. A. , and Proctor M. C. , et al.The Risk Assessment Profile Score Identifies Trauma Patients at Risk for Deep Vein Thrombosis, Surgery. (2000) 128, no. 4, 631–640, 10.1067/msy.2000.108224, 2-s 2.0-0033772010.11015097 · doi ↗ · pubmed ↗
- 6Zhang P. , Bian Y. , and Xu F. , et al.The Incidence and Characteristics of Venous Thromboembolism in Neurocritical Care Patients: A Prospective Observational Study, Clinical and Applied Thrombosis/Hemostasis. (2020) 26, 10.1177/1076029620907954, 1076029620907954.32090609 PMC 7288821 · doi ↗ · pubmed ↗
- 7Nyquist P. , Bautista C. , and Jichici D. , et al.Prophylaxis of Venous Thrombosis in Neurocritical Care Patients: An Evidence-Based Guideline: A Statement for Healthcare Professionals From the Neurocritical Care Society, Neurocritical Care. (2016) 24, no. 1, 47–60, 10.1007/s 12028-015-0221-y, 2-s 2.0-84957437926.26646118 · doi ↗ · pubmed ↗
- 8Galanaud J.-P. , Sevestre M.-A. , and Genty C. , et al.Comparison of the Clinical History of Symptomatic Isolated Muscular Calf Vein Thrombosis Versus Deep Calf Vein Thrombosis, Journal of Vascular Surgery. (2010) 52, no. 4, 932–938.e 2, 10.1016/j.jvs.2010.05.019, 2-s 2.0-77957601694.20630688 · doi ↗ · pubmed ↗