Histone modification-regulated LncRNA DLEU1 interacts with ASCC2/ALKBH3 complex to drive DNA repair, antioxidant homeostasis and glucose metabolism in gastric cancer
Xiaoyan Zhang, Xin Wang, Qi Wang, Xu Wang, Hui Sun, Yingxue Liu, Cong Tan, Shujuan Ni, Weiwei Weng, Meng Zhang, Lei Wang, Dan Huang, Jie Chen, Xiaoyu Wang, Lu Gan, Mierxiati Abudurexiti, Wenfeng Wang, Jinjia Chang, Weiqi Sheng, Midie Xu

TL;DR
The lncRNA DLEU1 helps gastric cancer cells repair DNA and manage energy by interacting with specific proteins, offering a new target for treatment.
Contribution
This study reveals a novel mechanism by which DLEU1 regulates DNA repair, antioxidant balance, and glucose metabolism in gastric cancer.
Findings
DLEU1 is upregulated in gastric cancer through H3K27 acetylation and H3K4 methylation.
DLEU1 promotes DNA repair by stabilizing E2F1 mRNA via ASCC2 and ALKBH3 interaction.
Targeting DLEU1 and ASCC2 with G6PD inhibition impairs gastric cancer cell viability and tumor growth.
Abstract
Long non-coding RNA (lncRNA) DLEU1 has been implicated in tumorigenesis, yet its mechanistic role in gastric cancer (GC) remains elusive. We investigated the epigenetic regulation and oncogenic function of DLEU1 in GC through chromatin immunoprecipitation, RNA-protein interaction assays, and functional analyses in organoids and xenograft models. The molecular mechanisms underlying DLEU1-mediated DNA repair and metabolic adaptation were elucidated using western blotting, quantitative RT-PCR, and luciferase reporter assays. DLEU1 was significantly upregulated in GC, driven by H3K27 acetylation and H3K4 methylation. Mechanistically, DLEU1 promoted DNA repair by facilitating ASCC2 nuclear translocation and its interaction with ALKBH3, thereby stabilizing E2F1 mRNA. In turn, E2F1 directly activated G6PD transcription, leading to enhanced NADPH production, redox homeostasis, and glucose…
Genes, proteins, chemicals, diseases, species, mutations and cell lines named across the full text — each resolved to its canonical identifier and authoritative record.
Click any figure to enlarge with its caption.
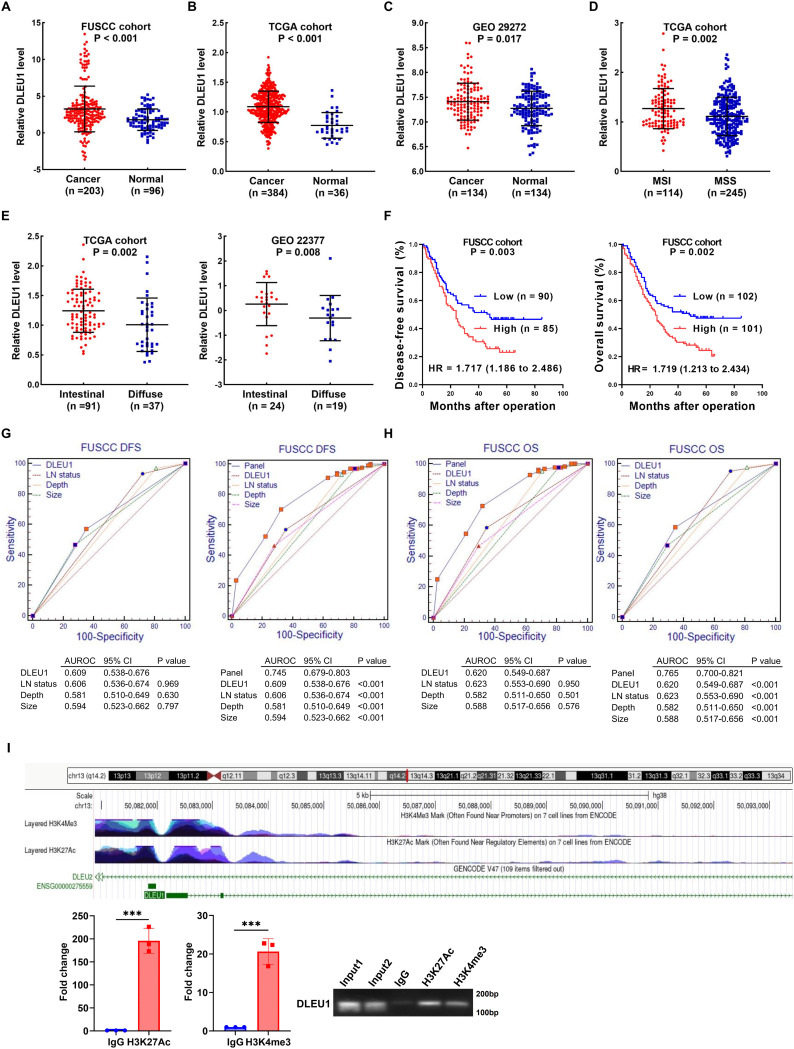 Figure 1
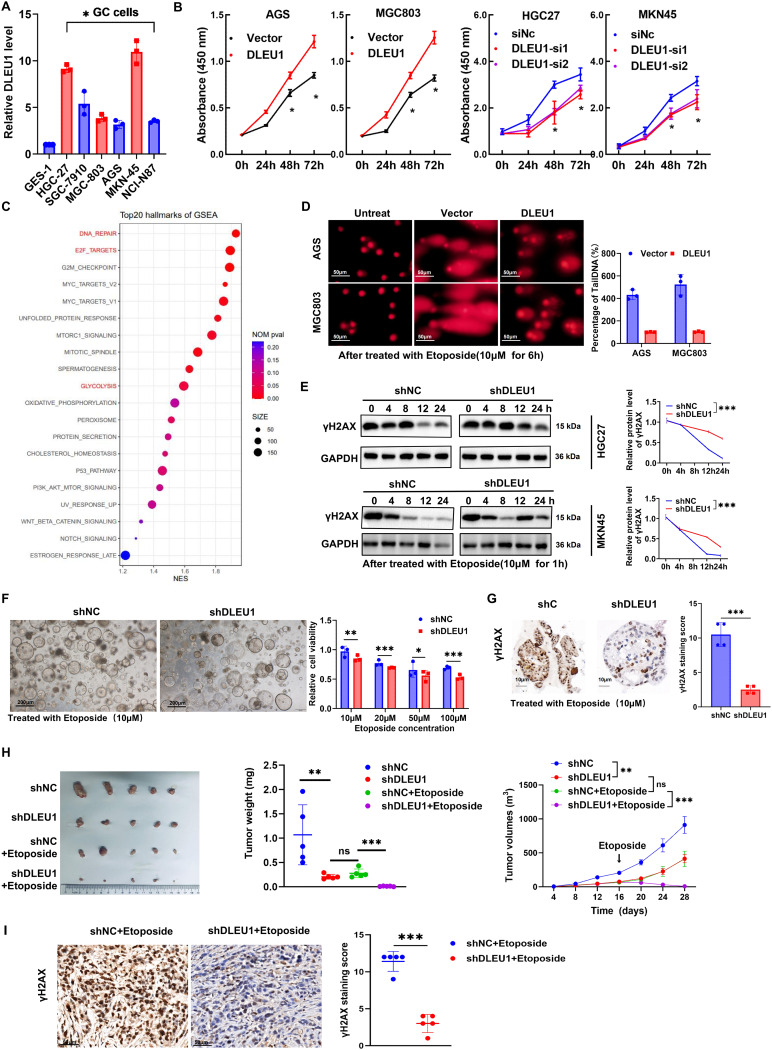 Figure 2
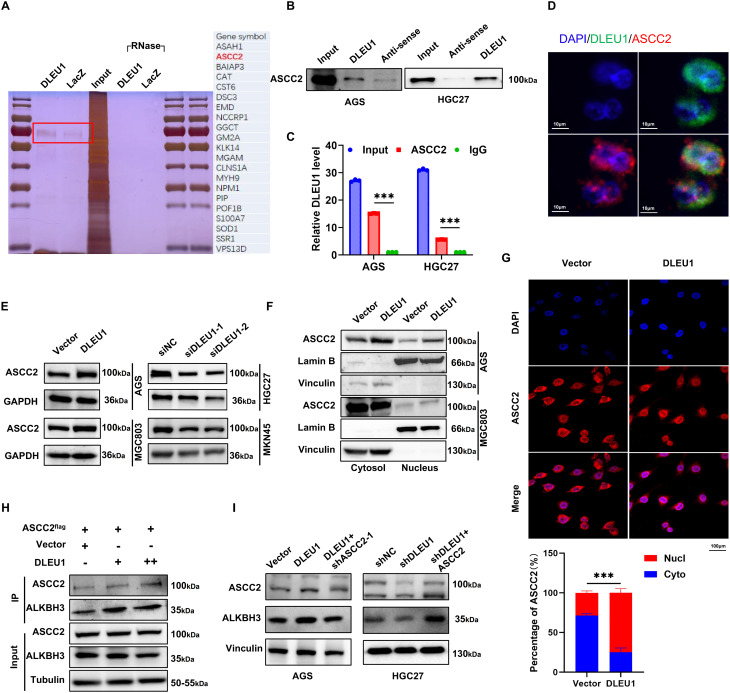 Figure 3
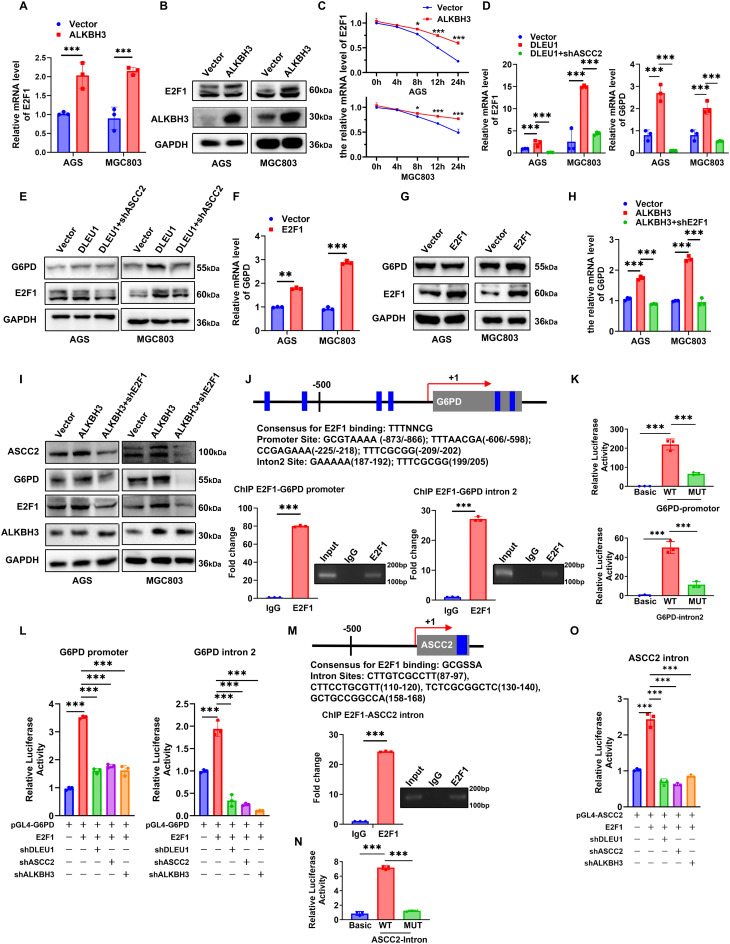 Figure 4
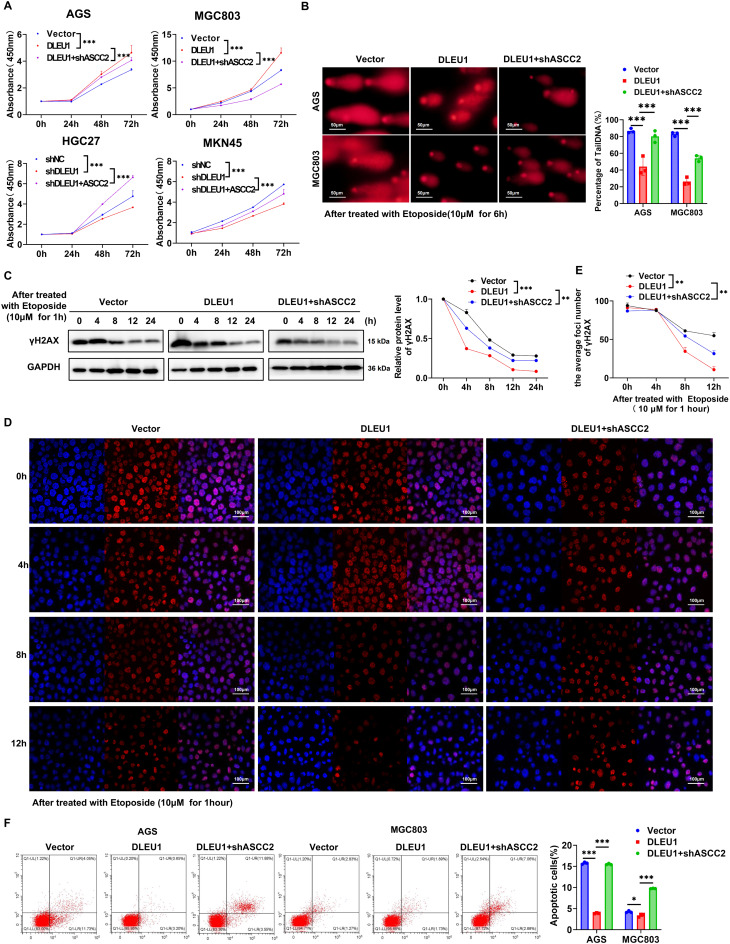 Figure 5
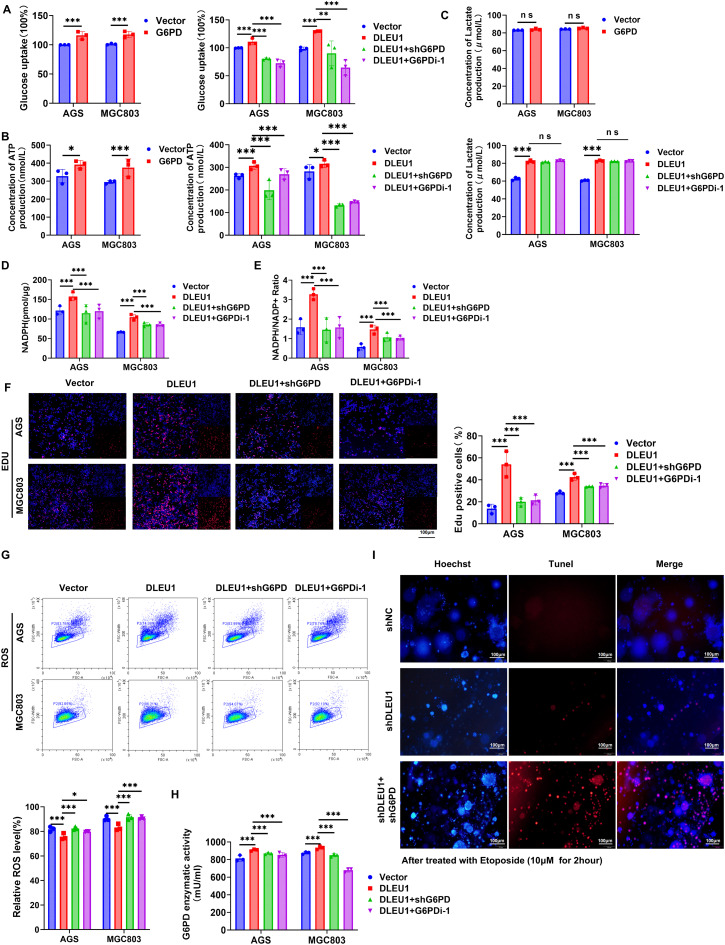 Figure 6
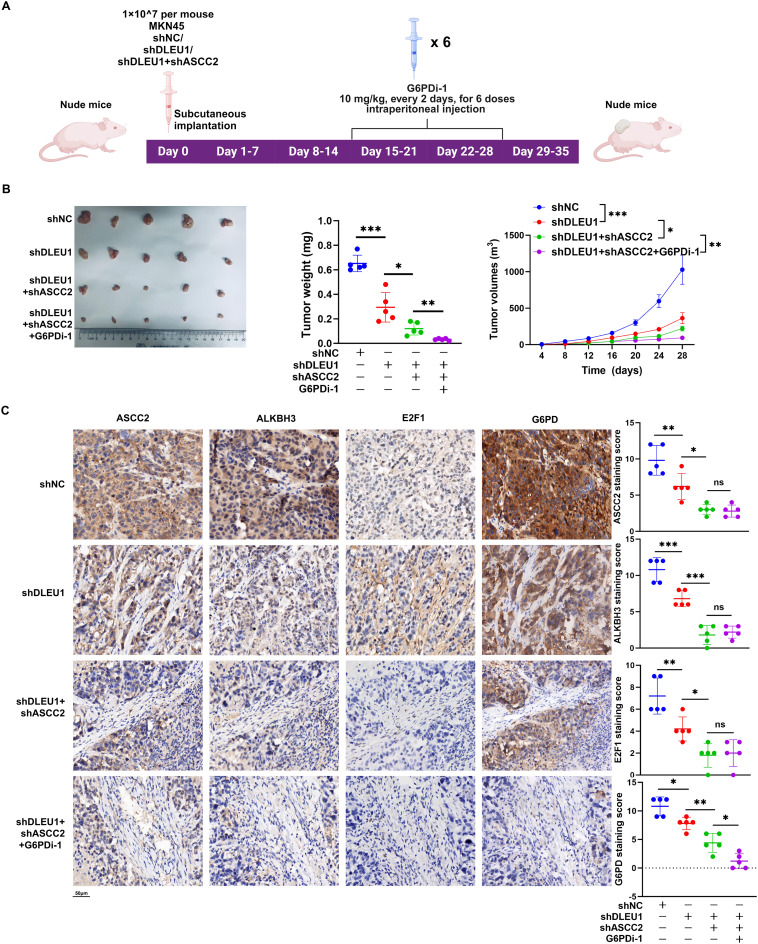 Figure 7
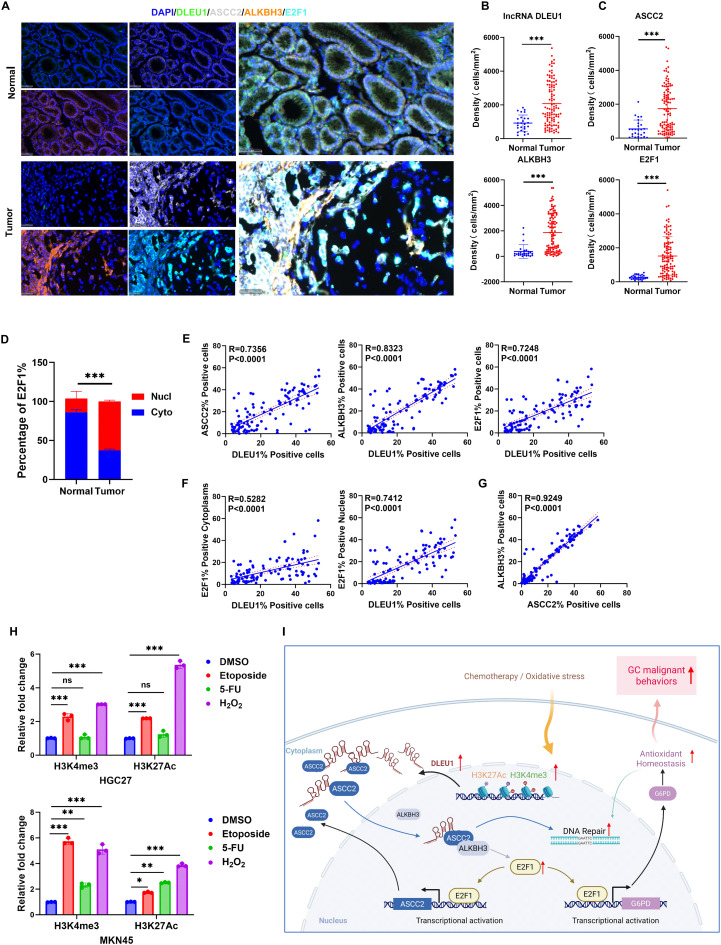 Figure 8
- —National Natural Science Foundation of China
- —Natural Science Foundation of Shanghai
- —Shanghai Science and technology development fund
- —Shanghai Municipal Key Clinical Specialty
- —Shanghai Science and Technology Innovation Action Plan Basic research project subproject
- —Shanghai Municipal Health Commission Youth Projects
Peer Reviews
No public reviews on file for this paper yet. If you reviewed it on a platform where reviews are public (OpenReview, ICLR, NeurIPS, ICML), you can paste yours below so the community can read it here.
Videos
No videos yet. Explain this paper in a talk, walkthrough, or lecture? Add one.
Taxonomy
TopicsCancer-related molecular mechanisms research · RNA modifications and cancer · Cancer, Hypoxia, and Metabolism
Introduction
Gastric cancer (GC) is a significant global health challenge, ranking fifth in incidence and fourth in mortality among cancers [1]. Current treatment strategies, including surgery, systemic chemotherapy, HER2-targeted therapy, immunotherapy, and radiotherapy, have enhanced patient outcomes and survival [2]. However, many patients are diagnosed at advanced stages with metastasis, significantly limiting therapeutic options and highlighting the need for deeper insights into the molecular mechanisms driving GC progression [3].
Long non-coding RNAs (lncRNAs) are transcripts longer than 200 nucleotides that do not encode proteins but exert crucial regulatory functions in diverse biological processes [4]. Unlike traditional protein-coding RNAs, lncRNAs modulate gene expression and cellular pathways through multiple mechanisms, including transcriptional regulation [5], RNA degradation [6], chromatin modification [7], nuclear-cytoplasmic transport [8]. Several oncogenic lncRNAs have been implicated in GC progression. For example, we previously reported that nuclear-enriched abundant transcript 1 (NEAT1) facilitates colorectal cancer progression by stabilizing the DEAD-box helicase 5 (DDX5) and activating Wnt/β-catenin signaling pathway [9]. Similarly, plasmacytoma variant translocation 1 (PVT1) promotes GC development by stabilizing forkhead box M1 (FOXM1), forming a positive feedback loop that further amplifies its own expression [10]. Given the pivotal role of lncRNA-protein interactions in tumorigenesis, a systematic investigation into their functional relevance in GC is warranted.
LncRNA Deleted in Lymphatic Leukemia 1 (DLEU1) has emerged as a key regulator in cancer progression. Previous studies suggest that DLEU1 recruits epigenetic regulators, such as lysine-specific demethylase 1 (LSD1) [11], SET and MYND domain containing 2 (SMYD2) [12], enhancing its functional repertoire in GC. In this study, we demonstrate that DLEU1 drives GC tumorigenesis by promoting DNA repair, metabolic adaptation, and cell proliferation. Mechanistically, DLEU1 facilitates the nuclear translocation of activating signal cointegrator 1 complex subunit 2 (ASCC2), which subsequently interacts with the AlkB homolog 3 (ALKBH3). This interaction not only boosts DNA damage repair [13] but also stabilizes E2F transcription factor 1 (E2F1) mRNA. In turn, E2F1 activates the glucose-6-phosphate dehydrogenease (G6PD) transcription, driving NADPH production and metabolic reprogramming to support tumor growth and metastasis. Functionally, silencing DLEU1 in combination with ASCC2 depletion and G6PD inhibition significantly impairs GC progression in vivo, underscoring the therapeutic potential of targeting the DLEU1/ASCC2/G6PD axis.
Materials and methods
Tissue collection and ethics statement
For the RT-qPCR detection of gene expression, we collected 203 cancer cases and 96 corresponding normal gastric tissue samples stored in liquid nitrogen from the Biobank of Fudan University Shanghai Cancer Center (FUSCC). A series of tissue microarrays (TMA) from the Biobank, which included 130 GC cases, were utilized for the fluorescent multiplex immunohistochemistry. None of the patients received specific treatment prior to surgery. All tissues included in the study were confirmed to be GC through histopathological evaluation. This study was approved by the Ethics Committee of FUSCC, and informed consent was obtained from each patient. The study was approved by the Research Ethics Committee, and all patients provided informed consent (Ethical code: 2407-ZZK-124).
Fluorescent multiplex immunohistochemistry (mIHC), tissue imaging, and analysis
RNA in situ hybridization of DLEU1 mRNA was performed using the multiplex fluorescence RNA in situ hybridization kit (Alpha X Bio, China, #AXC25024031). Cells were fixed with 10% NBF and incubated with preA solution at room temperature to inhibit endogenous peroxidase activity. After proteinase treatment, the samples were hybridized with probes at 40 °C for 2 h, followed by signal amplification. Finally, the target RNA was labeled with green fluorescence using tyramide signal amplification (TSA) and a tyramide substrate.
Formalin-fixed paraffin-embedded (FFPE) tissue Sects. (2–5 μm) were deparaffinized with xylene, rehydrated through a gradient of ethanol, and subjected to heat-induced epitope retrieval (HIER) using EDTA buffer. For mIHC, the AlphaXPainter X3 system was used with three panels. The primary antibodies were incubated at 37 °C for 1 h, followed by incubation with Alpha X poly HRP Ms + Rb conjugates for 10 min. Visualization was performed using the Alpha X 7-color IHC kit (Alpha X Bio, China, #AXT37100031). The slides were scanned using the ZEISS AXIOSCAN 7(Carl Zeiss AG, Germany).
The images from the two groups were separately overlaid and analyzed using HALO software (Indica Labs, USA). The staining sequence and dye combination are as follows: DLEU1 probe (NR_109973.1, 5-1627, working solution, Alpha X Bio, China) - TSA520; E2F1 (1/200 dilution, Proteintech, Cat. #66515-1-Ig, RRID: AB_2881878) - TSA480; ALKBH3 (1/200 dilution, Proteintech, Cat. #12292-1-AP, RRID: AB_11125161) - TSA620; and ASCC2 (1/200 dilution, Proteintech, Cat.#11529-1-AP, RRID: AB_2059358) - TSA780.
Cell lines and culture conditions
We purchased six GC cell lines (HGC27, AGS, MKN45, MGC803, NCI-N87, and SGC7901) and a healthy cell line (GES-1) from the Institute of Biochemistry and Cell Biology, Chinese Academy of Sciences (Shanghai, China). The cells were cultured in RPMI 1640 medium containing 10% fetal bovine serum, 100 U/ml penicillin, and 100 mg/ml streptomycin, under humidified conditions at 37 °C with 5% CO_2_.
Organoid isolation and culture
Organoids were constructed in the Living Biobanks of FUSCC, which was developed in response to the pivotal applications of organoids in disease modeling and pharmaceutical field [14]. Fresh GC and normal tissues were collected, minced (1–3 mm³), and washed in PBS. After enzymatic digestion (trypsin, collagenase IV, DNase I) at 37 °C for 30–60 min, cell aggregates were filtered (70 μm), mixed with Matrigel (1:1, Corning, USA, #356234), and seeded in 24-well plates. After polymerization (37 °C, 15 min), organoid culture medium was added, and cultures were maintained at 37 °C, 5% CO₂. Organoids were harvested after 7–14 days for passaging and characterized by GC markers (CEA, 1/200 dilution, Proteintech, Cat. #68377-1-Ig, RRID: AB_3085095; CK7, 1/200 dilution, Beijing Zhongshan Golden Bridge Biotechnology, Cat. #ZM-0071, RRID: none). For viral transfection, organoids were incubated with viral suspension (4 °C, 1 h), infected (6–8 h), and resuspended in Matrigel for further culture. For drug assays, organoids in 96-well plates were treated with Etoposide (MCE, China, #HY-13629), and viability was assessed using CellTiter-Glo 3D (Promega, USA, #G9681) to evaluate proliferation inhibition and apoptosis induction.
Chromatin isolation by RNA purification (ChIRP)
ChIRP experiments were performed using the EZ-Magna ChIRP Kit (Millipore, Germany, #17-10495). Cells were subjected to formaldehyde crosslinking to stabilize RNA-protein-DNA complexes prior to lysis. The resultant lysate underwent hybridization with biotinylated probes tailored to target specific RNA sequences. To isolate the complexes, streptavidin-coated magnetic beads were employed, followed by rigorous washing to eliminate non-specific interactions. The captured complexes were subsequently eluted and analyzed through mass spectrometry after gel electrophoresis.
mRNA stability assay
The mRNA stability assay was performed using the transcription inhibitor Actinomycin D (5 µg/mL, MCE, China, #HY-17559) to assess the effect of ALKBH3 on E2F1 mRNA stability. Cells were transfected with Vector or ALKBH3, followed by Actinomycin D treatment. RNA was extracted at different time points, and E2F1 mRNA levels were quantified using RT-qPCR.
Cell Immunofluorescence
Initially, cells are cultured on coverslips and fixed using 4% paraformaldehyde at room temperature for 15 min. Following fixation, permeabilization is achieved with 0.1% Triton X-100 for 10 min, and non-specific binding is minimized through a one-hour incubation with 5% bovine serum albumin (BSA). The primary antibodies, ASCC2 (1:200, Proteintech, Cat. #11529-1-AP, RRID: AB_2059358) and γH2AX (1:200, Huaan Biosciences, Cat.#ET1602-2, RRID: AB_3069632), are then applied and incubated overnight at 4 °C. After washing the cells, fluorophore-conjugated secondary antibodies are introduced at room temperature for one hour, with nuclei stained using DAPI for 5 min. Finally, samples are mounted with anti-fade medium and examined under a fluorescence microscope, allowing for the capture of images essential for analyzing protein localization and expression.
Luciferase reporter assay
Luciferase reporter assay were performed using the Dual-Luciferase^®^ Reporter Assay System (Promega, USA, #E1910) according to the manufacturer’s instructions. Cells were co-transfected with firefly luciferase reporter plasmid and a Renilla luciferase plasmid. After 24–48 h, luciferase activity was measured using a microplate luminometer. Firefly luciferase activity was normalized to Renilla luciferase activity to control for transfection efficiency.
NADPH levels and NADPH/NADP⁺ ratio measurement
NADPH levels and the NADPH/NADP⁺ ratio were measured using the NADP/NADPH Quantification Kit (Beyotime, Cat. #S0180S) following the manufacturer’s protocol. Briefly, cells were lysed with NADP/NADPH extraction buffer, and the supernatants were collected after centrifugation at 12,000 × g for 10 min. NADP⁺ and NADPH were quantified by enzymatic cycling reactions, and the absorbance was measured at 450 nm using a microplate reader.
ROS level detection
Reactive oxygen species (ROS) levels were detected using the DCFH-DA probe (Beyotime, Cat. #S0033S). Cells were incubated with 10 µM DCFH-DA at 37 °C for 20 min in the dark. After washing with PBS, intracellular ROS levels were measured using flow cytometry.
EdU incorporation assay
DNA synthesis was evaluated using the EdU (5-ethynyl-2’-deoxyuridine) incorporation assay with the EdU Assay Kit (Beyotime, Cat. #C0075S). Cells were incubated with 10 µM EdU for 2 h, fixed with 4% paraformaldehyde, and permeabilized with 0.5% Triton X-100. EdU staining was performed using Alexa Fluor 555-conjugated azide according to the kit instructions, followed by nuclear staining with Hoechst. Finally, the cells were observed under an inverted fluorescence microscope.
G6PD enzymatic activity assay
Glucose-6-phosphate dehydrogenase activity was measured using the G6PD Activity Assay Kit (Beyotime, Cat. #S0189). Cell lysates were prepared according to the manufacturer’s protocol, and enzymatic activity was assessed by monitoring the reduction of NADP⁺ to NADPH at 450 nm over time using a microplate reader.
In vivo experiments
Male nude mice (5 weeks old) were maintained in pathogen-free conditions. Animals were assigned to experimental groups using simple randomization. We injected 1 × 10^7 cells/ml of cancer cell lines (MKN45) and their stable transfectants with relevant genes subcutaneously into the flanks of the mice. Starting from day 7, the length (L) and width (W) of the tumors were recorded. Tumor volume was calculated using the formula: V = (L×W²)/2. For treatment, it started two weeks post-tumor formation. Etoposide (MCE, China, #HY-13629 was administered at a dose of 10 mg/kg per mouse, every three days for a total of five doses. G6PDi-1 (MCE, #HY-W107464) was administered at 10 mg/kg per mouse, every two days for a total of six doses. After two weeks, all mice were euthanized, and the tumors were surgically removed and measured. All animal procedures were approved by the Ethics Committee of the Experimental Animal Center at our hospital, with the ethical approval code: FUSCC-IACUC-S2022-0358.
Other methods used in this study were described in previous publications and are listed in the Supplementary Information [10, 15, 16].
Statistical analysis
Statistical analyses and data visualization were conducted using GraphPad Prism 10.1.2 and R Studio 4.2.3. For comparisons between two groups, the Shapiro-Wilk test was first performed to assess normality and homogeneity of variance. If these assumptions were met, a Student’s t-test was used; otherwise, the Mann-Whitney U test was applied. For multiple-group comparisons, one-way ANOVA was performed if normality and homogeneity of variance were satisfied; otherwise, the Kruskal-Wallis test was used. For continuous variables, Pearson correlation analysis was conducted if the data followed a normal distribution and exhibited a linear correlation; otherwise, Spearman correlation analysis was applied. All data are presented as mean ± SEM, with experiments performed in triplicate. Statistical significance was defined as *P<0.05, **P<0.01, ***P<0.001, while “ns” indicates no statistically significant difference.
Results
Histone modification-activated LncRNA DLEU1 is upregulated in human GC tissues and correlates with poor clinical prognosis
We investigated the expression and clinical significance of DLEU1 in GC by analyzing its mRNA levels in tumor and adjacent non-cancerous tissues from patients in the FUSCC cohort. Our results revealed a significant upregulation of DLEU1 in GC samples compared to normal counterparts (P < 0.001; Fig. 1A). This observation was further supported by independent analyses of The Cancer Genome Atlas (TCGA) and the GEO29272 datasets (Fig. 1B-C). Notably, DLEU1 expression was markedly higher in patients with high microsatellite instability (MSI-H) [17, 18] compared to those with microsatellite stability (MSS) in the TCGA cohort (P = 0.002; Fig. 1D). Moreover, patients with intestinal-type GC exhibited markedly elevated DLEU1 levels compared to those with diffuse-type subtype [19], a finding consistently observed in both the TCGA (P = 0.002) and GEO22377 cohorts (P = 0.008, Fig. 1E).
Clinically, elevated DLEU1 expression was significantly associated with increased tumor infiltration depth (Table 1, P = 0.040). Additionally, patients with higher DLEU1 levels exhibited significantly poorer disease-free survival (DFS; P = 0.003) and overall survival (OS; P = 0.002) compared to those with lower expression (Fig. 1F). Univariate and multivariate Cox proportional hazards analyses (Tables 2 and 3) identified DLEU1, along with tumor size, infiltration depth, and lymphatic metastasis (LM), as independent prognostic factors for DFS (Fig. 1G) and OS (Fig. 1H). Although receiver operating characteristic (ROC) curves indicated that DLEU1 alone did not outperform other prognostic factors in predicting DFS and OS, its combination with LM, tumor depth, and size provided enhanced prognostic accuracy (Fig. 1G-H). Collectively, these findings underscore DLEU1 as a valuable prognostic biomarker in GC.
Table 1. Relationship between DLEU1 expression and clinicopathologic parameters of gastric cancer patientsCharacteristicsNumber of caseDLEU1 expressionP valueLow (n = 102)%High (n = 101)%Age (years)20360.04 ± 10.7360.92 ± 9.750.159Gender0.626Male1547977.57574.3Female492322.52625.7Tumor size0.569< 5 cm1216361.85857.4≥ 5 cm823938.24342.6Location0.424Upper stomach482019.62827.7Middle stomach673837.32928.7Lower stomach683534.33332.7Entire stomach2098.81110.9Histologic grade0.422Well/moderately512322.52827.7Poorly/others1527977.57372.3Depth of invasion0.040*T1,T2171312.744T3,T41868987.39796Lymphatic metastasis0.839Absent281514.71312.9Present1758785.38887.1Vascular invasion0.15Absent794544.13433.7Present1245755.96766.3Nervous invasion0.467Absent744039.23433.7Present1296260.86766.3Distant metastasis0.423Absent1759088.2138584.2Present281211.81615.8TNM stage0.294I and II412423.51716.8III and IV1627876.58483.2
Table 2. Univariate and multivariate analysis of clinicopathological factors for disease-free survival in gastric cancerVariableUnivariate analysisMultivariate analysisHR (95% CI)p^a^HR (95% CI)p^a^Age1.138 (0.809–1.603)0.458(< 60/≥60)Gender1.248 (0.852–1.828)0.256(Male/Female)Location1.147 (0.955–1.378)0.143(Upper/middle/lower/Entire)Tumor size1.579 (1.125–2.216)0.0081.746 (1.239–2.460)0.001(≥ 5/<5)Histologic grade1.554 (1.030–2.346)0.036*(Well, mod/Poor, others)Depth of tumor4.489 (1.658–12.158)0.0032.891 (1.057–7.907)0.039(T3, T4/T1, T2)Vascular invasion1.750 (1.214–2.523)0.003*(Present/Absent)Nervous invasion1.861 (1.280–2.704)0.001*(Present/Absent)Lymphatic metastasis3.376 (1.713–6.654)0.0003.248 (1.629–6.473)0.001(Present/Absent)Distant metastasis1.727 (1.102–2.708)0.017*(Present/Absent)TNM stage3.215 (1.844–5.607)0.000*(III + IV/I + II) DLEU1 1.635 (1.160–2.302)0.0051.571 (1.113–2.218)0.010(High /Low)HR Hazard ratio, CI confidence interval, ^a^ All statistical tests were 2-sided. Significance level: P < 0.05
Table 3. Univariate and multivariate analysis of clinicopathological factors for overall survival in gastric cancerVariableUnivariate analysisMultivariate analysisHR (95% CI) p ^a^ HR (95% CI) p ^a^ Age(< 60/≥60)1.242 (0.873–1.766)0.229Gender(Male/Female)1.279 (0.867–1.887)0.215Location(Upper/middle/lower/Entire)1.165 (0.966–1.405)0.109Tumor size(≥ 5/<5)1.569 (1.108–2.222)0.0111.786 (1.255–2.541)0.001Histologic grade(Well, mod/Poor, others)1.651 (1.073–2.542)0.023Depth of tumor(T3,T4/T1,T2)4.436 (1.728–17.104)0.0043.256 (1.026–10.331)0.045Vascular invasion(Present/Absent)1.767 (1.212–2.578)0.003Nervous invasion(Present/Absent)1.975 (1.336–2.918)0.001Lymphatic metastasis(Present/Absent)4.735 (2.083–10.761)0.0004.532 (1.974–10.402)0.000Distant metastasis(Present/Absent)1.646 (1.039–2.607)0.034TNM stage(III + IV/I + II)3.912 (2.103–7.277)0.000* DLEU1 (High /Low)1.728 (1.214–2.459)0.0021.679 (1.177–2.397)0.004HR Hazard ratio, CI confidence interval, ^a^ All statistical tests were 2-sided. Significance level: P < 0.05
To investigate the mechanisms underlying the aberrant upregulation of DLEU1 in GC, we examined its promoter landscape using the UCSC Genome Browser (http://genome.ucsc.edu/) [20]. This analysis revealed significant enrichment of H3K27Ac and H3K4me3, histone marks associated with active transcription, at the DLEU1 promoter. ChIP assays further demonstrated an increased deposition of H3K27Ac and H3K4me3 at this locus in HGC27 GC cells (Fig. 1I). Collectively, these findings support the notion that histone modifications contribute to the transcriptional activation of DLEU1 in GC, providing mechanistic insight into its dysregulated expression.
DLEU1 attenuates DNA damage accumulation and promotes glycolysis in GC cells
To elucidate the functional role of DLEU1 in GC, we analyzed its endogenous expression across a panel of GC cells. RT-qPCR analysis revealed markedly elevated DLEU1 expression in GC cells compared with normal human gastric epithelial cells GES-1 (Fig. 2A). To further assess its functional implications, we modulated its expression by overexpressing DLEU1 in MGC803 and AGS cells while silencing it in HGC27 and MKN45 cells (Supplementary Fig. 1A). Overexpression of DLEU1 significantly enhanced proliferation and colony-forming ability, whereas its knockdown significantly impaired both (Fig. 2B, Supplementary Fig. 1B). Additionally, DLEU1 overexpression promoted cell migration and invasion, while its depletion suppressed these metastatic properties (Supplementary Fig. 1C-D).
Given the observed correlation between DLEU1 overexpression and MSI-H status in GC (Fig. 1D), we hypothesized that DLEU1 may regulate DNA damage repair. RNA sequencing and gene enrichment analyses identified a significant upregulation of DNA repair-related genes in DLEU1-overexpressing AGS cells (Fig. 2C). Subsequent comet assay analyses confirmed that DLEU1 overexpression reduced DNA damage, as indicated by diminished comet tail parameters, whereas DLEU1 knockdown led to increased DNA fragmentation (Fig. 2D, Supplementary Fig. 1F). Furthermore, following DNA damage induction, DLEU1-overexpressing cells exhibited accelerated γ-H2AX clearance (a biomarker of DNA damage [21]), suggesting enhanced DNA repair efficiency, while DLEU1 depletion prolonged γ-H2AX persistence (Fig. 2E, Supplementary Fig. 1G). Consistent with these findings, apoptosis assays also indicated that DLEU1 overexpression reduced apoptotic responses, whereas its knockdown heightened apoptosis (Supplementary Fig. 1H). To determine whether DLEU1 regulates the expression of key mismatch repair (MMR) genes, we performed RT–qPCR analyses in AGS and MGC803 gastric cancer cell lines following DLEU1 overexpression. The results revealed a marked upregulation of MLH1, MSH6, and PMS2 mRNA levels, whereas MSH2 expression remained largely unchanged (Supplementary Fig. 1I). These findings suggest that DLEU1 may enhance DNA mismatch repair activity, thereby promoting DNA repair capacity and supporting the survival of gastric cancer cells.
Beyond its role in genome stability, DLEU1 also modulates cellular metabolism. Gene set enrichment analysis (GSEA) revealed a significant enrichment of glycolysis and oxidative phosphorylation pathways in DLEU1-overexpressing cells (Fig. 2C). Functional assays demonstrated that DLEU1 overexpression enhanced glucose uptake, lactate production, and ATP generation, while knockdown of DLEU1 inhibited these metabolic processes (Supplementary Fig. 2A). Furthermore, extracellular acidification rate (ECAR) and oxygen consumption rate (OCR) assays confirmed that DLEU1 overexpression augmented both glycolytic flux activity and mitochondrial respiration (Supplementary Fig. 2B). Mechanistically, DLEU1 overexpression upregulated key glycolytic regulators, including GLUT1, GLUT4, HK2, and LDHA (Supplementary Fig. 2C), suggesting a pivotal role for DLEU1 in metabolic reprogramming in GC.
Given the strong association between DLEU1 overexpression and MSI-H status in GC, as well as RNA sequencing data indicating enrichment of DNA damage repair pathways (Figs. 1D and 2C), we investigated whether DLEU1 modulated chemotherapy response. Using GC organoid models [22], 3D viability assays showed that DLEU1 knockdown significantly reduced organoid viability following Etoposide treatment, suggesting heightened chemosensitivity. Consistently, γH2AX IHC staining revealed a diminished DNA damage response in shDLEU1 organoids (Fig. 2F-G, Supplementary Fig. 2D). Similarly, in a mouse xenograft model, DLEU1 knockdown synergistically enhanced Etoposide-induced tumor suppression, leading to a significantly greater reduction in tumor volume and weight compared to the shNC group (Figs. 2H). Furthermore, γH2AX staining demonstrated that tumors from the DLEU1-knockdown combined Etoposide treatment group exhibited lower expression of DNA damage repair markers, further supporting a role for DLEU1 in DNA damage resolution (Fig. 2I).
Taken together, these findings demonstrate that DLEU1 is highly expressed in GC cells and drives malignant phenotypes by promoting cell proliferation, migration, and metabolic metabolism, while also enhancing DNA damage repair and conferring chemoresistance may thus represent a promising therapeutic strategy for overcoming DNA repair–mediated drug resistance in GC.
DLEU1 promotes the nuclear localization of ASCC2 and facilitates ASCC2–ALKBH3 interaction
lncRNAs regulate gene expression through interactions with proteins in various cellular contexts [23]. To investigate protein interactions with DLEU1 in a chromatin-associated environment while minimizing nonspecific binding, we performed chromatin isolation by RNA purification (ChIRP) using DLEU1-specific RNA probes. The purified complexes were analyzed via SDS-PAGE and visualized by silver staining, followed by mass spectrometry analysis (Fig. 3A, left). Liquid chromatography-mass spectrometry (LC/MS) analysis identified ASCC2 as a prominent DLEU1-associated protein (Fig. 3A, right). This interaction was further validated using biotin-RNA-protein pull-down assays coupled with Western blotting (Fig. 3B). Additionally, RIP assays validated that ASCC2 antibodies significantly enriched DLEU1 in AGS and HGC27 cells (Fig. 3C). Immunofluorescence staining results revealed that DLEU1 co-localized with ASCC2 within the cells (Fig. 3D). Collectively, these results indicate that DLEU1 directly interacts with ASCC2.
To determine whether DLEU1 regulates ASCC2 expression, we assessed its impact on ASCC2 RNA and protein levels. RT-qPCR analysis showed that neither DLEU1 overexpression nor knockdown significantly affected ASCC2 mRNA levels (Supplementary Fig. 3A). However, overexpression of DLEU1 slightly increased ASCC2 protein levels, while silencing of DLEU1 slightly reduced ASCC2 protein levels (Fig. 3E). Given that DLEU1 did not alter ASCC2 mRNA expression, we examined whether it influenced ASCC2 protein stability using cycloheximide (CHX) chase assays. No significant changes in ASCC2 protein degradation were observed (Supplementary Fig. 3B). Next, we investigated the effect of DLEU1 on ASCC2 intracellular localization. Nuclear-cytoplasmic fractionation revealed that DLEU1 upregulation significantly increased the nuclear localization of ASCC2 compared to the control group (Fig. 3F). Immunofluorescence assays further confirmed that ASCC2 predominantly accumulated in the nucleus upon DLEU1 overexpression (Fig. 3G).
ASCC2 is a ubiquitin-binding protein involved in DNA repair [24, 25] and ribosome quality control [26, 27]. It has been reported to recruit ALKBH3 to DNA damage sites by binding to polyubiquitinated proteins with “Lys-63” linkages [24]. To examine whether DLEU1 modulated ASCC2–ALKBH3 interaction, we performed endogenous co-immunoprecipitation assays. Notably, overexpression of DLEU1 enhanced ASCC2–ALKBH3 binding (Fig. 3H). Moreover, overexpression of DLEU1 increased ALKBH3 protein levels, while silencing of ASCC2 partially abrogated this effect (Fig. 3I). Our data suggest that DLEU1 exerts its function by binding to ASCC2, promoting its nuclear translocation, and facilitating its interaction with ALKBH3.
ALKBH3 stabilize E2F1 mRNA, facilitating its transcriptional activation of G6PD
ALKBH3 is the sole eraser of N1-methyladenosine (m¹A) in mRNA [28, 29]. Previous studies have reported that ALKBH3 enhances the stability of E2F1 mRNA in an m1A demethylase activity dependent manner, thereby promoting E2F1-mediated transcriptional activation of key glycolytic enzymes [30]. Coincidentally, differentially upregulated genes in AGS cells overexpressing DLEU1 were significantly enriched in E2F1 targets genes (Fig. 2C). Consistently, both E2F1 mRNA and protein levels were upregulated in AGS and MGC803 cells overexpressing ALKBH3 (Fig. 4A-B). Additionally, we also confirmed that ALKBH3 enhanced the stability of E2F1 mRNA (Fig. 4C). Transcriptomic analysis further revealed that among glycolytic enzymes, G6PD, a rate-limiting enzyme in the pentose phosphate pathway (PPP) [31], was the most significantly upregulated in DLEU1-overexpressing GC cells (Supplementary Table 1). GSEA also revealed significant enrichment of the glycolysis pathway, suggesting a coordinated upregulation of glucose metabolism. To delineate the mechanistic axis involving DLEU1, ASCC2, E2F1, and G6PD, we found that overexpression of DLEU1 increased both E2F1 and G6PD at mRNA and protein levels, while silencing of ASCC2 partly attenuated this effect (Fig. 4D-E).
Functionally, overexpression of E2F1 increased both G6PD mRNA (Fig. 4F) and protein levels (Fig. 4G) while E2F1 knockdown abrogated ALKBH3-induced upregulation of G6PD (Fig. 4H-I). Furthermore, ChIP analysis confirmed direct E2F1 binding at two sites within the G6PD promoter and intron 2 regions (Fig. 4J), with luciferase reporter assays demonstrating that mutating these sites significantly reduced transcriptional activity (Fig. 4K). Additionally, knockdown of DLEU1, ASCC2 or ALKBH3 impaired E2F1-mediated transcriptional activation of G6PD (Fig. 4L). Interestingly, ChIP-seq analysis of E2F1 revealed strong enrichment at an intronic region of the ASCC2 (Supplementary Table 2). This finding was further validated by ChIP-qPCR experiments (Fig. 4M). Consistent with this, luciferase assays confirmed that mutations in binding sites significantly diminished luciferase activity (Fig. 4N). In addition, ASCC2 expression was also regulated by the ALKBH3/E2F1 axis (Fig. 4I and O), suggesting that E2F1 may regulate ASCC2 expression via intronic binding.
DLEU1 promotes DNA damage repair in GC via an ASCC2-dependent way
To elucidate the role of DLEU1 in GC, we investigated its functional dependence on ASCC2. The CCK-8 proliferation assay revealed that knockdown of ASCC2 impaired the pro-proliferative effect of DLEU1 overexpression in MGC803 and AGS cells (Fig. 5A). Given the established role of ASCC2 in DNA damage response, we further explored whether DLEU1 exerts its effects on DNA damage repair through ASCC2. Comet assay demonstrated that DLEU1 overexpression reduced comet tail formation, indicative of enhanced DNA repair, whereas ASCC2 depletion partially restored DNA damage levels (Fig. 5B). Moreover, γ-H2AX was significantly upregulated upon DLEU1 overexpression, while ASCC2 knockdown mitigated this effect (Fig. 5C). Immunofluorescence staining of γ-H2AX following etoposide treatment further confirmed that ASCC2 depletion delayed the resolution of DNA damage in DLEU1-overexpressing cells (Fig. 5D–E). Apoptosis assays further revealed that knockdown of ASCC2 partially restored the apoptotic response in DLEU1-overexpressing cells (Fig. 5F). Collectively, these findings suggest that DLEU1 fulfills its oncogenic function in GC by promoting DNA damage repair in an ASCC2-dependent manner, thereby enhancing cell survival and proliferation.
DLEU1 promotes antioxidant function remodeling in GC via G6PD regulation
Our findings indicate that DLEU1 may drive the initiation and progression of GC by modulating G6PD. To further elucidate the role of G6PD in GC, we overexpressed G6PD in AGS and MGC803 cells via transfection with a cDNA plasmid or a control vector (Supplementary Fig. 4A-B). G6PD overexpression significantly enhanced cell proliferation, whereas its knockdown inhibited these processes (Supplementary Fig. 4C).
We observed that G6PD overexpression promoted glucose uptake and ATP production, while it exerted minimal effects on lactate generation (Fig. 6A-C). As the rate-limiting enzyme of the pentose phosphate pathway, G6PD catalyzes the conversion of glucose-6-phosphate into NADPH, thereby maintaining intracellular redox homeostasis. In AGS and MGC803 cells with DLEU1 overexpression, NADPH levels, the NADPH/NADP⁺ ratio (Fig. 6D, E), and DNA synthesis (Fig. 6F) were significantly increased, while ROS levels (Fig. 6G) were markedly reduced. However, G6PD knockdown or inhibition with G6PD inhibitor (G6PDi-1) in DLEU1-overexpressing GC cells effectively reversed these effects (Fig. 6D-G). Moreover, DLEU1 overexpression significantly enhanced G6PD enzymatic activity, an effect that was suppressed upon G6PD knockdown or G6PDi-1 treatment (Fig. 6H). Additionally, knockdown of G6PD or G6PDi-1 treatment exacerbated comet tail formation, suggesting that increased ROS levels may compromise DNA damage repair (Supplementary Fig. 4D). To further investigate the functional link between DLEU1 silencing and chemo-sensitivity, we assessed apoptosis markers in our organoid model. TUNEL staining revealed that DLEU1 knockdown significantly enhanced Etoposide-induced apoptosis compared to the shNC control. This pro-apoptotic effect was further amplified by concurrent G6PD knockdown, indicating that DLEU1 silencing potentiates chemotherapy-induced cell death through mitochondrial apoptotic pathway activation (Fig. 6I). Collectively, these results demonstrate that DLEU1 promotes antioxidant remodeling in GC cells, at least in part, through the regulation of G6PD.
Targeting the DLEU1/ASCC2/G6PD axis restrains GC proliferation in vivo
To further explore the therapeutic potential of targeting the DLEU1/ASCC2/G6PD axis in GC, we established stable MKN45 cell lines transduced with shNC, shDLEU1, or shDLEU1 in combined with shASCC2 and subcutaneously implanted them into nude mice. Fourteen days after tumor formation, a subset of mice in the shDLEU1 + shASCC2 group received additional treatment with G6PDi-1 (10 mg/kg) administered every other day for a total of six doses (Fig. 7A). Tumor analysis revealed a significant reduction in tumor growth across all experimental groups compared to the shNC group, with more pronounced inhibitory effects observed upon combined suppression of multiple targets (Fig. 7B). Furthermore, the progressive suppression of ASCC2, ALKBH3, E2F1, and G6PD led to a marked decrease in their immunohistochemical staining scores, indicating reduced protein expression and altered cellular localization within the tumor microenvironment (Fig. 7C). These findings correlated with the observed decrease in tumor growth and proliferation, further highlighting the critical role of targeting multiple key components of the DLEU1/ASCC2/G6PD axis in modulating tumor biology.
Clinical significance of the DLEU1/ASCC2/ALKBH3/E2F1 axis and its epigenetic regulation in GC
To investigate the clinical significance of the DLEU1/ASCC2/ALKBH3/E2F1 signaling pathway in GC, we simultaneously examined the DLEU1 mRNA expression and the protein expression levels of ASCC2, ALKBH3 and E2F1 in tumor and normal gastric tissues using mIHC staining on tissue microarrays (TMA; N = 26, T = 104; Fig. 8A). Quantitative analysis revealed a significantly higher proportion of DLEU1-positive cells in GC tissues compared to matched normal gastric tissues (P < 0.001, Fig. 8B). Similarly, the densities of ASCC2-positive, ALKBH3-positive, and E2F1-positive cells were also significantly higher in GC tissues (Fig. 8C, all P < 0.001), with evident co-localization among these markers. Notably, analysis of E2F1 subcellular localization demonstrated a significantly higher nuclear-to-cytoplasmic ratio in tumor tissues relative to normal tissues (Fig. 8D, P < 0.001), suggesting transcriptional activation of E2F1 in GC. Correlation analysis demonstrated strong positive associations between DLEU1 and ASCC2 (R = 0.7356, P < 0.0001), ALKBH3 (R = 0.8323, P < 0.0001), and E2F1 (R = 0.7248, P < 0.0001; Fig. 8E). Moreover, a stronger positive correlation was observed between DLEU1 and nuclear-localized E2F1 (R = 0. 7412, P < 0.0001), whereas the correlation with cytoplasmic E2F1 was comparatively weaker (R = 0.5282, P < 0.0001; Fig. 8F). Additionally, the robust correlation between ASCC2 and ALKBH3 further supported their close functional interplay (R = 0.9249, P < 0.0001). These findings highlight the clinical relevance of the DLEU1/ASCC2/ALKBH3/E2F1 signaling pathway in GC (Fig. 8I).
To estimate whether these histone marks are dynamically regulated in response to environmental stimuli, such as chemotherapy or oxidative stress. We treated gastric cancer cell lines HGC27 and MKN45 with the chemotherapeutic agents Etoposide (10 µM, 24 h) and 5-Fluorouracil (5-Fu, 20 µg/mL, 24 h), as well as the oxidative stress inducer H_2_O_2_ (10 µM, 2 h). Using ChIP-qPCR analysis, we assessed the enrichment of H3K4me3 and H3K27Ac at the DLEU1 promoter under these conditions, with a DMSO-treated group serving as the control (Fig. 8H). This suggests that the hostile microenvironment induced by chemotherapy or oxidative stress may dynamically enhance the active histone marks at the DLEU1 locus. This could potentially establish a positive feedback loop that further amplifies DLEU1 expression, possibly contributing to tumor cell adaptation or resistance.
Discussion
LncRNAs play critical roles in GC progression [32], particularly in regulating DNA repair and metabolic reprogramming. Previous studies have demonstrated that lncRNAs orchestrate these processes by modulating key molecular pathways; for instance, SNHG17-mediated miR-3909/RING1/Rad51 axis altered the DNA repair system [33], while CCAT1-PTBP1 interactions facilitated glycolysis in GC [34]. Beyond these roles, lncRNAs are also critical regulators of oxidative stress, enabling cancer cells to maintain redox homeostasis and resist oxidative damage. Notably, LncRNA-HMG promotes chemoresistance in colorectal cancer by inhibiting p53-mediated ferroptosis and enhancing ROS scavenging capacity [35].
In the present study, we identified DLEU1 as a multifunctional regulator that simultaneously modulates DNA repair, oxidative stress response, and glucose metabolism in GC. Clinically, we demonstrated that DLEU1 is epigenetically activated by H3K27 acetylation and H3K4 methylation, driving its overexpression in GC tissues. Mechanistically, we uncovered a previously unrecognized axis in which DLEU1 facilitates ASCC2 nuclear translocation and interaction with ALKBH3, thereby stabilizing E2F1 mRNA and subsequently amplifying G6PD transcription (Fig. 8I). This axis orchestrates NADPH production, redox homeostasis, and glucose metabolism, while synergistically enhancing DNA repair. Functionally, dual silencing of DLEU1 and ASCC2, in combination with G6PD inhibition, synergistically suppressed the viability of GC cells and tumor growth in vivo, highlighting the therapeutic potential of targeting the DLEU1/ASCC2/G6PD axis. Notably, our findings revealed that chemotherapy and oxidative stress dynamically enhance active histone marks at the DLEU1 promoter, thereby establishing a positive feedback loop that amplifies DLEU1 expression and potentially contributes to tumor adaptation. This mechanism is reminiscent of ultrasensitive gene regulation through histone modification feedback loops.
While prior work established DLEU1 as an oncogenic lncRNA promoting GC proliferation via epigenetic mechanisms [11, 12], our study unveils novel regulatory layers. We illustrate a dual regulatory mechanism in which lncRNAs simultaneously influence the nuclear translocation of DNA repair complexes (ASCC2) and the transcriptional activation of metabolic enzymes (G6PD). Notably, building upon the seminal work by Wang et al. demonstrating ALKBH3-mediated stabilization of E2F1 mRNA through m1A demethylase activity [30], we confirmed that ALKBH3 overexpression robustly elevates E2F1 protein levels, aligning with established mechanisms. Given the prior rigorous validation of m1A modification sites and RNA decay dynamics in E2F1 regulation, our study pivots to delineate downstream metabolic networks. In addition, our cell-based assays revealed that E2F1 directly binds to the G6PD promoter and drives its transcriptional activation, thereby rewiring the PPP flux. This finding extends the functional scope of the ALKBH3–E2F1 axis to the regulation of redox homeostasis. Furthermore, as a classical cell cycle regulator [36], E2F1 preferentially regulates the PPP [37, 38]. This division of labor may reflect the distinct metabolic demands at different cell cycle phases, E2F1-driven G1/S transition requires a high supply of nucleotide precursors, and the PPP serves as a key metabolic hub by providing both ribose-5-phosphate and NADPH to support this process [39]. Additionally, we established a positive feedback loop in which E2F1 transcriptionally regulates ASCC2, further amplifying the oncogenic signaling mediated by DLEU1. This finding provides new insights into the intricate regulatory network governing DNA repair and metabolic adaptation in GC.
Despite the novel insights provided by this study, several limitations should be acknowledged. First, as this study is based on a retrospective cohort analysis, given the racial heterogeneity and epidemiological differences, the observed correlation between DLEU1 expression and clinical outcomes in Chinese GC population requires further validation in more multicenter cohorts. Second, while we have demonstrated E2F1-mediated transcriptional regulation of G6PD, the precise stoichiometric relationship and temporal dynamics of this regulation in vivo remain unclear. Given the ubiquitous and high basal expression of G6PD in both tumor and normal gastric tissues, establishing a clear regulatory link between E2F1 and G6PD in patient-derived samples is technically challenging. Bulk tissue-level analyses may be confounded by stromal or epithelial background signals. Therefore, we relied on cell-based assays to validate E2F1-driven transcriptional activation of G6PD. Future studies employing spatial transcriptomics or single-cell approaches may help overcome these limitations. Third, while our data establish DLEU1 as a key regulator, the question of functional redundancy with other lncRNAs (e.g., PVT1 or SNHG17) arises. Transcriptomic analyses suggest that these lncRNAs exhibit distinct expression patterns, and silencing DLEU1 alone significantly impairs DNA repair, supporting a non-redundant role. Future studies combining multiple lncRNA perturbations could elucidate potential synergistic effects.
Clinically, we observed elevated DLEU1 expression in MSI-H and intestinal-type GC, suggesting its potential as a molecular classifier. Notably, although the MSI-H phenotype typically arises from functional deficiencies in the MMR system, our exploratory analyses revealed that DLEU1 overexpression upregulates key MMR genes, such as MLH1, MSH6, and PMS2. This seemingly paradoxical observation may imply the existence of a compensatory feedback mechanism within MSI-H gastric cancer or reflect intratumoral heterogeneity. The precise role of DLEU1 in MMR proficiency warrants further investigation using CRISPR/Cas9-based gene editing in MMR-deficient models to elucidate the underlying mechanism.
Despite uncovering a critical role for DLEU1 in GC progression, several key scientific questions remain to be addressed to further elucidate its mechanism and facilitate clinical translation. First, although chromatin isolation by RNA purification coupled with mass spectrometry (ChIRP-MS) identified ASCC2 as a DLEU1-interacting protein, the specific binding domains and dynamic regulatory mechanisms remain unclear. While the scaffolding function of DLEU1 in facilitating the ASCC2-ALKBH3 interaction is established by RNA pull-down and RIP assays, the specific structural domains responsible for this activity remain uncharacterized. A comprehensive mapping of these functional elements, such as through RNA truncation analysis, is considered technically challenging due to the complex secondary and tertiary structures anticipated for this long lncRNA. The precise delineation of DLEU1’s functional domains is identified as a critical objective for future research. Second, whether the DLEU1-ASCC2-G6PD axis is subject to external regulatory signals remains to be explored, yet it is still unclear whether this regulation is dynamically influenced by DNA damage signals (e.g., ATM/ATR kinases [40]) or metabolic stress (e.g., the NADPH/NADP + ratio). In this context, the observed DNA damage upon G6PD inhibition in DLEU1-overexpressing cells may involve multiple mechanisms. G6PD is a critical enzyme in the pentose phosphate pathway, serving as a primary source of NADPH, which is essential for maintaining redox homeostasis and providing ribose-5-phosphate for nucleotide synthesis. The increase in DNA damage markers may be attributed to elevated oxidative stress due to insufficient NADPH or imbalances in dNTP pools. While our data cannot distinguish the relative contributions, both pathways likely act synergistically, and future studies should directly quantify ROS and dNTP dynamics.
Conclusions
Taken together, this study establishes DLEU1 as a multifunctional lncRNA that integrates epigenetic, genomic, and metabolic reprogramming in GC via the ASCC2/ALKBH3-E2F1-G6PD axis. These findings provide a conceptual framework for understanding how non-coding RNAs orchestrate multidimensional cancer hallmarks, a paradigm that may extend to other malignancies. Targeting the DLEU1/ASCC2/G6PD axis significantly suppresses GC cells proliferation and tumor growth, proposing a therapeutic strategy targeting this pathway. Although therapeutic targeting of lncRNAs remains challenging, our study identifies actionable targets for combination therapy and underscores the importance of dissecting lncRNA functions within complex regulatory networks to develop effective treatment strategies.
Fig. 1DLEU1 is upregulated in gastric cancer and is associated with poor prognosis. A–C. Relative expression of DLEU1 in GC tissues compared to normal tissues in the FUSCC cohort (A), TCGA cohort (B), and GEO dataset GSE29272 (C). D. Comparison of DLEU1 expression between microsatellite instability (MSI) and microsatellite stability (MSS) subtypes in the TCGA cohort. E. Relative DLEU1 expression in intestinal and diffuse subtypes of GC in the TCGA cohort (left) and GSE22377 dataset (right). F. Kaplan-Meier survival curves for disease-free survival (DFS, left) and overall survival (OS, right) in the FUSCC cohort. G–H. Receiver operating characteristic (ROC) curve analyses evaluating the prognostic performance of DLEU1, depth of invasion (Depth), Lymphatic metastasis (LM), and TNM stage for DFS (G) and OS (H) in the FUSCC cohort. I. Genomic landscape of the DLEU1 locus highlighting H3K27Ac and H3K4me3 peaks, indicative of active regulatory elements (upper). Chromatin immunoprecipitation (ChIP) assays confirmed the enrichment of these histone modifications at the DLEU1 promoter (lower). *, P < 0.05; **, P < 0.01; ***, P < 0.001; ns, not significant
Fig. 2ADLEU1 promotes GC cells proliferation, DNA damage repair, and metabolic reprogramming. A. Relative DLEU1 expression levels in gastric cancer (GC) cell lines (AGS, MGC803, HGC27, MKN45) compared to a normal gastric epithelial cell line (GES-1). B. Cell proliferation assays in GC cell lines transfected with DLEU1 overexpression plasmid, empty vector, siRNAs targeting DLEU1, or control siRNA (siNC). C. Gene set enrichment analysis (GSEA) showing significant enrichment of DNA repair, metabolic pathways and E2F1 targets upon DLEU1 overexpression. D. Comet assay results demonstrating reduced DNA damage in DLEU1-overexpressing AGS and MGC803 cells, compared to the empty vector transfected group. Representative images and quantification of tail moments are shown. Scale bar =20μm. E. Western blot analyzed of γH2AX levels in HGC27 and MKN45 cells transfected with DLEU1 shRNA (shDLEU1) or control shRNA (shNC), following Etoposide treatment (10 µM for 1 hour). F. Cell viability analysis of GC organoid transfected with shDLEU1 or shNC, after treated with increasing concentrations of Etoposide. Left panel: Quantitative viability analysis. Right panel: Representative images of tumor organoids treated with 10 µM Etoposide. Scale bar =200μm. G. Representative immunohistochemistry (IHC) images showing γH2AX expression in GC organoid transfected with shDLEU1 or shNC, after treated with Etoposide (10 μM). Scale bar = 10 μm. H. Etoposide treatment synergistically inhibited tumor growth in DLEU1-knockdown xenograft models. Left panel: Representative tumor images from shNC, shDLEU1, shNC+Etoposide, and shDLEU1+Etoposide groups. Middle panel: Tumor weight analysis across different groups. Right panel: Tumor volume progression over time. I. γH2AX staining revealed increased DNA damage upon Etoposide treatment in DLEU1-knockdown tumors. Left panel: Representative IHC staining for γH2AX in shNC+Etoposide and shDLEU1+Etoposide groups. Scale bar =50μm. Right panel: Quantification of γH2AX staining scores. *, P < 0.05; **, P < 0.01; ***, P < 0.001; ns, not significant. See also Figures S1 and S2.
Fig. 3DLEU1 facilitates ASCC2 nuclear translocation and promotes ASCC2–ALKBH3 interaction. A. Silver staining (left panel) analysis of proteins isolated from AGS cells using ChIRP with DLEU1 or the control LacZ probes. The red rectangle highlighted the potential presence of ASCC2 in the DLEU1 complex, subsequently confirmed by LC/MS mass spectrometry analysis (right panel). B-C. RNA pull-down (B) and RIP assays (C) demonstrated the interaction between ASCC2 and DLEU1 in AGS and HGC27 cells. D. Immunofluorescence staining showed co-localization of DLEU1 with ASCC2, Scale bar = 10 μm. E. Western blot results showed that overexpression of DLEU1 increased ASCC2 protein levels in MGC803 and AGS cells, whereas knockdown of DLEU1 decreased ASCC2 protein levels in HGC27 and MKN45 cells. F-G. Nuclear-cytoplasmic fractions (F) and Immunofluorescence staining (G) demonstrate increased nuclear localization of ASCC2 in DLEU1 overexpressed cells. Scale bar = 10 μm. H. Endogenous co-immunoprecipitation assays reveal enhanced ASCC2–ALKBH3 binding following DLEU1 overexpression. I. Western blot analysis showed changes in ASCC2 and ALKBH3 protein expression in AGS with DLEU1 overexpression or combined DLEU1 overexpression with ASCC2 knockdown(left panel), and in HGC27 cells with DLEU1 knockdown or combined DLEU1 knockdown with ASCC2 overexpression (right panel). *, P < 0.05; **, P < 0.01; ***, P < 0.001; ns, not significant. See also Figures S3
Fig. 4DLEU1 promotes G6PD transcription via ASCC2/ALKBH3-mediated recruitment of E2F1. A-B. qRT-PCR and Western blot analysis of E2F1 expression in AGS and MGC803 cells upon ALKBH3 overexpression. C. Time-course analysis of E2F1 mRNA levels in AGS and MGC803 cells transfected with vector or ALKBH3. D-E. RT-qPCR and western blot analyzed of E2F1 and G6PD expression in AGS and MGC803 cells following DLEU1 overexpression or DLEU1 overexpression combined with ASCC2 knockdown. F-G. RT-qPCR and western blot analyzed of G6PD levels in AGS and MGC803 cells with E2F1 overexpression. H. qRT-PCR analysis of G6PD mRNA expression in AGS and MGC803 cells after ALKBH3 overexpression or co-transfection with ALKBH3 and shRNA targeting E2F1 (shE2F1). I. Western blot analysis of ASCC2, G6PD and E2F1 expression in AGS and MGC803 cells with ALKBH3 overexpression or ALKBH3 overexpression combined with E2F1 knockdown. J. ChIP-qPCR analysis confirmed E2F1 binding to the G6PD promoter and intron 2 regions in AGS cells. K. Luciferase reporter assay showed the transcriptional activity of wild-type and mutant G6PD promoter and intron 2 regions in AGS cells. L. Luciferase assays demonstrate that knockdown of DLEU1, ASCC2, or ALKBH3 attenuates E2F1-mediated activation of G6PD transcription. L-M. ChIP-qPCR and luciferase reporter validated E2F1 binding to an intronic region of ASCC2 in AGS cells. M. Luciferase assays indicate that knockdown of DLEU1, ASCC2, or ALKBH3 reduces E2F1-driven ASCC2 transcription. *, P < 0.05; **, P < 0.01; ***, P < 0.001; ns, not significant
Fig. 5. Inhibition of ASCC2 abrogates DLEU1-mediated DNA damage repair and apoptosis resistance in GC cells. A. Proliferation assays in AGS and MGC803 with DLEU1 overexpression, with or without ASCC2 knockdown, and in HGC27 and MKN45 cells with DLEU1 knockdown, with or without ASCC2 overexpression. B-C. Comet assay, Western blot analysis of γ-H2AX protein with DLEU1 overexpression or DLEU1 overexpression combined with ASCC2 knockdown. Scale bar = 50 μm. D-E. Immunofluorescence staining of γH2AX in AGS cells treated with Etoposide. Representative images at 0, 4, 8, and 12 h after treatment are shown. Quantification of average foci number is shown in figure E. Scale bar = 100 μm. F. Apoptosis analysis by flow cytometry in AGS and MGC803 with DLEU1 overexpression or DLEU1 overexpression combined with ASCC2 knockdown. *, P < 0.05; **, P < 0.01; ***, P < 0.001; ns, not significant
Fig. 6DLEU1 modulates cellular metabolism, redox homeostasis, and DNA Damage via G6PD regulation. A-C. Glucose uptake, ATP production, lactate production in AGS and MGC803 cells transfected with a G6PD overexpression vector (left) or DLEU1 overexpression combined with G6PD knockdown (shG6PD) or G6PD inhibition (G6PDi-1) (right). D-G. NADPH levels, NADPH/NADP + ratio, EdU incorporation and ROS levels in AGS and MGC803 cells with DLEU1 overexpression combined with shG6PD, or G6PDi-1 treatment. Scale bar = 100 μm. H. G6PD enzymatic activity assay in AGS and MGC803 cells with DLEU1 overexpression combined with shG6PD, or G6PDi-1 treatment. I. TUNEL staining of organoids treated with shNC, shDLEU1, and shDLEU1 + shG6PD. Scale bar = 100 μm. *, P < 0.05; **, P < 0.01; ***, P < 0.001; ns, not significant. See also Figures S4
Fig. 7DLEU1 knockdown suppresses tumor growth by targeting ASCC2 and G6PD in xenograft models. A. Schematic representation of the xenograft experiment. MKN45 cells with stable knockdown of DLEU1 (shDLEU1) or co-knockdown of DLEU1 and ASCC2 (shDLEU1 + shASCC2) were subcutaneously implanted into nude mice. G6PD inhibitor (G6PDi-1) was administered intraperitoneally (10 mg/kg, every 2 days, for a total of six doses) from day 15 to day 21. B. Tumor growth analysis across different groups. Left: Representative images of tumors from the indicated groups. Middle: Tumor weight comparison among groups. Right: Tumor volume progression over time. C. IHC staining for ASCC2, ALKBH3, E2F1, and G6PD in tumor tissues. Representative IHC images (left) and quantification of staining scores (right) for each marker. Scale bar = 50 μm. *, P < 0.05; **, P < 0.01; ***, P < 0.001; ns, not significant
Fig. 8. Expression and correlation analysis of DLEU1 and associated markers in normal and GC tissues, and its epigenetic regulation in GC. A. Representative multiplex immunofluorescence staining images showing DLEU1 (green), ASCC2 (white), ALKBH3 (orange), and E2F1 (cyan) in normal and tumor tissues (N = 26, T = 104). Scale bar = 50 μm. B. Quantification of DLEU1-positive cell density in normal and tumor tissues. C. Quantification of ASCC2-, ALKBH3-, and E2F1-positive cell densities in normal and tumor tissues. D. Percentage of E2F1 localization in the nucleus and cytoplasm in normal and tumor tissues. E. Scatter plots showing positive correlations between DLEU1 expression and ASCC2, ALKBH3, and E2F1 expression in tumor tissues. F. Correlation between DLEU1 expression and E2F1 localization in the cytoplasm and nucleus in tumor tissues. G. Correlation between ASCC2- and ALKBH3-positive cell in tumor tissues. H. HGC27 and MKN45 cells were treated with DMSO (control), Etoposide (10 µM, 24 h), 5-Fluorouracil (5-FU, 20 µg/mL, 24 h), or H_2_O_2_ (10 µM, 2 h). The enrichment of H3K4me3 and H3K27ac at the DLEU1 promoter was analyzed by ChIP-qPCR. I. Proposed model illustrating how DLEU1 promotes gastric cancer progression via the ASCC2/ALKBH3/E2F1/G6PD axis, impacting transcriptional activation, DNA repair, and redox homeostasis. *, P < 0.05; **, P < 0.01; ***, P < 0.001; ns, not significant
Supplementary Information
Below is the link to the electronic supplementary material.
Supplementary Material 1
Supplementary Material 2
Supplementary Material 3
The reference list from the paper itself. Each links out to its DOI / PubMed record.