Evaluation of a New Methylimidazole‐Containing Thiosemicarbazone as a Cu+/Cu2+‐Targeting Ligand in the Context of Alzheimer's Disease
Barbara Marinho Barbosa, Charlène Esmieu, Antal Galvácsi, Mariana Viana Costa, Adèle Brison, Sonia M. Ladeira, Jade de Oliveira, Csilla Kállay, Christelle Hureau, Nicolás A. Rey

TL;DR
A new compound called HXE can reduce copper-related toxicity in Alzheimer's disease by preventing harmful protein aggregation and oxidative stress.
Contribution
HXE is a novel thiosemicarbazone ligand that effectively modulates copper-Aβ interactions and reduces toxicity in Alzheimer's disease.
Findings
HXE binds Cu+ and Cu2+ with high selectivity over Zn2+ at physiological pH.
HXE reduces Cu(Aβ)-mediated ROS production and alters Aβ aggregation into less harmful fibrillar structures.
HXE prevents copper-induced modulation of Aβ40 self-assembly and restores typical fibrillar aggregation.
Abstract
The binding of copper ions to amyloid‐β (Aβ) peptide leads to reactive oxygen species (ROS) formation and toxic soluble oligomers, contributing to oxidative stress in Alzheimer's disease (AD). Thus, studying compounds with moderate copper affinity is a promising strategy to prevent its interaction with Aβ and reduce toxicity. Here, we evaluated a new tri‐coordinating thiosemicarbazone (HXE) with chelating properties to regulate cuprotoxicity in AD. The ligand was nontoxic against HT‐22 hippocampal neuronal cells and bound Cu+ and Cu2+ at pH 7.4, with affinity constants (log K cond) of 8.7 and 12.3, respectively, showing high selectivity over Zn2+ (log K app = 5.0). In the presence of Aβ and Cu2+, HXE formed stable ternary complexes at physiological pH. Ascorbate consumption and coumarin‐3‐carboxylic acid fluorescence assays showed that the ligand significantly reduces Cu(Aβ16)‐mediated…
Genes, proteins, chemicals, diseases, species, mutations and cell lines named across the full text — each resolved to its canonical identifier and authoritative record.
Click any figure to enlarge with its caption.
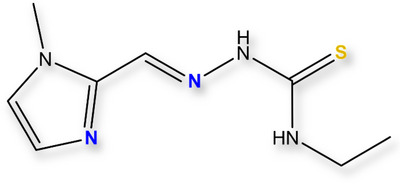 FIGURE 1
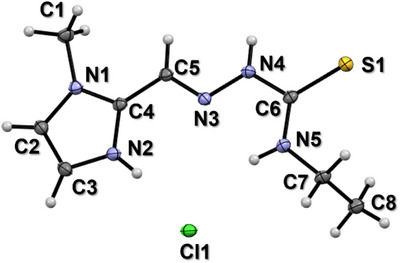 FIGURE 2
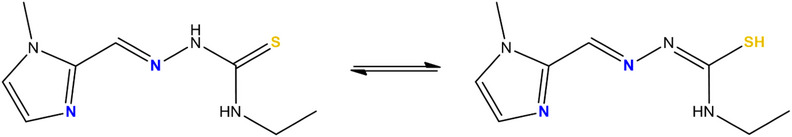 FIGURE 3
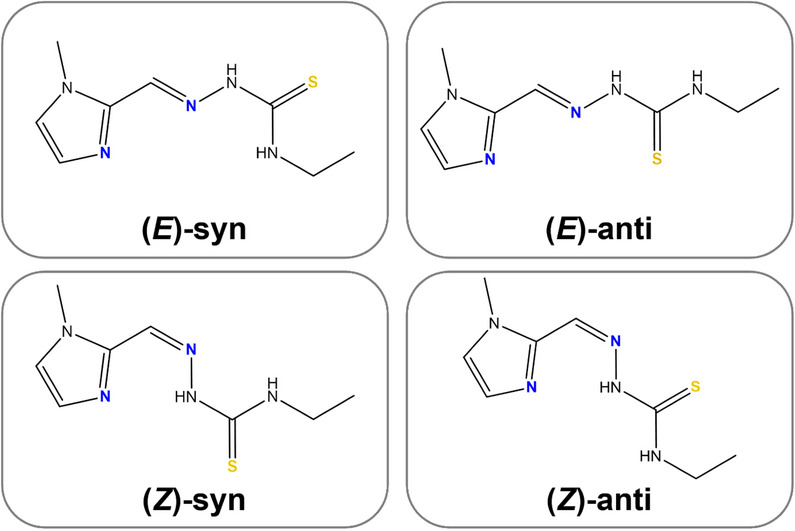 FIGURE 4
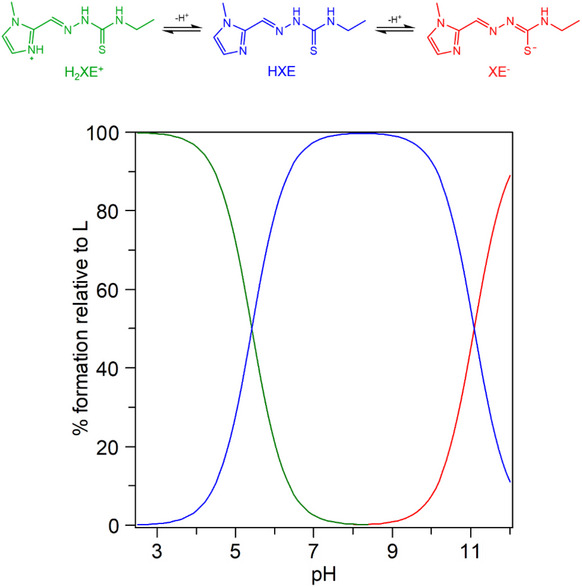 FIGURE 5
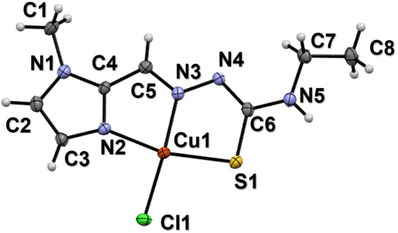 FIGURE 6
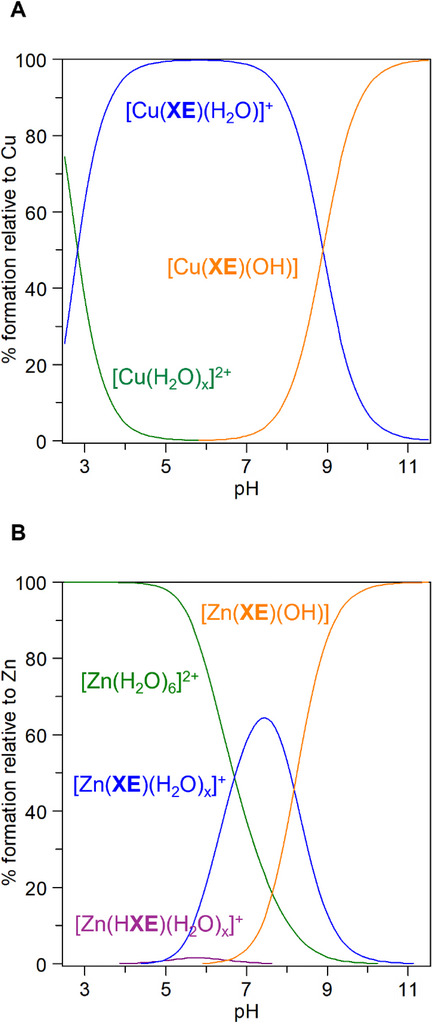 FIGURE 7
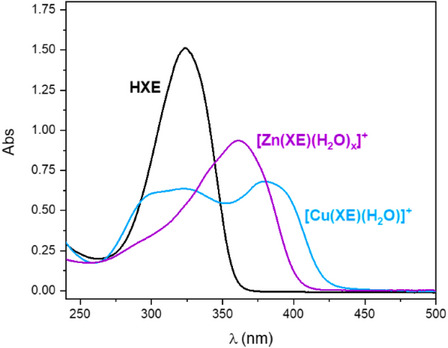 FIGURE 8
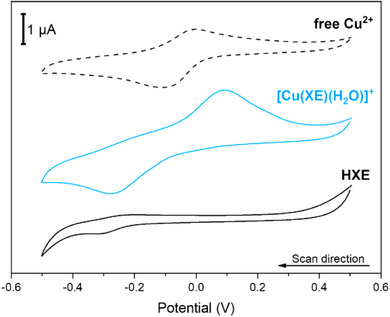 FIGURE 9
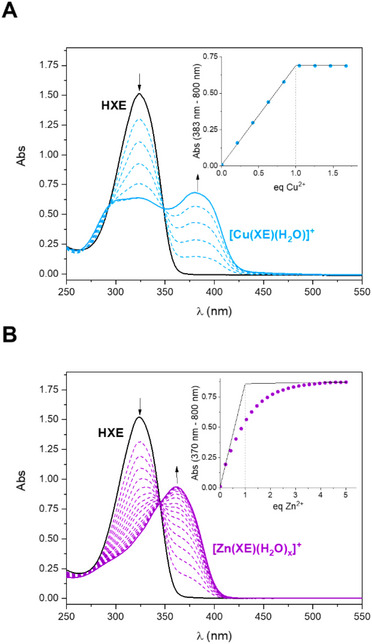 FIGURE 10
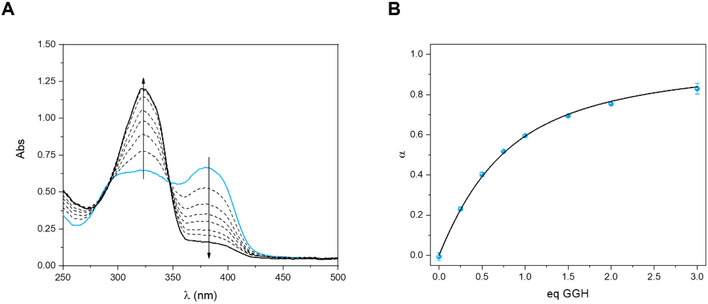 FIGURE 11
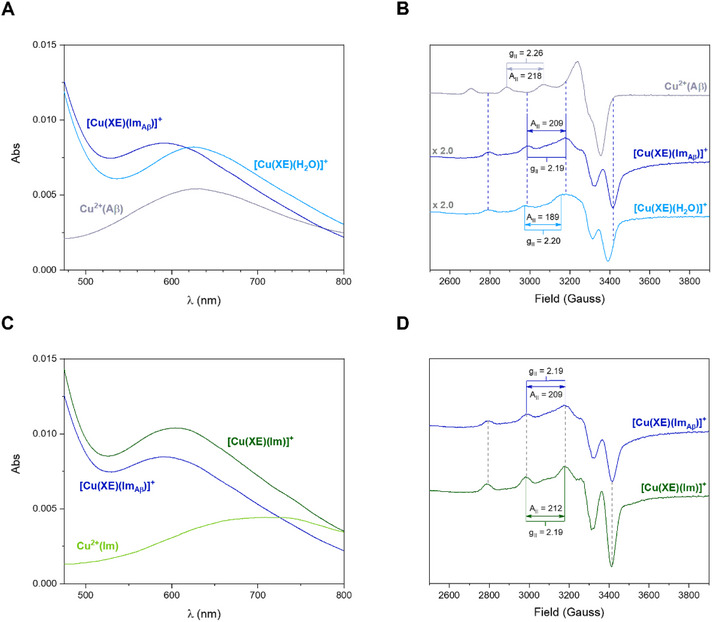 FIGURE 12
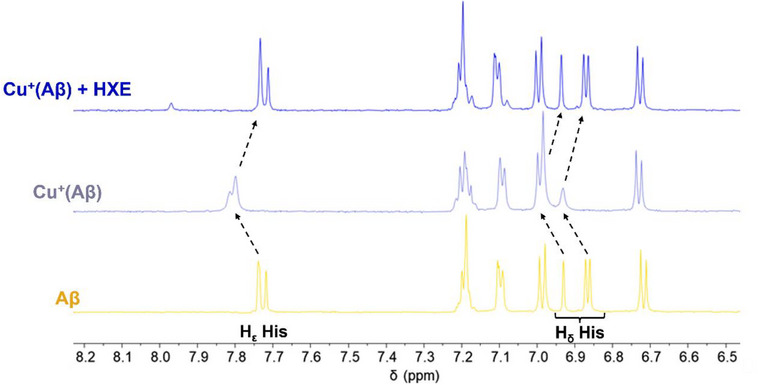 FIGURE 13
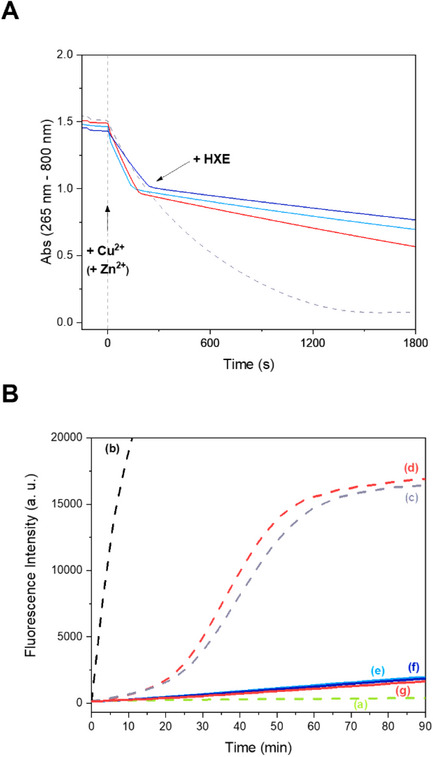 FIGURE 14
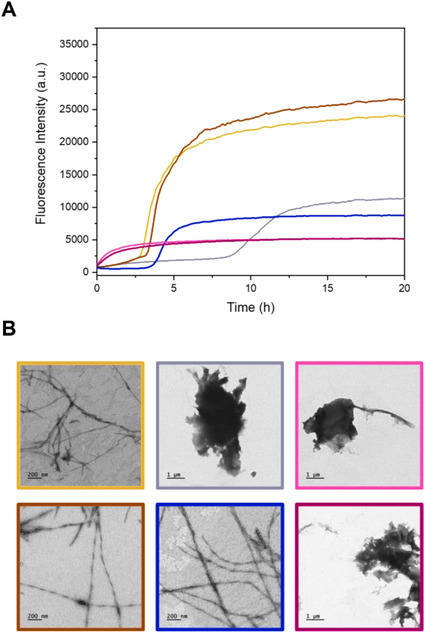 FIGURE 15
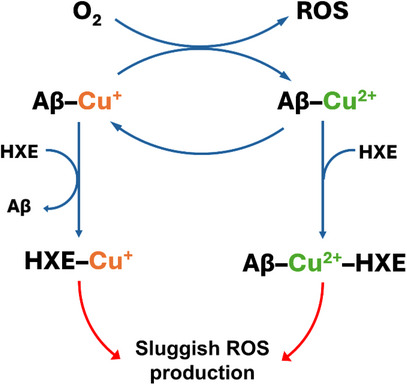 FIGURE 16
| HXE | + | Zn2+ | ⇌ | [Zn(XE)(H2O)x]+ | |
|---|---|---|---|---|---|
| Initial: | |||||
| Equilibrium: |
| MW (g mol−1) | cLog P | PSA (Å2) | |
|---|---|---|---|
| Calculated | 211.29 | 0.47 | 86.33 |
| Expected range | 200–450 [ | 0–3 [ | < 90 [ |
| log β | ||
|---|---|---|
| Species |
|
|
| H2L+ | 16.51(10) | |
| HL | 11.09(7) | |
| MLH2+ | ‒ | 13.89(15) |
| ML+ | 15.47(5) | 9.02(3) |
| MLH‐1 | 6.58(8) | 0.84(5) |
|
| ε (M−1 cm−1) | Transition | |
|---|---|---|---|
| HXE | 324 | 31700 | Intra‐ligand |
| [Cu(XE)(H2O)]+ |
383 626 |
13680 164 |
LMCT
|
| [Zn(XE)(H2O)x]+ | 362 | 19690 | LMCT |
| HXE | Aβ | ||
|---|---|---|---|
| Metal ion | Log | Experimental conditions | Log |
| Cu2+ | 12.3 ± 0.1 | by competition with the GGH peptide (50 mM HEPES pH 7.4) | 9 – 10 [ |
| 11.8 | by potentiometric titration (at pH 7.4) | ||
| Cu+ | 8.7 ± 0.1 | by competition with BCA (50 mM HEPES pH 7.4 0.3% ACN) | 6.9 [ |
| 11.2 ± 0.1 | ∼10 [ | ||
| Zn2+ | 5.0 ± 0.1 | by spectrophotometric titration (50 mM HEPES pH 7.4) | 5 – 6 [ |
| 5.4 | by potentiometric titration (at pH 7.4) | ||
| UV‐Vis | EPR | ||||
|---|---|---|---|---|---|
|
| ε (M−1 cm−1) | Transition | gII | AII (10−4 cm−1) | |
| [Cu(XE)(H2O)]+ |
383 626 |
13680 164 |
LMCT
| 2.20 | 189 |
| [Cu(XE)(Im)]+ | 604 | 208 |
| 2.19 | 212 |
| [Cu(XE)(ImAβ16)]+ | 591 | 169 |
| 2.19 | 209 |
| Cu2+(Aβ16) | 633 | 108 |
| 2.26 | 218 |
- —ANR project Copperation
- —Conselho Nacional de Desenvolvimento Científico e Tecnológico, Brazil
- —Fundação Carlos Chagas Filho de Amparo à Pesquisa do Estado do Rio de Janeiro10.13039/501100004586
- —Fundação de Amparo à Pesquisa do Estado do Rio Grande do Sul10.13039/501100004263
- —Coordenação de Aperfeiçoamento de Pessoal de Nível Superior10.13039/501100002322
Peer Reviews
No public reviews on file for this paper yet. If you reviewed it on a platform where reviews are public (OpenReview, ICLR, NeurIPS, ICML), you can paste yours below so the community can read it here.
Videos
No videos yet. Explain this paper in a talk, walkthrough, or lecture? Add one.
Taxonomy
TopicsAlzheimer's disease research and treatments · Cholinesterase and Neurodegenerative Diseases · Trace Elements in Health
Introduction
1
Copper is an essential trace element in biological systems, being required as a structural component, electron transporter agent and cofactor of redox enzymes, including Cu/Zn superoxide dismutase (SOD1) or cytochrome c oxidase, that play a critical role in antioxidant defense and mitochondrial respiratory chain, respectively [1, 2]. In the nervous system, this metal actively participates in neurotransmitter biosynthesis, cognitive processes and gene expression [3]. Copper homeostasis in the brain is finely regulated by the action of transporters, enzymes and chaperones to ensure the proper distribution and avoid toxic accumulation [4, 5, 6]. Copper can be found either inertly bound to ceruloplasmin (Cp), representing 75–95% of the total amount, or as “non‐Cp‐Cu” (“free copper”) [7], when bound to coordinating biomolecules, such as Human Serum Albumin (HSA) that provides a higher lability and bioavailability of the metal [4, 8, 9]. The passage of this metal through the blood‐brain barrier (BBB) is a highly selective process and depends on transporters such as CTR1, ATP7A, and ATP7B [4]. Disturbance in its homeostasis has been linked to several pathological conditions, as neurodegenerative disorders, cancer and cardiovascular diseases [4, 10].
In Alzheimer's disease (AD), growing evidence points to physiological metal ions (mainly Cu, Zn and Fe) imbalance as the main bioinorganic factor linked to this pathology's progression [7, 11, 12, 13]. Copper has been found to be present at high concentrations in senile plaques, one of the main hallmarks of the disease [14, 15, 16]. These insoluble deposits are mainly composed by aggregates of a 40–42 amino acid residues peptide, called amyloid‐β (Aβ), derived from the pathological cleavage of the transmembrane amyloid precursor protein (APP) [17, 18, 19, 20, 21]. At pH around 7, Aβ forms stable complexes with Cu ions, and this interaction modulates the peptide's aggregation kinetics, shifting the equilibrium from the formation of insoluble fibrils to toxic soluble oligomers [22, 23, 24, 25, 26]. Furthermore, the Cu(Aβ) complex has a Cu‐associated redox activity, cycling between Cu^+^ and Cu^2+^ states in the presence of molecular oxygen and biological reductants, such as ascorbate. This process culminates in the generation of reactive oxygen species (ROS), which contribute to neuronal oxidative stress, a central mechanism implicated in neurodegeneration [27, 28].
Therefore, the use of ligands (including some of the multitarget type) has emerged as a promising strategy to limit the interaction of Aβ with copper, relieving the toxicity mediated by Cu(Aβ) [5, 29, 30, 31, 32, 33, 34, 35, 36, 37, 38, 39, 40]. However, to date, no chelating agent has shown satisfactory results in clinical trials, not even those that showed satisfactory in vitro results [41, 42]. It is worth noting that most of the proposed compounds so far have been designed to specifically target Cu^2+^, not taking into consideration the crucial role of redox transition to Cu^+^ for the toxicity of the Cu(Aβ) complex [5]. At physiological pH, Cu^2+^ ions bind to Aβ with a square‐planar geometry, through the imidazole (Im) rings of two His residues (His6 and either His13 or His14), the N‐terminal amine and the carboxylate group of Asp1, with an affinity of 10^9^ – 10^10^ M^‒1^ [43, 44, 45, 46]. In turn, Cu^+^ is linearly coordinated to the peptide, involving two Im groups of His residues, with an affinity in the literature ranging from 10^7^ to 10^10^ M^‒1^ [46, 47, 48, 49]. Thus, chelators that focus on both oxidative states of copper may be an attractive approach to interrupt the pathological redox cycles involved in Aβ neurotoxicity [50]. Besides, ligands that target Cu^2+^ face a challenge related to selectivity toward other metal ions present in the extracellular medium, mainly Zn^2+^, that displays a similar preference for N/O‐donors and is present at a higher concentration than copper in the synaptic cleft, reducing the compounds’ efficacy [42, 51]. The difference in the coordination chemistry of the metal ions can be explored to design an improved chelator and overcome selectivity limitations. Cu^2+^ and Zn^2+^ are considered borderline acids based on Pearson's concept [52], showing a preference for intermediate bases, as those containing delocalized N/O‐donors. However, due to the Jahn‐Teller effect, copper tends to adopt square‐planar or distorted octahedral geometries, whereas zinc has no electronic constraints and is thus usually found tetrahedrally coordinated. With respect to Cu^+^, it has a softer character and preferably binds to soft donors, such as sulfur, in linear, trigonal planar or tetrahedral geometries.
Recently, some of us have shown interest in targeting Cu^+^ ions in the context of AD [50, 53, 54, 55, 56]. Those compounds prove to be effective in removing copper from Aβ, lessening or stopping Cu(Aβ)‐induced ROS production and showing satisfactory selectivity toward Zn^2+^ [54, 56], encouraging the use of this strategy in the rational design of novel potential chelating agents for AD therapy. To be considered a promising drug candidate, a compound must meet several criteria: (i) ability to interrupt Cu(Aβ) redox cycle, (ii) rapid coordination kinetics [57, 58], (iii) capacity to abstract Cu^+^/Cu^2+^ from Aβ or forming stable compound‐Cu‐Aβ ternary complexes without compromising copper ions involved in physiological activities, and (iv) high selectivity over other metal ions abundant in the extracellular environment. Additionally, favorable pharmacokinetic properties, especially regarding toxicity and permeability through the BBB, are important criteria to fulfil if medical applications are foreseen [42].
Over the past years, some of us have extensively investigated N‐acylhydrazones (NAHs) as a promising class for the management of metal‐enhanced aggregopathies [59, 60, 61, 62, 63, 64]. NAHs have demonstrated suitable affinity for Cu^2^⁺ and Zn^2^⁺, being able to compete with amyloidogenic peptides without disrupting metal ion homeostasis in the organs of healthy Wistar rats [62]. More recently, a new family of NAHs derived from 1‐methylimidazole‐2‐carboxaldehyde has shown improved properties [59, 65, 66, 67, 68, 69]. The inclusion of this five‐membered nitrogen‐containing ring into previously studied NAH structures proved effective in enhancing water solubility, hydrolytic stability, and reducing toxicity, while also helping to complete the coordination sphere of Cu^2^⁺. Based on this, and aiming to target Cu⁺ ions in addition to Cu^2+^, we propose in this work the replacement of the hydrazone moiety by a thiosemicarbazone group, to introduce a sulfur atom at the coordination site—a softer donor atom.
Thiosemicarbazones (TSCs) and their metal complexes are known in the literature for their wide range of biological properties: anticancer, antioxidant, antiinflammatory, antibacterial, and antiviral activities [70, 71]. In AD context, previous studies showed that TSCs derivates have the ability to inhibit Aβ self or Cu‐induced aggregation, antioxidant activity, acetylcholinesterase (AChE) activity, and have low toxicity in cell models and a suitable permeability through BBB [72, 73, 74, 75, 76, 77, 78, 79, 80]. Hence, we herein report an investigation into the therapeutic potential of a new TSC–1‐methylimidazole‐2‐carboxaldehyde 4‐ethyl‐3‐thiosemicarbazone—(HXE, Figure 1) containing a methylimidazole moiety, which was designed to target both biologically relevant oxidation states of copper in the context of AD. HXE was evaluated regarding its affinity for Cu^2+^ and Cu^+^ ions, selectivity relative to Zn^2+^ and the ability to reverse deleterious effects induced by Cu(Aβ), including the generation of ROS and the metal‐induced modulation of peptide aggregation.
HXE structure. Potential donor atoms are highlighted in color.
Materials and Methods
2
Chemicals
2.1
Solvents and reactants were purchased from commercial sources in the higher purity available. Fresh stock solutions of HXE (5 mM, Milli‐Q), ascorbate (5 mM, Milli‐Q) and 3‐CCA (2 mM, 200 mM phosphate buffer pH 7.4) were prepared at the beginning of each day. Stock solutions of Cu^2+^ and Zn^2+^ (0.1 M, water), from the salts CuSO_4_·5 H_2_O and ZnSO_4_·1 H_2_O, were used. BCA (bicinchoninic acid) (10 mM) was prepared by dissolution in Milli‐Q water and the exact concentration was determined by UV‐Vis titration with CuSO_4_ in the presence of 3 equivalents of ascorbate to obtain the Cu^+^ [Cu(BCA)2]^3‒^ complex (ε_562 nm_ = 8060 ± 30 M^−1^ cm^−1^, 50 mM HEPES pH 7.4). Tetrakis(acetonitrile)copper(I) tetrafluoroborate salt was bought from TCI. Stock solutions were prepared inside an argon flushed glove box by dissolving the powder in ACN or ACN‐d 3 for NMR experiments. The concentration was determined by UV‐Vis titration with an excess of BCA in a 50 mM HEPES pH 7.4 solution. Stock solution of Thioflavin T (ThT) was prepared by dissolving the powder in Milli‐Q and concentration was determined by UV‐Vis (ε_412 nm_ = 33000 M^−1^ cm^−1^) [81].
GGH (sequence GGH‐NH_2_), Aβ_16_ (sequence DAEFRHDSGYEVHHQK‐NH_2_) and Aβ_40_ (sequence DAEFRHDSGYEVHHQKLVFFAEDVGSNKGAIIGLMVGGVV) peptides were bought from GeneCust or ApexBio with purity grade > 95%. Stock solutions of GGH and Aβ_16_ were prepared by the solubilization of the powder in Milli‐Q water. For GGH, the concentration was determined by UV‐Vis titration with Cu^2+^ until no change in d‐d band (530 nm) was observed. For Aβ_16_, the concentration of the stock was determined by the absorption of Tyr10 at 276 nm, corrected for the absorption at 300 nm (ε_276 nm_ = 1410 M^−1^ cm^−1^, pH ∼ 2) in UV‐Vis [82]. Aβ_40_ was monomerized and purified by FPLC before utilization following the previously reported protocol [83]. Concentration of the FPLC fractions of interest were determined in a 500 mM NaOH solution using the electronic absorption of deprotonated Tyr10 at 293 nm, corrected for the absorption at 360 nm (ε_293 nm_ = 2400 M^−1^ cm^−1^, pH >13) [82].
Instruments
2.2
Elemental analyses were performed in a Perkin Elmer 2400 Series II Flash Combustion Analyzer in duplicate at room temperature.
Infrared spectra were acquired on a Perkin Elmer FT‐IR Frontier and Perkin Elmer Spectrum Two FT‐IR spectrometers.
^1^H NMR spectra were recorded on a Bruker AvanceIII 400 or an Avance NEO 600 spectrometers at room temperature using dimethylsulfoxide (DMSO‐d 6) or aqueous solution with 10% D_2_O as solvent. Suppression of the water signal was performed using excitation sculpting method. Crystallographic data of HXE and its Cu^2+^ complex were collected on a Rigaku XtaLAB Synergy Dualflex diffractometer using a PhotonJet X‐ray source (CuK α, λ = 1.54184 Å). An Oxford Cryosystems Cryostream cooling device was used to collect data at low temperature [100(2) K]. Potentiometric titrations were performed in a MOLSPIN pH‐meter equipped with a Metrohm 6.0234.100 combined glass electrode (Metrohm) in the pH range 2.5–11.5, while the dosing of the titrant was made with a computer‐controlled MOL‐ACS microburette.
EPR spectra were acquired using an Elexsys E‐500 Bruker spectrometer operating at a microwave frequency of approximatively 9.4 GHz with a modulation amplitude of 5G, 160 s of conversion time, 2 scans and 2500 to 3900 G as magnetic field range. The experiments were carried out at 120 K using a liquid nitrogen cryostat.
UV‐Vis experiments were performed in a Hewlett Packard Agilent 5484 spectrophotometer under controlled temperature and continuous stirring (25°C, 800 rpm) using a 1 cm cuvette or, alternatively, in a Spectrostar nano (BMG Labtech) spectrophotometer using a 96 wells plate (Greiner, F‐bottom, UV clear) at 25°C, stirring at 500 rpm for 10 s before each measurement. For cell viability experiments, a SpectraMax M5 spectrophotometer (Molecular Devices) was used.
Cyclic Voltammograms were acquired on an Autolab PGSTAT302N potentiostat controlled with GPES 4.9 software and using three electrodes: a glassy carbon electrode as working electrode, a platinum wire as counter electrode and a saturated calomel electrode (SCE) as reference.
Fluorescence experiments were performed in plates readers from BMG Labtech (ClarioStar, Omega, and Optima) using a 96 or 384 wells plate.
Eletronic Microscopy was performed in a Jeol JEM‐1400, JEOL inc, Pea‐body, MA, USA at 80 kV and images were taken with a digital camera (Ametek rio 9) at magnifications between 3000 and 12000.
Syntheses
2.3
** HXE **─1‐methylimidazole‐2‐carboxaldehyde 4‐ethyl‐3‐thiosemicarbazone (HXE) was synthesized through the base Schiff condensation between 1‐methylimidazole‐2‐carboxaldehyde (0,2212 g, 2.0 mmol) and 4‐ethyl‐3‐thiosemicarbazide (0.2390 g, 2.0 mmol). Both reactants were dissolved in the minimal volume of ethanol and the thiosemicarbazide solution was dropped over the aldehyde. Reaction was catalyzed with HCl, resulting in a white precipitate, which was filtered and washed with cold ethanol. The reactional scheme can be found in Figure S1. White crystals were obtained through the recrystallization of the powder in an 80/20 EtOH/H_2_O mixture.
White powder (C_8_H_14_N_5_SCl; HXE, HCl) Yield: 66%. M.W. = 247.75 g mol^−1^. Elemental analysis: Calculated ‒ C: 38.8%, H: 5.7%, N: 28.3%, S: 12.9%. Experimental ‒ C: 38.7%, H: 5.7%, N: 27.7%, S: 13.1%. Main IR bands (ATR, cm^−1^): ν(N‒H) 3213, 3162; ν(C = N)azomethine 1607; ν(C = S) 805 (Figure S2).
^1^H NMR (DMSO‐d 6; ppm): 1.18 (t, 3H), 3.60 (m, 2H), 3.88 (s, 3H), 7.73 (d, 1H, ^3^ J = 1.9 Hz), 7.76 (d, 1H, ^3^ J = 1.9 Hz), 8.01 (d, 1H), 9.28 (t, 1H), 12.14 (s, 1H).
** [Cu(XE)Cl] ** ─ 0.2 mmol of ligand and CuSO_4_ were solubilized in the least necessary volume of a mixture 80/20 EtOH/H_2_O. HXE solution, which showed an initial pH of 6, was adjusted to pH 8 and then dropwise added to the Cu^2+^ solution. The system was kept under stirring at 50°C for 1 h, resulting in a dark green solution with a green precipitate. The precipitate was separated by filtration and washed with cold ethanol. Part of the powder was then resolubilized in 80/20 EtOH/H_2_O and the solution was kept at room temperature for slow evaporation. Green needle crystals were obtained after two weeks.
Green powder (C_8_H_12_ClCuN_5_S). Yield: 28%. M.W. = 309.29 g mol^−1^. Main IR bands (ATR, cm^−1^): ν(N‒H) 3324; ν(C = N) azomethine 1618; ν(C = S) 708 (Figure S2).
X‐Ray Diffraction
2.4
Omega scans were performed for data collection. An empirical absorption correction was applied and the structures were solved by intrinsic phasing method (ShelXT) [84]. All nonhydrogen atoms were refined anisotropically by means of least‐squares procedures on F^2^ with ShelXL. All the hydrogen atoms were refined isotropically at calculated positions using a riding model, except for the N‐bound hydrogen atoms, which were located in different Fourier maps and refined freely. Deposition Numbers <url href = “https://www.ccdc.cam.ac.uk/services/structures?id = https://doi.org/10.1002/chem.202502754”> 2477871 (for HXE) and 2477872 {for [Cu(XE)Cl]}</url> contain the supplementary crystallographic data for this paper. These data are provided free of charge by the joint Cambridge Crystallographic Data Centre and Fachinformationszentrum Karlsruhe <url href = “http://www.ccdc.cam.ac.uk/structures”>Access Structures service</url>.
In Silico Calculations
2.5
Some pharmacological parameters such as cLog P, cLog S, PSA, Druglikeness, and Drug Score were calculated for HXE using Osiris Property Explorer: DataWarrior, software freely available for download at http://www.organic‐chemistry.org/prog/peo/.
Toxicity Against HT‐22 Cells
2.6
** Cell Culture and Experimental Design **─HT‐22 cells (mouse hippocampal neuronal cell line) were cultured in Dulbecco's Modified Eagle's Medium (DMEM; Sigma‐Aldrich, D7777) supplemented with 10% fetal bovine serum (FBS; CRIPION, São Paulo, Brazil) and 100 IU mL^−1^ penicillin/streptomycin (Sigma‐Aldrich, P0781). Cells were maintained at 37 °C in a humidified atmosphere containing 5% CO_2_ and 95% air. HT‐22 cells were seeded at a density of 2 × 10⁴ cells cm^−2^ [85]. After 24 h, the cells were treated with HXE at concentrations of 5, 10, 20, 50, 100, or 200 µM for an additional 24 h.
** Cell Viability Assay **─Cell viability was assessed using the 3‐(4,5‐dimethylthiazol‐2‐yl)‐2,5‐diphenyltetrazolium bromide (MTT) assay [86]. After 24 h of exposure, neuronal cells were incubated with 0.5 mg mL^−1^ MTT (Sigma‐Aldrich) for 3 h at 37°C in a 5% CO_2_ atmosphere. Experiments were carried out in 96‐well plates, and the formazan crystals formed by the reduction of MTT were dissolved in DMSO. Formazan absorbance was measured at a wavelength of 540 nm. Results are expressed as the percentage of control cells [85, 86]. Statistical analysis was performed using one‐way ANOVA test.
Potentiometric Titrations
2.7
Stock solutions of CuCl_2_ and ZnCl_2_ were prepared from analytical grade reagents and their concentrations were checked gravimetrically via the precipitation of oxinates. The other stock solutions (KOH, HCl, KCl, potassium hydrogen phthalate) were also prepared from analytical grade reagents.
The concentration and the deprotonation constants of the ligand and the stability of the Cu^2+^ and Zn^2+^ complexes were determined by pH‐metric titration at 298.0 ± 0.1 K and at a constant ionic strength of 0.2 M KCl. All potentiometric measurements were carried out in 3.00 mL aqueous samples at 2 mM ligand concentration with a metal(II) ion‐to‐ligand ratio of 1:1. Titrations were performed using carbonate free stock solution of potassium hydroxide of accurately known concentration. During the experiments, argon was bubbled through the samples to ensure the absence of oxygen and carbon dioxide. The samples were stirred by a VELP Scientific magnetic stirrer. The recorded pH readings were converted to hydrogen ion concentration as described by Irving et al. [87]. Protonation constants of HXE and overall stability (log β pqr) constants of complexes were calculated by means of the general computational programs SUPERQUAD and PSEQUAD [88, 89], based on Equations (1) and (2):
The concentration distribution curves were generated by the MEDUSA program using the protonation constants of the ligand and the stability constants of the Cu^2+^ and Zn^2+^ complexes at the same reactant concentrations as in the titrations [90].
UV‐Vis Titrations With Cu2+ and Zn2+
2.8
HXE solution was diluted with Milli‐Q to achieve a final concentration of 50 µM in HEPES (50 mM, pH 7.4). Substoichiometric (about 0.2 equiv. per HXE) ratio of Cu^2+^ or Zn^2+^ solutions were added to the ligand solution and the electronic absorption spectra were recorded after each addition. The apparent affinity constant (K app—in a buffered solution pH 7.4) for Zn^2+^ was determined according to Table 1 and Equation (5):
Competition Assays
2.9
The affinity of the ligand for Cu^+^ and Cu^2+^ was determined by competition assays monitored by UV‐Vis spectroscopy, aiming to estimate the conditional affinity constants (K cond), in which the effects of the buffer are neglected.
** *Affinity for Cu^2+^ * **─Mixtures of [Cu(XE)(H_2_O)]^+^ and the GGH peptide were prepared in a 50 mM HEPES pH 7.4 solution in a 96 wells plate, in triplicate, and the UV‐Vis spectra of the samples were acquired with an interval of 15 min. The experiment was performed by the addition of different equivalents of GGH to the [Cu(XE)(H_2_O)]^+^ solution. After the equilibrium shown in Equation (6) was reached, the progression of the reaction (i.e., α = [Cu(GGH)]/[Cu^2+^]0) was determined using the absorbance at 383 nm, related to the complex [Cu(XE)(H_2_O)]^+^, as demonstrated in Equation (7). Due to the presence of an excess of ligand in solution, the absence of free Cu^2+^ is assumed. The contribution of a ternary [Cu(XE)(Im_GGH_)]^+^ complex was not considered in the fitting model. Given that the experimental data were well described by including only the two binary species, we supposed that the formation of the ternary complex does not significantly impact the estimation of the affinity constant. OBS.: throughout the manuscript, for the ternary species involving GGH or Aβ, we consider the net charge of Im rather than those of the peptides themselves for matter of simplicity.
The ratio between the conditional affinity of HXE and GGH for Cu^2+^ was calculated by fitting the experimental data with Equation (10) (Origin Software), where [Cu^2+^]0 = C_0_, [HXE]0 = C_1_, [GGH]0 = C_2_ and β is the stability constant for [Cu(XE)(H_2_O)]^+^.
** *Affinity for Cu^+^ * ** ─ Competition experiment between [Cu(BCA)2]^3‒^ and HXE was performed anaerobically in a 50 mM HEPES pH 7.4 solution by varying the concentration of HXE added. Solution of [Cu(BCA)2]^3‒^ was prepared inside the glove box and one equivalent of Na_2_S_2_O_4_ was used to avoid oxidation of the metal. HXE was then added with a Hamilton syringe into the sealed cuvette equipped with a screw cap. The apparent affinity constant for [Cu(XE)(H_2_O)] was determined by solving Equation (17) for each C_2_ value, where [Cu^+^]0 = C_0_, [BCA]0 = C_1,_ [HXE]0 = C_2_, and β_2_ is the stability constant for [Cu(BCA)2]^3‒^. The value reported corresponds to the mean and standard deviation between the different points.
Cyclic Voltammetry Assays
2.10
A 50 mM HEPES pH 7.4 solution was used as the electrolyte solution in all experiments. Experiments were conducted under argon atmosphere, toward the reductive potential, with the initial potential of 0 mV and using 0.1 V s^−1^ as scan rate. All potentials cited in this work will be given as function of the SCE.
Copper Removal From Aβ
2.11
UV‐Vis *─Spectra of the ternary systems HXE, Cu^2+^ and Aβ_16_/Imidazole (Im) were measured after the addition of 1.2 equivalent of HXE to a solution containing 1 equivalent of Cu^2+^ and 1.2 equivalents of Aβ_16_ peptide or 6.0 equivalents of Im. Experiments were performed in a 50 mM HEPES pH 7.4 solution. A Savitzky‐Golay smoothing was applied using a window of 50 points to reduce noise.
EPR *─Samples were prepared in a 50 mM HEPES pH 7.4 solution with 10% glycerol to prevent the crystallization of the solvent and 1% DMSO to prevent precipitation in the lower temperature required for the experiment. Mixtures were made in 1500 µL falcon tubes, with a final concentration of ^65^Cu^2+^ of 500 µM. Different equivalents of HXE and/or Aβ peptide and/or Im were also added. Solutions were transferred to EPR quartz tubes and frozen in liquid nitrogen (77 K).
** NMR **─Samples were prepared in an Ar‐saturated glove box in phosphate buffer (200 mM, pH 7.4 in D_2_O). Aβ_16_ (500 µM in D_2_O) was first mixed with 2 eq. of Na_2_S_2_O_4_ (1 mM in D_2_O) and [Cu(CH_3_CN)4]BF_4_ (490 µM in CD_3_CN, 3% of the final volume) in a Eppendorf tube. HXE (500 µM, in D_2_O) was then added to the Eppendorf tube and 600 µL of the solution was added to an NMR tube with J Young valve.
Ascorbate Consumption Assay
2.12
The consumption of ascorbate (Asc) in the presence of Cu was monitored by UV‐Vis. It mirrors the production of ROS in solution, as reported previously [56, 65]. Intensity of the Asc absorption band at λ = 265 nm (ε = 14500 L mol^−1^ cm^−1^) was monitored as a function of time, with the background signal at λ = 800 nm subtracted. Experiments with different concentrations of ligand, Zn and Aβ_16_ or imidazole (Im) were performed with a final concentration in the cuvette of: [Asc] = 100 µM, [Aβ_16_] = 0 or 12 µM, [Im] = 60 µM, [Cu^2+^] = 10 µM, [Zn^2+^] = 0, 12 or 120 µM, [HXE] = 0, 12 or 60 µM and [HEPES] = 100 mM, pH 7.4. Cu^2+^ is added to the solution of Asc (and peptide) generating Cu^+^. The ligand is then added afterward the addition of Cu^2^⁺, when absorbance reaches nearly 1 [55, 57, 91]. The Asc consumption rate was estimated from the slope of the plot of Asc concentration (determined by the ratio between the absorbance at 265 nm and the molar absorptivity, ε = 14500 M^−^ ^1^ cm^−^ ^1^) versus time (in seconds), using the first 300 s following ligand addition.
HO• Production Mediated by Copper
2.13
Coumarin‐3‐carboxylic acid (3‐CCA) was used as a probe to detect HO^•^, since the interaction of these leads to the formation of 7‐hydroxy‐coumarin‐3‐carboxylic acid (7‐OH‐CCA), which is fluorescent at 452 nm upon excitation at 395 nm. Fluorescence experiments were performed in a 96 wells plate at 25°C. The reaction was started with the addition of 20 µL of a 5 mM aqueous solution of Asc into a 50 mM phosphate buffer pH 7.4 solution containing 3‐CCA (0.5 mM), HXE (12 µM), Aβ_16_ (12 µM), Zn^2+^ (12 µM), and Cu^2+^ (10 µM), to a final volume of 200 µL. The fluorescence was monitored with a 3 min interval during 90 min. Four replicates of each condition were added in the plate.
Aggregation Kinetics of Aβ40
2.14
Stock solutions of CuSO_4_ and ZnSO_4_ (0.3 mM, Milli‐Q), HXE (0.1 mM, Milli‐Q), ThT (250 µM, Milli‐Q), and Aβ_40_ (dilution of the monomerized peptide solution with Milli‐Q water to a final concentration of 40 µM) were prepared. Self‐assembly of Aβ_40_ in HEPES buffer pH 7.4 in the absence and presence of Cu or Zn and HXE was followed by the fluorescence of ThT‒(λ ex = 440 nm, λ em = 490 nm). ThT fluorescence increase can be considered a sigmoid curve described by Equation (18), where F_0_ and F max are the initial and maximum fluorescence intensity, respectively, and 𝑘 is the growth rate. t 1/2 is defined as the time at which the fluorescence intensity reaches half of its maximum value.
The experiments were performed at 37°C and with stirring at 200 rpm (double orbital) during 15 s before each cycle (10 min) in a 384 wells plate. The reactant addition was performed in the same order as listed here to achieve a final concentration of: [HEPES] = 100 mM, [EDTA] = 20 nM, [ThT] = 10 µM, [HXE] = 0 or 20 µM, [Aβ_40_] = 20 µM and [Cu] = [Zn] = 0 or 18 µM. Each condition was reproduced into six different wells. To ensure the reproducibility of the impact of HXE in the peptide self‐assembly, the experiment was performed four times.
Transmission Electron Microscopy (TEM)
2.15
Samples from different conditions were collected from 384‐well plates after the ThT assays reached the fluorescence plateau (after approximately 2 days) and diluted 4 times. Formvar‐coated grids (Delta Microscopies, France) were then prepared for microscopy using a conventional negative staining method. 5 µL drop of sample was placed on the grid for 1 min, blotted and then stained with 3 µL uranyl acetate (1%) for 1 min. The grids were then mounted and examined in a TEM. The images were then processed using GATAN software.
Results and Discussion
3
Syntheses and Characterization
3.1
HXE was synthetized as described in the experimental section, resulting in the precipitation of a white powder during the synthesis, corresponding to the hydrochloride form of the ligand, HXE, HCl. After solubilization of this powder in an 80/20 EtOH/H_2_O mixture and slow evaporation of the solvent, white needle crystals were isolated. The protonation of the imidazole nitrogen occurs due to the acid catalysis used in the synthesis (see Figure S1). HXE, HCl crystalizes in the monoclinic system, space group P2_1_/c and with four molecules and four chloride ions per unit cell. The structure of HXE, HCl is shown in Figure 2. An (E)‐configuration regarding the C5═N3 bond and syn conformation around the N4‒C6 are observed. The main crystal, data collection, and refinement parameters are given in Table S1, and some relevant bond distances and angles are reported in Table S2. The crystal network is stabilized through nonconventional hydrogen bonds involving the chloride ions, N2‒H and N5‒H from an HXE unit, as well as N4’‒H from a second thiosemicarbazone unit. The geometric parameters associated to such interactions are listed in Table S3. No other interaction between the protonated, cationic HXE, HCl units, as for example π‐π stacking, is observed (Figure S3).
Ellipsoid plot of HXE, HCl. Ellipsoids drawn at 50% probability level.
In solution, HXE can undergo a tautomeric equilibrium between thioamido and thioiminol forms (Figure 3), which provides a partial double bond character to the C6─N4 bond, restricting free rotation around it. Consequently, in addition to the classic geometric isomerism (E)‐ and (Z)‐ around the C5═N3 bond, HXE can also be described in terms of anti and syn conformations, according to the relative orientation between C6─S1 and N4─H bonds, which can be pointing to opposite sides or to the same side in the plane defined by the atoms H–N4─C6─S1 (Figure 4).
Equilibrium between the thioamide and thioiminol tautomers of HXE.
Possible (E)/(Z) isomers and syn/anti conformers of HXE.
To characterize the ligand in solution, ^1^H NMR in DMSO‐d 6 was performed, where two sets of signals were observed, corresponding, respectively, to 97% and 3% of the total amount of HXE (Figure S4). The major isomer was assigned as the (E)‐isomer and the minor one, as the (Z)‐isomer, based on the chemical shifts of the N4 proton, which appears at 12.14 and 13.42 ppm, respectively. This assignment is consistent with previous reports from our research group and the literature [61, 92, 93, 94, 95]. A NOESY experiment allowed the attribution of the major species as the (E)‐anti isomer (Figure S5). By the ^1^H spectrum, it is also possible to conclude that the ligand was obtained with a high purity.
The stability of HXE in a buffered solution (50 mM HEPES pH 7.4) was followed for 24 h by UV‐Vis in order to evaluate possible hydrolysis of the C5─N3 bond. HXE shows a single intra‐ligand transition at 324 nm (ε = 3.17 ± 0.05 × 10^4^ M^−1^ cm^−1^), which did not show any absorbance change during the experiment (data not shown), indicating the high stability of this ligand toward hydrolysis in an aqueous buffered solution at pH 7.4. This result is in accordance with the behavior observed for other methyl‐imidazole containing ligands previously studied by our group [65, 67, 69].
Protonation constants of the ligand were determined by potentiometric titration in aqueous solution (I = 0.2 M, 25°C). HXE, HCl shows two deprotonation sites. The most acidic one can be assigned to the protonated methylimidazole group (i.e., H_2_XE ^+^ → HXE + H^+^, pK a = 5.42), while the higher pK a value is related to deprotonation of the thioamide group at N4 (HXE → XE ^‒^ + H^+^, pK a = 11.09). Therefore, at physiological pH, the ligand is in its neutral HXE form, being this the main species between pH 6 and 11 (Figure 5).
Species distribution curves of the thiosemicarbazonic ligand HXE as a function of pH. Experimental conditions: I (KCl) = 0.2 M, T = 298 K, and [HXE] = 2.0 mM.
Pharmacological Parameters and Toxicity
3.2
In silico, calculations of pharmacological parameters can be a useful tool to predict the bioavailability and permeability of new compounds. All the calculated parameters for HXE (Table 2) showed values in agreement with the expected range for drugs that aim to act in the CNS, according to Lipinski's rules [96].
Furthermore, HXE toxicity was evaluated in HT‐22 cells. In that case, exposure to up to 200 µM of ligand did not affect the viability of the hippocampal neuronal cell line, as assessed by the MTT assay [F(6, 27) = 1,284, p = 0.2976] (Figure S6).
Binary Systems Between HXE and Cu+/Cu2+ or Zn2+ Ions
3.3
The interaction between HXE and Cu^+^/Cu^2+^ or Zn^2+^ were investigated in the solid state for Cu^2^⁺ and in solution for the three ions, in order to assess their binding modes and affinities. In this context, [Cu(XE)(H_2_O)]^+^, [Cu(XE)(H_2_O)], and [Zn(XE)(H_2_O)x]^+^ refer to the complexes formed in situ by mixing a ligand solution with the respective metal ions (M = Cu^2^⁺, Cu⁺, or Zn^2^⁺) at neutral pH. Note that for Cu^+^, we employ the [Cu(XE)(H_2_O)] notation for the sake of simplicity, but there is no data about its symmetry or showing that Cu^+^ induce the deprotonation of XE, in contrast to Cu^2+^ and Zn^2+^ (see below).
We were able to isolate a monocrystal of the 1:1 complex, [Cu(XE)Cl], allowing the complete characterization of its structure in the solid state. The main crystal, data collection, and refinement parameters for [Cu(XE)Cl] are given in Table S4. The complex adopts a square‐planar geometry (τ_4_ = 0.14) [102], in which the fully deprotonated form of the (E)‐anti ligand binds to Cu^2+^ via the methylimidazole and thiosemicarbazone moieties (N2, N3, and S1). This indicates that Cu^2+^ binding induces deprotonation of HXE, which is coordinated in its thioiminolate form. The coordination sphere of Cu^2+^ is completed by a chloride ion (Figure 6), resulting in the neutral complex [Cu(XE)Cl]. It is worth noting that the binding of the chloro ligand is expected not to be kept in aqueous solution, where a water ligand will replace it in line with much higher concentration. Bond distances and angles around the metal center can be seen in Table S5. The decrease in the N4─C6 bond length and increase of C6‒S1 is in full accordance with electron delocalization due to deprotonation of N4 (thioiminolate coordination).
Ellipsoid plot of [Cu(XE)Cl]. Ellipsoids drawn at 50% probability level.
The formation of HXE‐based complexes in the presence of equimolar amounts of Cu^2+^ and Zn^2+^ ions was further studied in aqueous solution by potentiometry. The stability constants calculated are listed in Table 3, in which the protonation constants of the ligand were included for comparison. The best fits (Figure S7) for the titration data were obtained for complex species ML^+^ and MLH_‒1_ for Cu^2+^ and MLH^2+^, ML^+^, and MLH_‒1_ for Zn^2+^. Simulated species distribution curves for a metal:ligand ratio of 1:1 are shown in Figure 7.
Species distribution curves of complexes formed in (A) 1:1 Cu2+:HXE and (B) 1:1 Zn2+:HXE system as a function of pH. Simulation conditions: [HXE] = 50 µM, [Cu2+] = [Zn2+] = 50 µM.
For Cu^2+^, the species ML^+^, [Cu(XE)(H_2_O)]^+^, in which the ligand is already fully deprotonated, starts to be formed below pH 3, dominates between pH 3 and ∼9, and lasts until pH 10 (Figure 4A). This is, by far (>95%), the main complex present at physiological pH. Deprotonation of the equatorial coordinated water, leading to the neutral hydroxo complex MLH_‒1_, [Cu(XE)(OH)], occurs at a higher pH: pK a [Cu( ** XE ** )(H2O)] ^+^ /[Cu( ** XE ** )(OH)] = 8.89. It is worth noting that the CuL species formed from HXE is 3 orders of magnitude more stable (15.47 vs. 12.49) than the corresponding one formed by the similar, tridentate (N_2_O‐donor) 1‐methylimidazole‐containing N‐acylhidrazonic ligand HX1Diox [65], stressing the importance of the sulfur atom in the thiosemicarbazone HXE (which is a N_2_S‐donor) for the stabilization of the Cu^2+^ complex.
Different from Cu^2+^, the formation of Zn^2+^ complexes only starts at pH around 5 (Figure 4B). In more acidic solutions, the aquo complex [Zn(H_2_O)6]^2+^ is virtually the unique Zn^2+^ existing form. MLH^2+^ is only marginally present. ML^+^ species [Zn(XE)(H_2_O)x]^+^, on the other hand, dominates between pH 6.7 and 8.2, peaks at pH 7.5 (65%) and lasts until pH 9.5. By increasing the pH, deprotonation of a coordinated water molecule also occurs near pH 8.2, leading to the formation of the hydroxo complex [Zn(XE)(OH)], in which coordinated water molecules were excluded for the sake of simplicity, starting at around pH 7. This species becomes predominant from pH 8.2 on. It is interesting to observe that the deprotonation of [Zn(XE)(H_2_O)x]^+^ occurs at a lower pH than that of [Cu(XE)(H_2_O)]^+^, which would not be expected based on the HSAB principle. However, although Cu^2+^ is usually considered a slightly stronger Lewis's acid than Zn^2+^, this property is dependent on the coordination geometry and also on the nature of ligands. Mareque‐Rivas et al., for example, reported pK a values ranging from 7.74 to 5.99 for coordinated water in a series of zinc(II) complexes containing ligands derived from tpa [tris(pyridylmethyl)amine] [103]. Moreover, Zn^2+^ forms more stable complexes with softer donors (as HXE) than with the harder ones, and this may affect the ability of coordinated water to undergo deprotonation.
The spectroscopic profile of the ligand and its Cu^2+^ and Zn^2+^ complexes formed in situ at pH 7.4 were investigated through UV‐Vis (Figure 8). Upon coordination with one equivalent of either Cu^2+^ or Zn^2+^, the intra‐ligand band of HXE at 324 nm decreases in intensity, and a new LMCT band emerges at 383 nm and 362 nm, respectively. The maximum absorption wavelengths, molar absorptivities, and the corresponding transition assignments for HXE and its Cu^2^⁺ and Zn^2^⁺ complexes are summarized in Table 4.
UV‐Vis spectra of HXE and its Cu2+ and Zn2+ complexes. [HXE] = [Cu2+] = 50 µM, [Zn2+] = 250 µM in 50 mM HEPES pH 7.4.
HXE and [Cu(XE)(H_2_O)]^+^ were also electrochemically evaluated in a buffered solution pH 7.4 (Figure 9). HXE shows a weak reduction process around ‐250 mV (vs. SCE). With the addition of Cu^2+^, a process displaying E pa = +90 mV and E pc = ‒270 mV is observed, in which peak‐to‐peak separation indicates electrochemical irreversibility. When compared with “free” Cu^2+^ in buffer, an increase in ∆E due to the coordination of HXE is observed, going from approximately 93 in “free copper” to 360 mV in the complex, showing that the ligand makes the redox cycle between Cu^2+/+^ sluggish. The increase in the scan rate (Figure S8A) causes an increase in the separation between the anodic and cathodic peaks (ΔE), which depends linearly on the square root of the scan rate (Figure S8B), indicating a diffusion controlled process [104]. The irreversibility of the process may originate from different geometries between Cu^2+^ and Cu^+^ bound to HXE.
(A) Voltammograms of free Cu2+ (black dotted line), [Cu(XE)(H2O)]+ (light blue line) and HXE (black line) in 50 mM HEPES pH 7.4 with a scan rate of 100 mV s−1. Electrodes: glassy carbon (WE) platinum wire (CE), and saturated calomel electrode (RE).
UV‐Vis titrations of Cu^2+^ and Zn^2+^ over a HXE solution were performed in order to confirm the stoichiometry and apparent affinity of the complex formed in situ at physiological pH (log K app) and deduce the selectivity of the ligand. The electronic spectra for both metal ions are shown in Figure 10. The complexation of the metal ions can be followed by the appearance of the LMCT band centered at 383 nm (ε = 13680 M^−1^ cm^−1^) for Cu^2+^ and 362 nm (ε = 19690 M^−1^ cm^−1^) for Zn^2+^. For both metal ions, the formation of 1:1 complexes under these conditions is observed (see inset in Figure 10). For Cu^2+^, the concentration range used for the experiments does not allow to have an equilibrated reaction and, thus, the affinity cannot be determined. In contrast, the apparent affinity for Zn^2+^ could be evaluated as described in the methodology section (Figure S9), obtaining log K app {[Zn(XE)(H_2_O)x]^+^} = 5.0 ± 0.1.
UV‐Vis spectra of HXE solution after the addition of increasing amounts of (A) Cu2+ and (B) Zn2+. [HXE] = 50 µM in 50 mM HEPES pH 7.4.
To determine the conditional affinity of HXE for Cu^2+^ ions at pH 7.4, competition assay was performed using the well‐known ATCUN (Amino‐Terminal Cu and Ni binding motif) peptide GGH [105, 106, 107]. This peptide binds Cu^2+^ with a square planar geometry through four nitrogen atoms (the terminal amine, the N^δ^ of the Im ring of histidine at the third position and the two deprotonated amides in peptide backbone in between) [107, 108]. A value of 12.7 for log K GGH‐Cu was determined by Noormägi et al. using competition with HSA and monitored by LC‐ICP‐MS [109]. This value is consistent with the binding constant previously determined by a thorough potentiometric study, showing a value of 12.215 ± 0.001 at pH 7.4 but for the nonamidated GGH peptide [110]. Our experimental design involved the addition of different GGH equivalents to a buffered [Cu(XE)(H_2_O)]^+^ solution (pH 7.4). Progression of the reaction, that is [Cu(GGH)]/C_0_, was determined by the disappearance of the absorbance at 383 nm relative to [Cu(XE)(H_2_O)]^+^ complex. Equilibrium was reached after 180 min (Figure S10). The spectra resulting of successive additions of competitor are shown in Figure 11. Progression of the reaction for each mixture was then plotted in function of the number of equivalents of peptide and the experimental data was fitted using the respective quadratic equation to determine the stability constant of [Cu(XE)(H_2_O)]^+^, obtaining log K cond = 12.3 ± 0.1.
(A) Selected UV‐Vis spectra of a solution of [Cu(XE)(H2O)]+ with the addition of different equivalents of GGH. (B) Progression of Cu(GGH) formation as a function of the number of equivalents of competitor and theoretical curve (best fit). Mean and standard variation between the replicates are shown. [HXE] = 50 µM, [Cu2+] = 45 µM in 50 mM HEPES pH 7.4.
For both Cu^2+^ and Zn^2+^, the apparent and conditional affinity constants determined by direct titration and competition experiments, respectively, are in agreement with those deduced from the potentiometric titration (11.8 and 5.4, respectively, at pH 7.4).
To estimate the affinity of HXE toward Cu^+^, competition with the well‐known BCA ligand was performed. BCA forms an ML_2_ complex with Cu^+^, with an affinity of log β_2_ = 14.7 or 17.2 [111, 112]. With the addition of HXE, a decrease in the characteristic absorption at 562 nm, related to [Cu(BCA)2]^3‒^, is observed (Figure S11). Absorbance at this wavelength was used to calculate the percentual of Cu^+^ that remains bound to BCA. The apparent stability of [Cu(XE)(H_2_O)] could be determined as described in Equation (17), resulting in a value of log K app = 8.7 ± 0.1 or 11.2 ± 0.1, based on either affinity values reported for the BCA complex.
All affinity constants determined for HXE in this work and the ones found in the literature for Aβ are summarized in Table 5. Since the values reported in literature for the BCA competitor differ (log β_2_ = 14.7 or 17.2), the resulting affinities of HXE or Aβ change accordingly. Hence, to directly compare the Cu^+^ affinity for HXE and Aβ, either reference value (14.7 or 17.2) was used. This leads to the same difference of Cu^+^ affinity between them, id est, between one and two orders of magnitude (8.7 vs. 6.9, and 11.2 vs. 10). On the other hand, HXE has an affinity for Cu^2+^ approximately 100–1000 times greater than that of Aβ. With respect to selectivity [s = K app (M)/K app (Zn^2+^), where M = Cu^2+^ or Cu^+^], the Cu^2+^ versus Zn^2+^ selectivity of HXE is about 1000 times higher and the Cu^+^ versus Zn^2+^ selectivity is about 100 times higher compared to the peptide.
Based on the evaluated affinity values, the HXE ligand is expected to remove Cu^+^ and Cu^2+^, but not Zn^2+^ from the corresponding Aβ complexes. It is worth noting that, for both oxidative states of copper, HXE is not expected to effectively compete for the metal ion against their main biological transporters: HSA, in the case of Cu^2^⁺ (K d ∼ 10^−13^ M) [110], and Ctr1, in the case of Cu^+^ (K d ∼ 10^−14^ M) [116].
Copper Removal From Aβ16 by HXE
3.4
Once the affinity of HXE for metal ions was evaluated, the ability of the ligand to abstract the metal ion from Aβ peptide was directly studied by UV‐Vis and EPR for Cu^2+^ (Figure 12A, 12B). By UV‐Vis, both Cu^2+^(Aβ_16_) and [Cu(XE)(H_2_O)]^+^ show a d‐d band centered at ∼630 nm. The addition of HXE to a Cu^2+^(Aβ) solution results in a shift of this band to ∼595 nm, which could suggest the formation of a ternary complex. EPR spectra of HXE added to Cu^2+^(Aβ_16_) shows a different profile when compared to the complexes of reference, with the total disappearance of Cu^2+^(Aβ_16_) signatures and the appearance of a new signature close to those observed for the [Cu(XE)(H_2_O)]^+^ species, but meaningfully different. Hence, the formation of the ternary species [Cu(XE)(Im_Aβ_)]^+^ is inferred. To confirm the formation of a ternary complex in which the equatorial coordination of [Cu(XE)(H_2_O)]^+^ is completed by an Im ring from one of the His residues of Aβ, further experiments were performed using Im in the place of the peptide. In that case, through both techniques, similar behaviors were observed (Figure 12C, 12D), confirming the formation of a ternary complex under the experimental conditions used. The spectroscopy parameters for all the species mentioned above are summarized in Table 6. Proposed structure for [Cu(XE)(Im_Aβ_)]^+^ is shown in Figure S12.
Comparison of UV‐Vis and low‐temperature (120 K) X‐band EPR spectra of [Cu(XE)(ImAβ)]+ with the binary systems (A and B, respectively) and with the ternary system [Cu(XE)(Im)]+ (C and D) at pH 7.4.UV‐Vis: [HXE] = [Aβ] = 60 µM, [Im] = 300 µM, [Cu2+] = 50 µM in 50 mM HEPES pH 7.4.EPR: [HXE] = [Aβ] = 600 µM, [Im] = 3000 µM, [65Cu] = 500 µM in 50 mM HEPES pH 7.4 1% DMSO 10% glycerol.
Competition for Cu⁺ between Aβ_16_ and HXE was monitored by ^1^H NMR (Figure 13). As previously described [28, 56, 117, 118], Cu⁺ coordination to Aβ_16_ induces a clear de‐shielding of the histidine proton signals involved in metal binding (observed at ∼ 6.85, 6.92, and 7.72 ppm for the apo‐peptide). However, upon addition of 1 equivalent of HXE, the position of the signals corresponding to the apo‐Aβ_16_ are fully restored.
1H NMR spectra of Aβ16 (yellow), Cu+(Aβ16) (grey) and Cu+(Aβ16) + HXE (blue).
[Aβ_16_] = [HXE] = 500 µM, [Cu^+^] = 490 µM in 200 mM phosphate buffer pH 7.4 97% D_2_O 3% ACN‐d 3 in the presence of 2 equivalents of sodium dithionite.
Solutions were prepared anaerobically in an argon purged glove box.
These results highlight HXE efficiency in preventing Cu(Aβ) interactions, fully removing Cu^+^ from the peptide and, instead, forming a ternary [Cu(XE)(Im_Aβ_)]^+^ complex with Cu^2+^, indicating a potential ability to mitigate Cu‐induced Aβ toxicity.
ROS Production in the Presence of HXE
3.5
Oxidation of Asc by Cu^2+^ or Cu(Aβ_16_) leads to the formation of Cu^+^ in solution, which, in aerobic conditions, acts as a catalyst in the formation of ROS through the stepwise and incomplete reduction of dioxygen. Thus, the loss of the characteristic Asc absorption at 265 nm has been widely used to mirror the production of ROS mediated by Cu^2+^ or Cu(Aβ_16_) and to assess the ability of ligands to prevent this process [28, 46, 55, 56, 60, 65, 67, 91, 119, 120, 121, 122]. In the presence of Aβ and copper, the total consumption of Asc (initially at 100 µM) occurs after approximately 1500 s after the addition of the metal ion (Figure 14A—grey dotted curve) [56]. Herein, HXE was added to an ongoing Asc consumption reaction, when the absorbance was equal to 1. With the addition of 1 equivalent of HXE into this system, a significant decrease in the rate of Asc consumption is observed, resulting in a 10‐fold slower ROS production. (Figure 14A—dark blue curve).
(A) Ascorbate consumption for: Cu(Aβ16) (grey dotted curve), [Cu(XE)(H2O)]+ (light blue curve), Cu(Aβ16) + 1 equivalent HXE (dark blue curve) and Cu(Aβ16) + 10 equivalents Zn2+ + 1 equivalent HXE (red curve). Ascorbate is first added, then the Aβ peptide, and the metal ions. HXE is added when the absorbance reaches about 1.0. [HXE] = [Aβ16] = 12 µM, [Cu2+] = 10 µM, [Zn2+] = 120 µM, [Asc] = 100 µM in 100 mM HEPES pH 7.4. (B) Fluorescence curve of the formation of 7‐OH‐CCA induced by Cu2+. (a) Control – 3‐CCA + Asc, (b) Cu, (c) Cu(Aβ16), (d) Cu(Aβ16) + Zn2+, (e) [Cu(XE)(H2O)]+, (f) Cu(Aβ16) + HXE and (g) Cu(Aβ16) + Zn2+ + HXE. [HXE] = [Aβ16] = [Zn2+] = 12 µM, [Cu2+] = 10 µM, [Asc] = 500 µM, [3‐CCA] = 500 µM in 50 mM phosphate buffer pH 7.4.
It is worth noting that, in the experiment performed in the absence of Aβ (Figure 14A—light blue curve), the same rate of Asc consumption is observed, in line with the previously observed complete Cu^+^ removal form Aβ. In addition, this rate is much lower than that of “free copper” (about 20x faster than for the complex [Cu(XE)(H_2_O)]^+^). This agrees with a much more sluggish redox process of copper when bound to HXE, as previously detected by cyclic voltammetry. In the case of Cu^2+^, that is present at some extent in the medium, the rate of Asc consumption was similar in the absence or presence of Aβ, indicating that the ternary species [Cu(XE)(Im_Aβ_)]^+^ characterized by UV‐Vis and EPR has the same ability to consume Asc than [Cu(XE)(H_2_O)]^+^ and/or that the concentration of the ternary species in the Asc consumption experiments is too low to have an impact in the ROS generation process. Based on the fact that the ternary species was still detected by UV‐Vis at 20 µM concentration (Figure S13), the first hypothesis is preferred.
The experiment was also performed in the presence of 10 equivalents of zinc ions as a competitor for the ligand (Figure 14A—red curve). In this case, an increase in the rate of Asc consumption is observed, nearly twice as fast as in the absence of Zn^2^⁺, although still significantly slower than the control containing only Cu(Aβ_16_).
Furthermore, the generation of hydroxyl radicals (HO^•^) mediated by copper was indirectly monitored by the formation of the fluorescent product 7‐OH‐CCA over time in the presence of the metal ion, 3‐CCA and Asc (Figure 14B). In this case, in the presence of 1 equivalent of HXE, a significant decrease in HO^•^ production was observed and neither Aβ nor Zn^2^⁺ affected the HXE ability to lessen HO^•^ formation. These results are entirely consistent with those obtained in the Asc assay, demonstrating that HXE effectively reduces Cu(Aβ_16_)‐induced ROS generation.
Impact of HXE on the Aβ40 Aggregation Modulated by Cu2+ and Zn2+
3.6
Finally, the effect of HXE on the aggregation of Aβ_40_ was evaluated in the absence and presence of Cu^2+^ and Zn^2+^ using ThT as the classical fluorescent reporter, that allows to monitor the kinetics of self‐assembly of the peptide (Figure 15A) [123, 124, 125, 126, 127], and through TEM [67, 128, 129, 130, 131], in order to characterize the morphology of the aggregates (Figure 15B). For the apo‐peptide, a sigmoidal ThT curve is obtained, along with the formation of long and twisted fibrils as observed by TEM. With the addition of HXE on Aβ_40_, no difference in the aggregation kinetics or in the microscopy image is observed, which leads to the hypothesis that the ligand does not interact with the apo‐peptide. The kinetics of Cu^2+^(Aβ_40_) displays a different profile. As already observed in other studies, the presence of 0.9 equivalent of Cu^2+^ promoted a two‐step process with a first rapid and weak ThT fluorescence increase and a second sigmoidal process that occurs later compared to the apo‐Aβ [132, 133, 134]. The decrease in the fluoresce intensity were related to the stabilization of more amorphous aggregates, as also observed in TEM images [23, 24, 26, 135, 136]. The addition of 1 equivalent of HXE on the Cu^2+^(Aβ_40_) system leads to a sigmoidal curve with a similar t_1/2_ as apo‐Aβ but with a level of final ThT fluorescence intensity that is about 40% of that observed for the apo‐Aβ. Additionally, in the presence of HXE, fibrillar aggregates are recovered. This may be related to the formation of a ternary species, [Cu(XE)(Im_Aβ_)]^+^, that was detected by UV‐Vis when using the Aβ_16_ fragment at similar concentration (Figure S13). The formation of the ternary species may leave to Aβ its ability to self‐assemble but to a slightly different morphology with distinct response to ThT. Note that the possibility of having inner‐filter effect has been ruled out based on the low absorptivity of the HXE‐based Cu^2+^ complexes in the dedicated wavelength range. The recovery of the kinetics parameters and fibrillar structure induced by HXE indicates that the ligand can modulate the Cu^2+^(Aβ_40_) aggregation pathway, deflecting it from the generation of soluble oligomeric species, widely described as the most neurotoxic forms, and promoting the formation of mature fibrils, which exhibit reduced cellular toxicity [137].
(A) Average of aggregation kinetic curves and (B) corresponding TEM images of Aβ40 (yellow), Cu2+(Aβ40) (grey), Zn2+(Aβ40) (violet), Aβ40 + HXE (brown), Cu2+(Aβ40) + HXE (blue) and Zn2+(Aβ40) + HXE (pink) in 100 mM HEPES pH 7.4. [Aβ] = [HXE] = 20 µM, [Cu2+/Zn2+] = 18 µM, [ThT] = 10 µM and [EDTA] = 20 nM.
In presence of Zn^2+^, Aβ aggregation data similar to those reported in the literature were obtained, with a rapid nonsigmoidal process [24, 81, 133, 138]. The addition of HXE did not impact Zn^2+^(Aβ_40_) aggregation kinetics or resulting aggregates morphology, in line with a weaker to similar affinity for Zn^2+^ of the HXE versus the Aβ ligands (Table 5).
Kinetic curves of all replicates are shown in Figures S14, S15 and the respective kinetic parameters can be found in Table S6.
Conclusions
4
High extracellular levels of copper have been widely associated with the progression of AD [11]. In particular, the interaction between Cu ions and the Aβ peptide favors the formation of toxic aggregates and the generation of ROS due to the cycling between Cu⁺ and Cu^2^⁺ [27]. In this context, chelating agents have been proposed as a promising therapeutic approach to prevent this interaction [5, 32, 33, 34, 37, 40]. However, to date, no chelating agent has shown significant clinical efficacy [42, 51], with most being designed to specifically target Cu^2+^. In this work, we report the synthesis and characterization, both in the solid state and in solution, of a new 1‐methylimidazole‐containing thiosemicarbazone (HXE). Due to the presence of the biocompatible imidazole group, the compound shows a good solubility in aqueous medium and low toxicity, as demonstrated against HT‐22 mouse hippocampal neuronal cells. In addition, all pharmacokinetic parameters predicted in silico are within the expected values for compounds with the potential to cross the BBB. HXE forms 1:1 complexes in pseudo‐physiological solution with Cu^2+^, Cu^+^, and Zn^2+^, presenting the respective affinity constants of log K app = 12.3, 8.7 and 5.0. These values indicate that the ligand is highly selective for both oxidation states of copper over zinc, a characteristic which is extremely important, given the high concentration of zinc present in the synaptic cleft. HXE has an affinity for Cu^2+^ approximately 100–1000 times greater than that of Aβ. Regarding Cu^+^, the difference is between one and two orders of magnitude in favor of our ligand. HXE is, in fact, very efficient in modulating Cu(Aβ) interactions, fully removing Cu^+^ from the peptide and, instead, forming a ternary [Cu(XE)(Im_Aβ_)]^+^ complex with Cu^2+^. Ternary complexes may be involved in an alternative mechanism of metal passivation, and their formation can be considered, in many respects, desirable. The group of Mi Hee Lim, for example, described ternary complexes of Cu^2+^(Aβ) with bidentate chemical regulators that can specifically modulate Cu‐induced Aβ aggregation [139, 140]. Consistent with the HXE properties demonstrated in this study (Figure 16), the ligand was able to significantly reduce Cu(Aβ)‐mediated ROS production, even in the presence of 10 equivalents of zinc. HXE also restored the half‐time (t_½_) of Cu^2+^(Aβ_40_) aggregation to levels comparable to that of the apo form of the peptide and induced the formation of fibrillar structures typical of those of apo‐Aβ aggregates.
Overview of Cu⁺/Cu2⁺ chelation by HXE and its impact on Aβ(Cu)‐mediated ROS generation.
Together, our results demonstrate that the new thiosemicarbazone HXE presents a promising profile to modulate Cu^+^(Aβ) and Cu^2+^(Aβ) interactions, thus mitigating Cu‐induced Aβ toxicity. In this sense, this work contributes not only to the understanding of the bioinorganic mechanisms of AD, but also to the development of ligands with novel structural motifs and a real therapeutic potential.
Author Contributions
CH, NAR, CE: Conceptualization; BM, CE, CH: Writing, Formal analysis, Investigation, Review & editing; AG, MVC, AB, SML, JO, CK: Writing, Formal analysis, Investigation; NAR, CH: Resources.
Conflicts of Interest
The authors declare no conflict of interest.
Supporting information
Supporting File 1: chem70495‐sup‐0001‐SuppMat.pdf.
The reference list from the paper itself. Each links out to its DOI / PubMed record.
- 1J. Gale , E. Aizenman , “The Physiological and Pathophysiological Roles of Copper in the Nervous System,” European Journal of Neuroscience 60 (2024): 3505–3543.38747014 10.1111/ejn.16370 PMC 11491124 · doi ↗ · pubmed ↗
- 2E. I. Solomon , D. E. Heppner , E. M. Johnston , et al., “Copper Active Sites in Biology,” Chemical Reviews 114 (2014): 3659–3853.24588098 10.1021/cr 400327 t PMC 4040215 · doi ↗ · pubmed ↗
- 3G. Gromadzka , B. Tarnacka , A. Flaga , A. Adamczyk , “Copper Dyshomeostasis in Neurodegenerative Diseases—Therapeutic Implications,” International Journal of Molecular Sciences 21 (2020): 9259.33291628 10.3390/ijms 21239259 PMC 7730516 · doi ↗ · pubmed ↗
- 4S. Lutsenko , S. Roy , P. Tsvetkov , “Mammalian Copper homeostasis: Physiological Roles and Molecular Mechanisms,” Physiological Reviews 105 (2025): 441–491.39172219 10.1152/physrev.00011.2024 PMC 11918410 · doi ↗ · pubmed ↗
- 5C. Esmieu , S. Hostachy , C. Hureau , “Cu(I) chelators: Useful Tools to Reveal and Control Cu(I) Homeostasis and Toxicity,” Coordination Chemistry Reviews 539 (2025): 216684.
- 6Z. Zhu , M. Song , J. Ren , L. Liang , G. Mao , M. Chen , “Copper Homeostasis and Cuproptosis in Central Nervous System Diseases,” Cell death & disease 15 (2024): 850.39567497 10.1038/s 41419-024-07206-3PMC 11579297 · doi ↗ · pubmed ↗
- 7R. Squitti , P. Faller , C. Hureau , A. Granzotto , A. R. White , K. P. Kepp , “Copper Imbalance in Alzheimer's Disease and Its Link With the Amyloid Hypothesis: Towards a Combined Clinical, Chemical, and Genetic Etiology,” Journal of Advanced Dielectrics 83 (2021): 23–41.10.3233/JAD-20155634219710 · doi ↗ · pubmed ↗
- 8A. Sabalic , V. Mei , G. Solinas , R. Madeddu , “The Role of Copper in Alzheimer's Disease Etiopathogenesis: An Updated Systematic Review,” Toxics 12 (2024): 755.39453175 10.3390/toxics 12100755 PMC 11511397 · doi ↗ · pubmed ↗