Mutual learning for joint disease detection and severity prediction reveals multimodal pathogenesis for neurodegenerative disorders
Jin Zhang, Yixin Ji, Jinhua Liu, Wenrui Cui, Xiaohui Yao, Hongdong Li, Daoqiang Zhang, Lei Du, Michael Weiner, Michael Weiner, Paul Aisen, Ronald Petersen, Michael Weiner, Paul Aisen, Ronald Petersen, Clifford R Jack, William Jagust, Susan Landau, Monica Rivera-Mindt

TL;DR
A new method called Pa-MACRO helps detect and predict severity of neurodegenerative disorders while revealing their complex pathogenesis.
Contribution
Pa-MACRO introduces a novel mutual-assistance framework for joint disease detection and severity prediction with interpretable multimodal pathogenesis analysis.
Findings
Pa-MACRO achieves state-of-the-art results on the ADNI database for neurodegenerative disorder detection and severity prediction.
The method reveals intrinsic factors and interactions of multimodal pathogenesis through joint-embedding interpretability.
Semi-supervised cooperative learning improves performance in small sample and high-dimensional settings.
Abstract
Neurodegenerative disorders influence millions of people worldwide, and uncovering the pathogenesis is of urgent need. Many efforts have been made to detect or predict neurodegenerative disorders, while exploring the pathogenesis has been ignored from a systemic perspective. To handle this issue, we propose a novel and powerful method, referred to as Pathogenesis-aware Mutual-Assistance Classification and Regression Optimization (Pa-MACRO). First, Pa-MACRO incorporates a mutual-assistance bidirectional mapping technique with a joint-embedding fine-grained interpretability module. This can extract the intrinsic factors and their interactions of multimodal pathogenesis. Second, our method can simultaneously classify an at-risk individual and predict the severity triggered by neurodegenerative disorders. Furthermore, to address the small sample size issue and the high-dimensional issue,…
Genes, proteins, chemicals, diseases, species, mutations and cell lines named across the full text — each resolved to its canonical identifier and authoritative record.
Click any figure to enlarge with its caption.
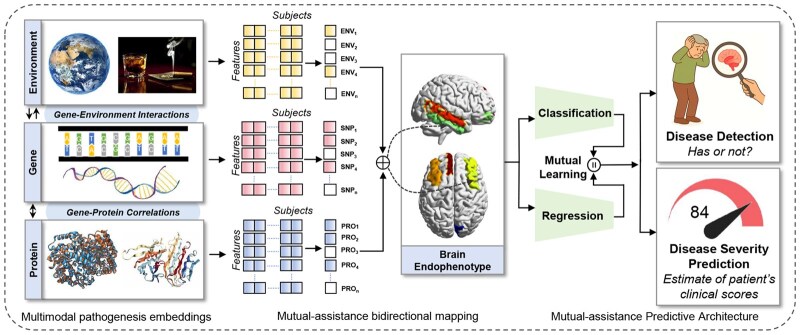 Figure 1
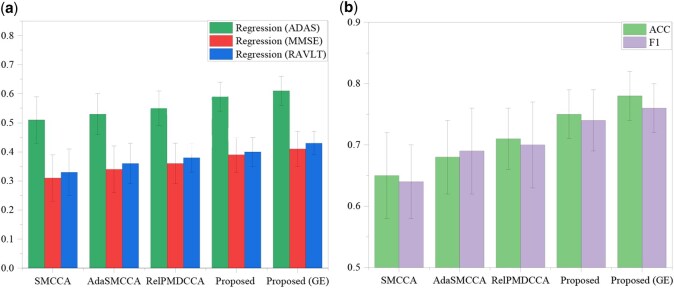 Figure 2
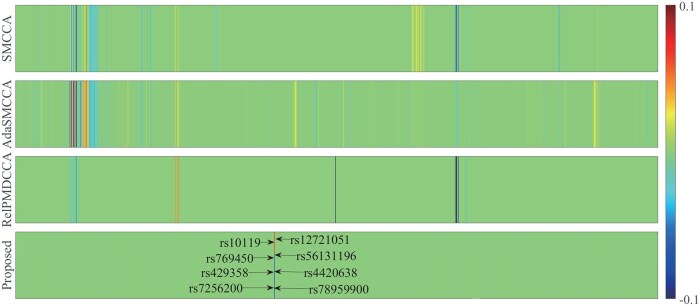 Figure 3
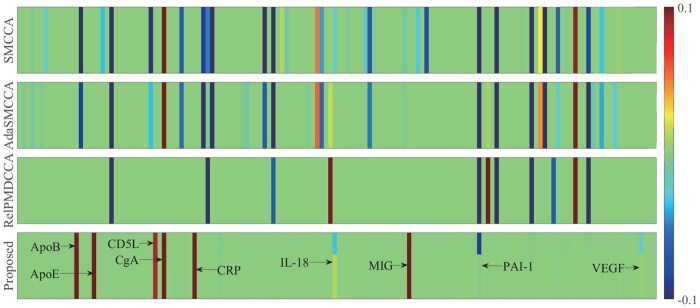 Figure 4
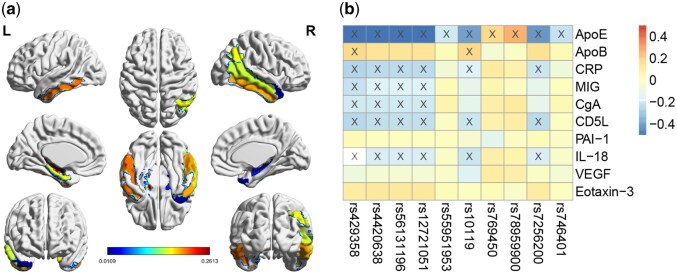 Figure 5
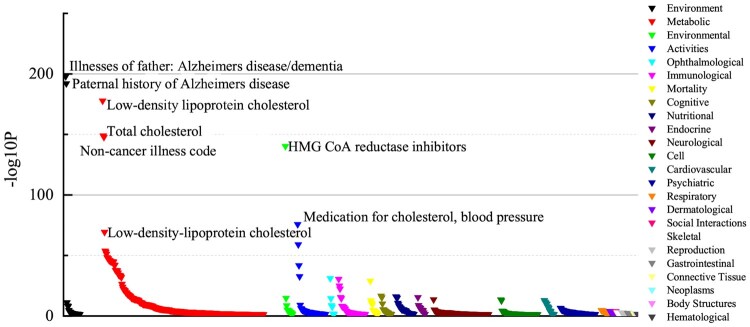 Figure 6
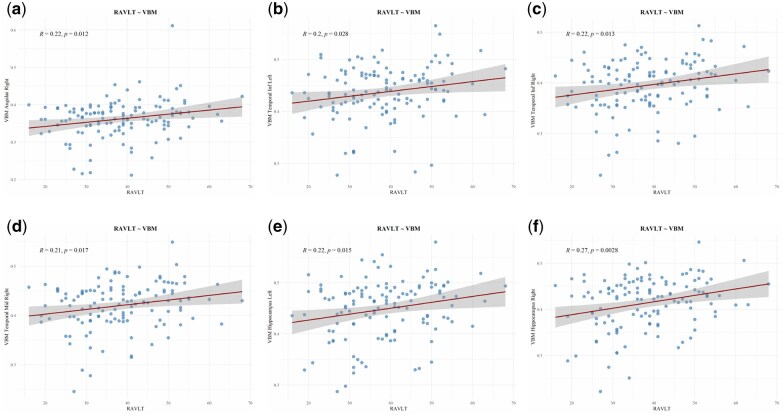 Figure 7
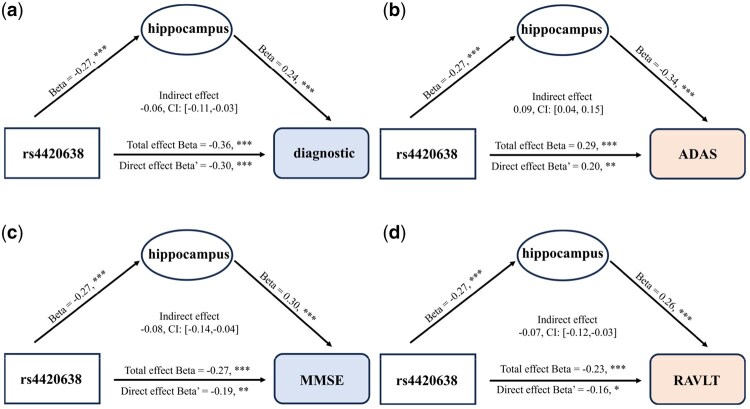 Figure 8
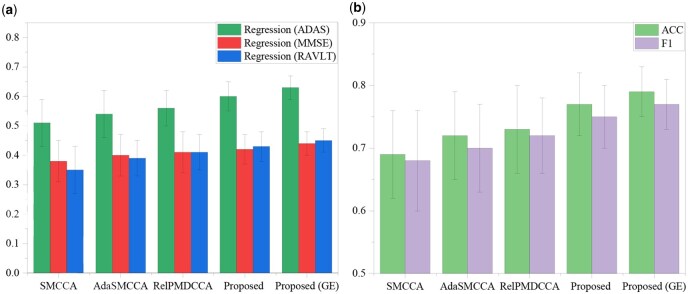 Figure 9
|
|
|
|
|
| PCCC | MACC |
|---|---|---|---|---|---|---|
| (a) | × | × | × | × | 0.41 ± 0.06 | 0.70 ± 0.08 |
| (b) | ✓ | × | × | × | 0.42 ± 0.07 | 0.72 ± 0.06 |
| (c) | ✓ | ✓ | × | × | 0.44 ± 0.07 | 0.73 ± 0.07 |
| (d) | ✓ | ✓ | ✓ | × | 0.46 ± 0.06 | 0.76 ± 0.06 |
| (e) | ✓ | ✓ | ✓ | ✓ |
|
|
- —National Natural Science Foundation of China10.13039/501100001809
Peer Reviews
No public reviews on file for this paper yet. If you reviewed it on a platform where reviews are public (OpenReview, ICLR, NeurIPS, ICML), you can paste yours below so the community can read it here.
Videos
No videos yet. Explain this paper in a talk, walkthrough, or lecture? Add one.
Taxonomy
TopicsMachine Learning in Healthcare · Genomics and Rare Diseases · Dementia and Cognitive Impairment Research
1 Introduction
1.1 Background and motivation
Neurodegenerative disorders are quite complex and are characterized by multiple pathological alterations in the brain. They may be influenced by genetic variations, proteomic expressions, and environmental factors, ultimately manifesting as brain imaging changes. While extensive efforts have been made to make diagnosis and prediction using brain imaging data (Bakkouri and Afdel 2020, 2023, Lu et al. 2021, Smith et al. 2021, Yu et al. 2021, Bakkouri et al. 2022, Wen et al. 2024), this single-aspect approach overlooks the contributions of genetics, environmental factors, proteomics factors, and their interactions in shaping intermediate imaging phenotypes. Consequently, it lacks a systems-level perspective for developing effective strategies to slow down or even halt disease advancement.
1.2 Advances and limitations in imaging genetics
Brain imaging genetics offers a powerful avenue for uncovering the genetic basis of brain structure and function by jointly analyzing genetic variants, such as single nucleotide polymorphisms (SNPs) and neuroimaging-derived quantitative traits (QTs). This integrative approach has deepened our understanding of both typical and atypical brain processes. Over the past decade, a range of univariate, multivariate, and bi-multivariate methods have been developed to probe the genetic architecture of imaging endophenotypes (Shen and Thompson 2020, Huang et al. 2021, Yang et al. 2024, Zhang et al. 2024a, Wang et al. 2025). However, emerging evidence indicates that these endophenotypes are not solely shaped by additive genetic effects but are also influenced by gene–environment (G × E) interactions and gene–protein correlations. These interactions can modulate intermediate phenotypes and ultimately impact disease risk. Capturing both interaction and main effects is therefore critical for improving disease prediction and elucidating the heritability of brain disorders (Huang et al. 2021, Yu et al. 2024, Peng et al. 2025, Zhang et al. 2025a).
1.3 Challenges in joint disease detection and biomarker discovery
Nowadays, accurate disease detection, severity assessment, and pathogenesis discovery are fundamental yet challenging tasks for neurodegenerative disorders (Bakkouri and Afdel 2019, Shen and Thompson 2020, Bakkouri and Bakkouri 2024, 2025). However, (i) most existing studies address diagnosis and prediction separately, ignoring their strong interdependence. In reality, diagnostic categories reflect disease severity, which is closely linked to clinical outcomes. Jointly learning both tasks could leverage the intrinsic associations between clinical variables and categories, thereby enhancing detection/assessment performance (Andrews et al. 2019). (ii) Traditional approaches treat disease prediction and biomarker discovery as independent tasks. While disease prediction models aim to provide accurate diagnoses or disease severity prediction, biomarker discovery focuses on identifying accurate factors associated with disease (DeGroat et al. 2023, Guo et al. 2024, Zhang et al. 2024b, Zhong et al. 2025a). Treating them in isolation disregards their mutual reinforcement: interpretable biomarkers can enhance model transparency, and predictive models can guide meaningful feature selection. Although recent studies have advanced learning strategies for accurate prediction, they often lack intrinsic interpretability (Shen and Thompson 2020, Liu et al. 2024, Zhang et al. 2025b, Zhong et al. 2025b).
1.4 Motivation for a unified and interpretable framework
We thus advocate for a unified framework that jointly performs disease prediction and mechanistic inference to achieve both diagnostic reliability and biological fine-grained interpretability (fine-grained interpretability means the model’s ability to quantitatively and qualitatively attribute predictive contributions to individual biomarkers). A further challenge in real-world applications is the scarcity of large-scale multi-omics datasets due to privacy constraints and the extended time required for data collection. Incorporating unlabeled data from extensive brain disorder datasets into a joint-embedding architecture presents a promising strategy to establish a valuable link between the wealth of underexploited data and researchers facing limited resources, thus promoting generalizability and reliability in disease prediction and biomarker identification.
1.5 Methodological and conceptual innovation
Unlike previous multimodal approaches that primarily capture statistical correlations among imaging, genomic, or proteomic modalities, the proposed Pa-MACRO framework establishes a mechanism-guided, multi-task co-learning paradigm that jointly optimizes disease diagnosis (classification), severity prediction (regression), and mechanistic biomarker discovery within a single end-to-end architecture. Through the Mutual-Assistance (MA) Triad—a three-stage cyclic learning process integrating multimodal representation learning, predictive modeling, and interpretable feature selection—Pa-MACRO enables mutual reinforcement between diagnostic and prognostic tasks while embedding interpretability directly into model training rather than relying on post hoc explanation. Furthermore, the integration of semi-supervised learning, divide-and-conquer chromosome-wide optimization, and fine-grained interpretability modules enhances scalability and biological reliability.
Our main scientific contributions are as follows:
Drawing on the concept of Mutual Assistance (MA), we are the first to propose a robust yet practical joint classification and regression architecture with interpretable multimodal pathogenesis embeddings, termed Pa-MACRO. This unified framework effectively enhances disease diagnosis and quantitative prediction while facilitating biologically meaningful biomarker identification.We develop a novel mutual-assistance joint optimization paradigm that integrates genomics, environmental, proteomic, and radiomic information. By bridging micro-level molecular mechanisms and macro-level imaging phenotypes, the proposed model enables biologically informed downstream diagnostic classification and prediction.We further propose an iterative learning mechanism that allows disease prediction and biomarker identification to mutually reinforce each other, forming a synergistic loop that continuously improves both predictive accuracy and interpretability.To address the challenges of small sample sizes and high-dimensional multimodal data, we design a semi-supervised cooperative learning strategy that effectively leverages unlabeled data. Through a divide-and-conquer extension to chromosome-wide settings, our method achieves scalable and robust imaging-genetic modeling.Extensive experiments on different multi-omic medical datasets demonstrate the superiority, robustness, and interpretability of the proposed approach in neurodegenerative disease diagnosis and quantitative trait prediction, while enabling reliable biomarker discovery with clear biological relevance.
2 Materials and methods
2.1 The Pa-MACRO
As mentioned above, we build on the concept of mutual-assistance learning to integrate multimodal representation, diagnosis/prediction, and biomarker identification into a unified framework, enabling both tasks to benefit from their intrinsic interdependence. To this end, we propose Pa-MACRO, a model specifically designed to facilitate the clinical translation of high-dimensional omics data by bridging the gap between predictive modeling and the sparsity and interpretability demands of clinical biomarker discovery. An overview of the Pa-MACRO architecture is presented in Fig. 1, which comprises three novel components: mutual-assistance joint bidirectional mapping (MAJBM), mutual-assistance joint classification/regression (MAJCR), and mutual-assistance prediction and discovery strategy.
A schematic illustration of a mutual learning-assisted predictive architecture with interpretable multimodal pathogenesis embeddings. First, Pa-MACRO incorporates a mutual-assistance bidirectional mapping structure with joint-embedding fine-grained interpretability, which helps collaboratively extract the intrinsic unity and interactions of multimodal pathogenesis that contribute to imaging phenotypes. Second, we meticulously design a mutual-assistance joint classification/regression module to ensure joint detection/assessment, which promotes disease detection and severity prediction.
2.1.1 MA-1: unified mutual-assistance framework of representation learning and prediction modeling
First, the spirit of MA is manifested in trustworthy multimodal collaborative integration. Pa-MACRO incorporates a MA bidirectional mapping structure with the joint-embedding interpretability, which helps extract fine-grained factors and cross-modality alignment of interpretable genetic variations factors, environmental factors, genotype–environment interaction, proteomic factors, and disease-related imaging endophenotypes simultaneously, thus contributing to downstream diagnostic classification performance. Therefore, takes the form:
where , , and carry the main effects of SNPs, proteomic, and imaging markers, respectively, carries the interaction effects between SNPs and environment markers, with promising evidence for pathogenesis discovery.
Of note, the SNPs are denoted as , imaging phenotypes, proteins, and environmental exposures are denoted as , , and , is clinical scores, and is diagnostic status. n is the number of subjects. , , , and represent the number of SNPs, imaging, proteomics biomarkers, and environmental exposures, respectively. Specifically, each modality (genetic, proteomic, environmental, and imaging) contributes to a common latent space via bidirectional mappings, enabling cross-modal correlation maximization and complementary information exchange. In addition, the unlabeled SNPs are denoted as , unlabeled proteins are denoted as . Of note, in the last part of , semi-supervised cooperative learning (SCL) integrates unlabeled multi-omics to extract cross-modal co-expression patterns for improving detection/assessment, ensuring both stability and reliability, which is promising to establish a valuable link between the wealth of underexploited data and researchers facing limited resources.
2.1.2 MA-2: mutual-assistance for disease detection and severity prediction
Second, the spirit of MA is also reflected in the joint optimization paradigm for disease diagnosis and prediction. Specifically, logistic regression is employed for disease classification, while multivariate least squares regression is used to predict clinical scores:
where F is the number of classes. denotes the predicted disease status for subject i and class k. Here, we introduce a joint structured alignment regularizations between classification and regression features. This can enhance both features to work more collaboratively during the process of optimization, i.e. , which ensures that the identified biomarkers are relevant to the disease of interest, finally mutually enhancing disease detection and assessment with greater flexibility and performance. Furthermore, to ensure reliable biomarker identification and facilitate interpretation, we introduce sparse variable regularizers (SVR) to select important features and remove unstable features, which could enhance interpretability while preserving predictability. We use to identify interpretable GE interactions. and control the sparsity of the main effects of genetics and proteomic markers. Following analogous joint optimization paradigm, we employ -norm , -norm, and -norm to identify significant SNPs at individual and group levels to understand the genetic architectures of ADs. Thus, . The FGL_2,1_ regularization captures both group-level correlations and local smoothness across neighboring features, enabling recovery of LD blocks while maintaining sparsity for interpretability. In addition, -norm and -norm are introduced to identify meaningful proteomics, i.e. , giving Pa-MACRO better interpretability.
2.1.3 MA-3: mutual-assistance for biomarker discovery and disease prediction
Third, the principle of mutual assistance is further embodied in the joint optimization paradigm for biomarker discovery and disease prediction. Unlike conventional post hoc interpretability methods, Pa-MACRO is designed as a fully end-to-end framework, enabling the identification of fine-grained explanatory features through a fully learnable process. We define and . Likewise, is the same as well. Together, these three components are synergistically integrated into a cohesive mutual-assistance triad framework (MA-3), as described below:
2.2 Extension to high-dimensional analysis
Further, the direct application of Pa-MACRO to high-dimensional analysis presents challenges due to the computational intensity of genotype matrices. To manage the high-dimensional SNPs and GE interactions, we partition them into L non-overlapping subsets, denoted as and , respectively. We then adopt an efficient strategy that circumvents the direct computation of main and interaction terms by calculating these effects within each subset and subsequently combining the results across all genotypes. Following the divide-and-conquer principle, we reformulate Pa-MACRO as follows:
where and represents regression and classification, respectively. The operator represents the merging of SNPs and interaction terms. This decoupling allows for parallel processing, as SNPs and interaction terms can be processed independently, reducing memory requirements. Fast Pa-MACRO only needs to store small SNP matrices during iteration. As shown in Equation (4), Pa-MACRO is multi-convex and can be optimized using an alternating convex search (ACS) strategy. We first fix , , and to solve for using gradient descent and then iteratively update each variable, guaranteeing the convergence to a local optimum.
Algorithm 1.The Pa-MACRO algorithmRequireThe SNPs , imaging phenotypes, proteins and environmental exposures , , and , clinical scores, diagnosis category, as well as the tradeoff parameters. Ensure: Canonical weights , , , and . 1: Initialize , , , . 2: while not convergence do 3: Solve with gradient descent by fixing , , and . 4: Solve with gradient descent by fixing , , and . 5: Solve with gradient descent by fixing , , and . 6: Solve with gradient descent by fixing , , and . 7: end while 8: Sorting , , , and based on their absolute values and reporting the user or domain expert-defined top biomarkers.
3. Results
3.1 Experimental setup
3.1.1 State-of-the-art methods
We systematically evaluated Pa-MACRO against a series of representative and widely recognized imaging genetics techniques, including SMCCA, AdaSMCCA, and RelPMDCCA (Witten and Tibshirani 2009, Hu et al. 2018, Rodosthenous et al. 2020). By comparison, although many recent deep learning architectures demonstrated strong predictive performance, they inherently lacked interpretability. In particular, they often failed to isolate key explanatory variables from the original input domain—especially those capturing G × E interaction effects. Their dependence on post hoc interpretation methods consequently limited their effectiveness in elucidating the biological mechanisms underlying complex disease processes.
3.1.2 Evaluation criteria and parameter setting
The experimental evaluation was based on three key metrics: the quality of selected feature subsets, the accuracy of clinical score prediction, and the effectiveness of disease status classification. To ensure robust and unbiased model tuning, we employed nested five-fold cross-validation, systematically exploring a hyperparameter search space defined as ( ), selecting parameters that produced the highest mean testing performance.
3.2 Results on the Alzheimer’s disease dataset
3.2.1 Dataset
The dataset comprised 244 subjects, including 42 healthy controls (HC), 137 individuals with mild cognitive impairment (MCI), and 65 patients diagnosed with AD, all obtained from the Alzheimer’s Disease Neuroimaging Initiative (ADNI) database (adni.loni.usc.edu). Multimodal data sources encompassed: (i) proteomic profiles from cerebrospinal fluid and blood plasma, yielding 146 protein markers post quality control via the rules-based medicine (RBM) platform; (ii) quantitative imaging traits (QTs) derived from voxel-based morphometry (VBM) of structural MRI; and (iii) cortical and subcortical morphometric features, including volumetric and thickness measures extracted using FreeSurfer. In addition, 16 environmental risk variables were incorporated, such as age, vision status, body mass index, alcohol consumption, drug sensitivity, blood pressure, smoking history, and prior stroke events. To enhance the generalizability of the model, unlabeled SNPs and protein data from large-scale multi-omics datasets were further integrated into our model to improve the robustness of disease prediction and biomarkers discovery. In total, 10 000 high-quality SNPs known risk loci such as APOE, APOC1, and TOMM40 were retained for subsequent analyses. To assure a stable and reliable result, we normalized the data (z-scores) to remove the influence of data scales.
3.2.2 Enhanced prediction of clinical scores and accurate disease status classification
As shown in Fig. 2 a and b, we evaluated Pa-MACRO’s performance on cognitive score prediction and disease status classification. The metrics included correlation coefficients (CCCs) for regression tasks and accuracy (ACC) and F1 scores for classification tasks. Pa-MACRO consistently surpassed baseline models and joint classification–regression methods based on VBM, achieving superior classification accuracy and more robust cognitive score predictions across ADAS, MMSE, and RAVLT. These results highlighted the efficacy of the mutual-assistance learning paradigm in improving both diagnostic accuracy and severity. To validate the superiority of the proposed, we performed paired t-tests between Pa-MACRO and all benchmark approaches, and all comparisons reached statistical significance (P < .05).
Comparison of evaluation outcomes for AD diagnosis (ACC, F1) and assessment (CCC) on VBM (a, b), where GE denotes inclusion of gene–environment interactions. Error bars indicate the standard deviation (SD) across five-fold cross-validation runs.
3.2.3 Multi-omics explanation (genetic, proteomic, and neuroimaging-derived phenotype)
Figure 3 illustrates the weight of SNPs, where Pa-MACRO successfully identified several AD-risk loci, including the well-established rs429358 (APOE), rs4420638 (APOC1), rs56131196 (APOC1), and rs12721051 (APOC1) (Serrano-Pozo et al. 2021). We then performed ANOVA to examine their main effects on the diagnostic phenotype. As expected, all P-values were statistically significant (P .05). Due to the -norm, meaningful SNP groups were identified, including rs4420638, rs56131196, and rs12721051 (APOC1), all with P = . These findings supported the oligogenic or polygenic nature of AD. Figures 4 and 5 demonstrates that Pa-MACRO successfully identified several AD-related proteomic markers (ApoE, ApoB, CRP, MIG, and CgA) (Serrano-Pozo et al. 2021), imaging phenotypes including the right and left hippocampus, parahippocampus, and temporal pole regions (Frisoni et al. 2008, Fan et al. 2019, Geigenmüller et al. 2024). In contrast, baselines generated numerous irrelevant signals that may introduce misleading information in downstream analyses.
Average canonical weights of SNPs derived from five-fold cross-validation. Each row corresponds to a method: (i) SMCCA; (ii) AdaSMCCA; (iii) RelPMDCCA; and (iv) Proposed.
Average canonical coefficients of proteomic markers. Each row represents a method: (i) SMCCA; (ii) AdaSMCCA; (iii) RelPMDCCA; and (iv) Proposed.
(a) Visualization of the detected brain imaging quantitative traits (QTs). (b) Heatmap depicting pairwise correlations between the top 10 SNPs and biomarkers, where the symbol “×” denotes statistically significant associations (P < .05).
Beyond the main effects, Pa-MACRO identified significant gene–environment interactions. The top five interactions were (rs12721046, smoking), (rs1160984, alcohol abuse), (rs79429216, tremor), (rs1160984, stroke), and (rs75654248, visual impairment). Notably, the rs12721046–smoking interaction was linked to AD, aligning with prior findings that rs12721046 was an AD-risk variant and that smoking contributed to disease detection (Serrano-Pozo et al. 2021), as the co-occurrence of these factors may enhance clinicians’ confidence in identifying at-risk individuals. We also conducted an ablation study by removing the GE interactions (Fig. 2). As expected, the best performance was achieved when both main and interaction effects were considered, highlighting the critical importance of GEs. The heatmap in Fig. 5b further illustrated SNP–protein interactions, where the (rs429358, ApoE) pair exhibited the strongest correlation, aligning with established evidence that rs429358 could play a crucial role in encoding the ApoE protein. These findings verified Pa-MACRO in identifying biologically meaningful AD-related biomarkers and facilitating targeted therapeutic interventions.
3.3 Follow-up analyses: phenome-wide association studies
To validate the phenotypic relevance of SNPs identified by Pa-MACRO, we conducted a phenotype-wide association study (PheWAS) using publicly available data from the GWAS Atlas database (https://atlas.ctglab.nl), which aggregates results from 4756 GWAS. As shown in Fig. 6, rs4420638 demonstrated significant associations with several neurological traits, including Alzheimer’s disease and paternal family history of dementia. It was also linked to cardiometabolic conditions such as elevated blood pressure and diabetes. Similarly, APOC1 remained strongly associated with neurological phenotypes, reinforcing its established role in neurodegenerative susceptibility. These results validated the ability of Pa-MACRO to detect stable and biologically relevant genetic signals.
The PheWAS investigation produced findings for SNP rs4420638 (APOC1).
3.4 Correlation between imaging-based biomarkers and clinical cognitive
To facilitate clinical application of our findings, we examined the relationships between top neuroimaging-derived phenotypes and cognitive function in individuals at risk for AD. Specifically, we analyzed correlations between the identified imaging biomarkers and clinical cognitive measures, focusing on the Rey Auditory Verbal Learning Test (RAVLT), a widely used metric sensitive to AD-related cognitive impairment.
As depicted in Fig. 7(a)–(f), the leading brain regions selected from voxel-based morphometry (VBM) structural MRI—namely the Angular gyrus, inferior and middle Temporal gyri, and Hippocampus—showed strong associations with both diagnostic categories and cognitive performance. These findings underscored their effectiveness in reflecting disease severity. Importantly, the top neuroimaging features correlated significantly with RAVLT scores, supporting their value as robust biomarkers for cognitive decline.
Correlation between the top-selected VBM imaging quantitative traits (QTs) and the clinical cognitive score RAVLT. Subfigures (a–f) respectively illustrate the associations between RAVLT and the regional gray matter volumes of: (a) Right Angular Gyrus, (b) Left Temporal Pole, (c) Right Temporal Pole, (d) Right Temporal Middle Gyrus, (e) Left Hippocampus, and (f) Right Hippocampus.
3.5 Mediation analysis for uncovering the pathogenic pathways of Alzheimer’s disease
Focusing on the most prominent genotype–phenotype pair (rs4420638, hippocampal), we conducted mediation analysis to model the causal pathways connecting genetic variation, brain structure, and disease status. In this model, the SNP served as the independent variable, diagnosis as the outcome, and hippocampal volume as the mediator. This approach provided mechanistic insights into how genetic risk factors may influence disease manifestation through structural brain alterations. As shown in Fig. 8, selecting hippocampal volume as the mediator revealed a significant association between rs4420638 and diagnostic outcomes ( = −0.36, *P *< .001), with a portion of this effect mediated by the hippocampus (bootstrapped average causal mediation effect: = 0.06 [0.11, 0.03]), indicating partial mediation. Similar mediation effects were observed for cognitive measures: the hippocampus partially mediated the effect of rs4420638 on ADAS scores ( = 0.09 [0.04, 0.15]), MMSE scores ( = 0.08 [0.14, 0.04]), and RAVLT scores ( = 0.07 [0.12, 0.03]). These results demonstrated that hippocampal atrophy functioned as a key intermediate phenotype linking genetic risk to both clinical diagnosis and cognitive decline.
*Analysis of the mediating role of endophenotypic traits on diagnostic outcomes for top-selected genetic variants: (a) Diagnostic status, (b) ADAS, (c) MMSE, and (d) RAVLT. *P < .05, **P < .005, **P < .001.
3.6 Independent experiments
To assess the generalizability of our model, we conducted additional experiments using an independent imaging QTs dataset derived from FreeSurfer processing of the ADNI database. In parallel, we also retrieved corresponding genomic, proteomic, and environmental data for the same subjects from the ADNI cohort. The full analytical pipeline was systematically applied to this dataset. Results confirmed that genes such as APOE, TOMM40, and APOC1 contribute to disease phenotypes across multiple brain regions. Moreover, our method identified significant GE interactions, including (rs79429216, motor function), (rs1160984, stroke), and (rs71352241, alcohol abuse). Pa-MACRO also detected key FreeSurfer markers, including hippocampal volume, bilateral entorhinal cortex, mid-temporal regions, and precuneus regions. For plasma biomarkers, nearly all top-ranked features, such as ApoE, MIG, and CRP, were AD-related. Notably, our approach achieved the highest fidelity in clinically relevant brain biomarkers. Collectively, these findings demonstrated the robustness and generalizability of our model across diverse datasets. As illustrated in Fig. 9, Pa-MACRO consistently outperformed baseline approaches on FreeSurfer datasets.
Comparison of testing results for AD diagnosis (ACC, F1) and assessment (CCC) on FreeSurfer (a, b) datasets.
3.7 Ablation study
Finally, to investigate the effectiveness of Pa-MACRO, we ran ablation experiments to investigate the impact of the main component on average Prediction (PCCC) and Classification (MACC) tasks.
Effect of SVR: Table 1 reports the test PCCCs and MACCs for all the different choices, revealing that the exclusion of resulted in suboptimal performance. This underscored the crucial role of integrating in our model.
Effect of MABM: The ablation results on PCCCs and MACCs indicated that considering the improved disease diagnosis and prediction. This enhancement may stem from the exploration of multimodal pathogenesis, which played a crucial role in enhancing regression and classification.
Effect of MAJCR: Pa-MACRO achieved the highest average PCCCs and MACCs with the incorporation of . We attributed this improvement primarily to the unified mutual-assistance framework, which jointly modeled disease detection and severity prediction.
Effect of SCL: Finally, as shown in Table 1, the integration of into Pa-MACRO led to notable performance gains and a substantial reduction in variance. We attributed these improvements primarily to the effective incorporation of unlabeled data, which enhanced predictive accuracy while promoting model reliability.
4 Discussion and conclusions
In this study, we proposed Pa-MACRO, a unified predictive framework integrating multimodal pathogenesis embeddings for neurodegenerative disease diagnosis and prediction. Across two independent neuroimaging datasets, our model consistently achieved significant quantitative improvements over state-of-the-art baselines. On the ADNI-VBM dataset, Pa-MACRO outperformed the strongest baseline by (CCC, ), (ACC, ), and (F1, ).
To validate the biological relevance of the identified biomarkers, we conducted comprehensive follow-up analyses. ANOVA confirmed significant differences (*P *< .05) in key genetic and imaging markers, including APOE rs429358 (*P *= 7.73 × 10^−10^), APOC1 rs4420638/rs56131196/rs12721051 (*P *= 1.88 × 10^−10^). Mediation analysis (Fig. 8) revealed that hippocampal volume partially mediated the causal path rs4420638 to diagnosis with an average effect , *P *< .001, linking APOC1 variants to hippocampal atrophy and AD diagnosis.
Gene expression profiling (GTEx + BrainSpan) revealed lifelong high expression of APOE, early up-regulation of TOMM40, and prenatal/postnatal peaks of APOC1, suggesting distinct neurodevelopmental trajectories (Appendix, available as supplementary data at Bioinformatics online). PheWAS linked rs4420638 (APOC1) to Alzheimer’s disease, parental dementia history, and cardiometabolic traits (cholesterol, hypertension), indicating pleiotropic influence across physiological systems (Fig. 6). Finally, DisGeNET highlighted “Late-Onset Alzheimer’s Disease,” “Dyslipoproteinemias,” and “Autoantibody measurement” as top enriched categories.
Collectively, these findings established both quantitative superiority and pathophysiological interpretability of Pa-MACRO. The framework not only improved predictive accuracy by approximately 10% over leading baselines but also identified mechanistically coherent multimodal biomarkers linking genetic variants (APOE/APOC1/TOMM40) to imaging endophenotypes (hippocampal and temporal atrophy) and cognitive decline. By bridging neural circuitry, genetic mechanisms, and predictive modeling, Pa-MACRO provided a reproducible, biologically grounded paradigm for trustworthy AI-driven research, with potential extensions to other neurodegenerative disorders and future integration of additional multimodal datasets for comprehensive disease modeling.
Supplementary Material
btaf629_Supplementary_Data
The reference list from the paper itself. Each links out to its DOI / PubMed record.
- 1Andrews JS , Desai U, Kirson NY et al Disease severity and minimal clinically important differences in clinical outcome assessments for Alzheimer’s disease clinical trials. Alzheimers Dement (N Y) 2019;5:354–63.31417957 10.1016/j.trci.2019.06.005PMC 6690415 · doi ↗ · pubmed ↗
- 2Bakkouri I , Afdel K. Multi-scale CNN based on region proposals for efficient breast abnormality recognition. Multimed Tools Appl 2019;78:12939–60.
- 3Bakkouri I , Afdel K. Computer-aided diagnosis (CAD) system based on multi-layer feature fusion network for skin lesion recognition in dermoscopy images. Multimed Tools Appl 2020;79:20483–518.
- 4Bakkouri I , Afdel K. Mlca 2f: multi-level context attentional feature fusion for covid-19 lesion segmentation from CT scans. Signal Image Video Process 2023;17:1181–8.35935538 10.1007/s 11760-022-02325-w PMC 9346062 · doi ↗ · pubmed ↗
- 5Bakkouri I , Afdel K, Benois-Pineau J et al BG-3DM 2F: bidirectional gated 3D multi-scale feature fusion for Alzheimer’s disease diagnosis. Multimed Tools Appl 2022;81:10743–76.
- 6Bakkouri I , Bakkouri S. 2MGAS-Net: multi-level multi-scale gated attentional squeezed network for polyp segmentation. SI Vi P 2024;18:5377–86.
- 7Bakkouri I , Bakkouri S. UGS-M 3F: unified gated swin transformer with multi-feature fully fusion for retinal blood vessel segmentation. BMC Med Imaging 2025;25:77.40050753 10.1186/s 12880-025-01616-1PMC 11887399 · doi ↗ · pubmed ↗
- 8De Groat W , Mendhe D, Bhusari A et al Intelligenes: a novel machine learning pipeline for biomarker discovery and predictive analysis using multi-genomic profiles. Bioinformatics 2023;39:btad 755.38096588 10.1093/bioinformatics/btad 755PMC 10739559 · doi ↗ · pubmed ↗