Polychromatic Virtual Retinal Imaging of Two Extended-Depth-of-Focus Intraocular Lenses
Damian Mendroch, Stefan Altmeyer, Uwe Oberheide

TL;DR
This study uses virtual imaging to compare two types of intraocular lenses, showing how they perform under different lighting conditions and visual tasks.
Contribution
A simulation-based method is introduced to evaluate intraocular lenses with realistic color and depth-of-focus effects.
Findings
The LuxSmart lens shows increased depth-of-focus under both mesopic and photopic conditions.
The IQ Vivity lens has minimal aberrations for far vision under mesopic conditions, ideal for night driving.
Simulated images help ophthalmologists and patients better understand lens performance.
Abstract
This work characterizes two extended-depth-of-focus (EDoF) intraocular lenses, the Alcon IQ Vivity and the Bausch & Lomb LuxSmart, using virtual retinal imaging. A simulation-based examination tests these lenses under various conditions, while including dispersion and color effects. A custom sequential Monte-Carlo Ray Tracer simulates the propagation of a broadband daylight spectrum through a mathematical eye model. Realistic color images of a pinhole and resolution chart were generated, with variations in object distances and pupil size. A comparison is made with the monofocal Alcon IQ to highlight the benefits of EDoF models. Simulated images clearly demonstrate the superior acuity and reduced aberrations of these lenses at intermediate vision. There are notable differences between both models: the LuxSmart lens exhibits an increased depth-of-focus under both mesopic and photopic…
Genes, proteins, chemicals, diseases, species, mutations and cell lines named across the full text — each resolved to its canonical identifier and authoritative record.
Click any figure to enlarge with its caption.
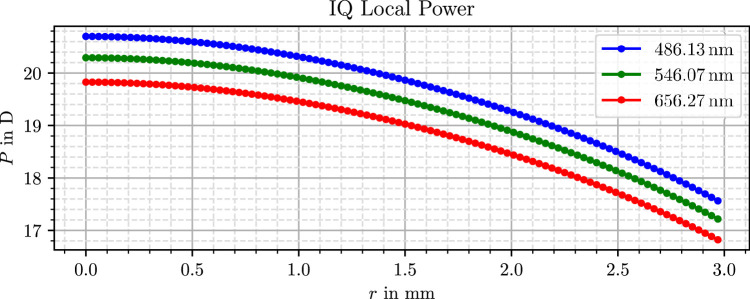 Figure 1
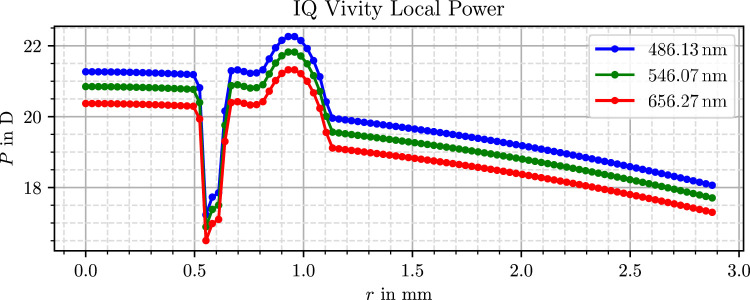 Figure 2
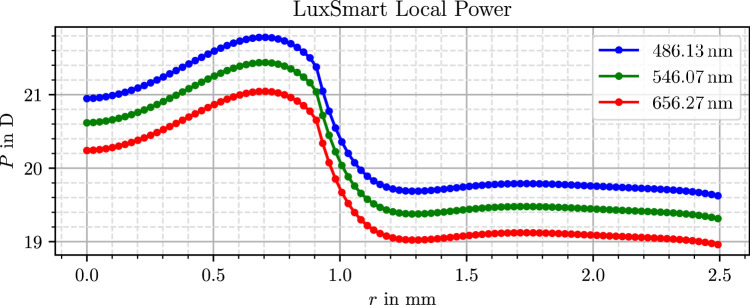 Figure 3
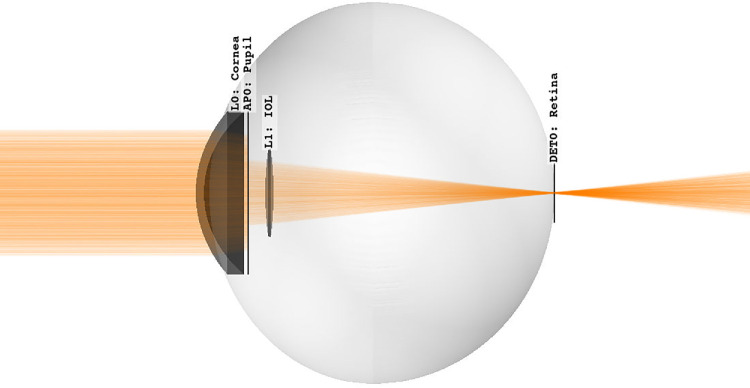 Figure 4
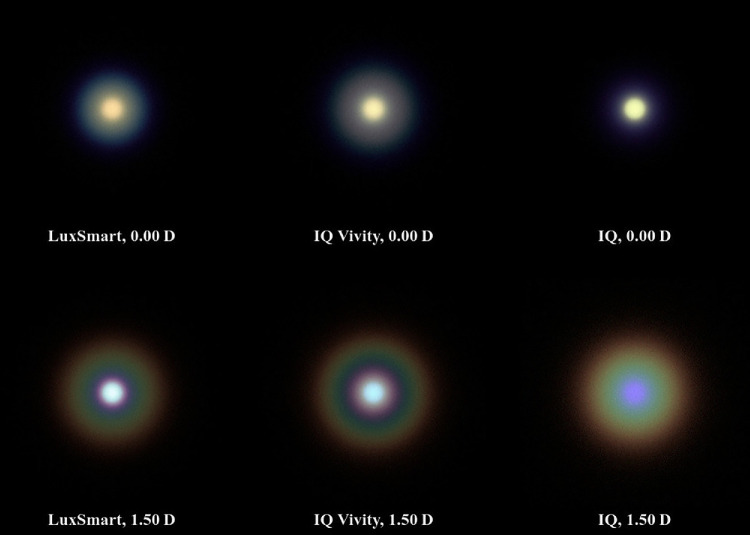 Figure 5
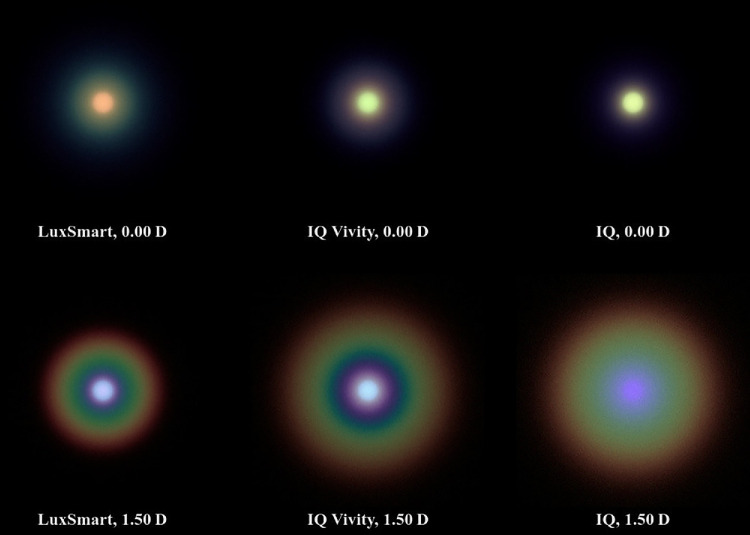 Figure 6
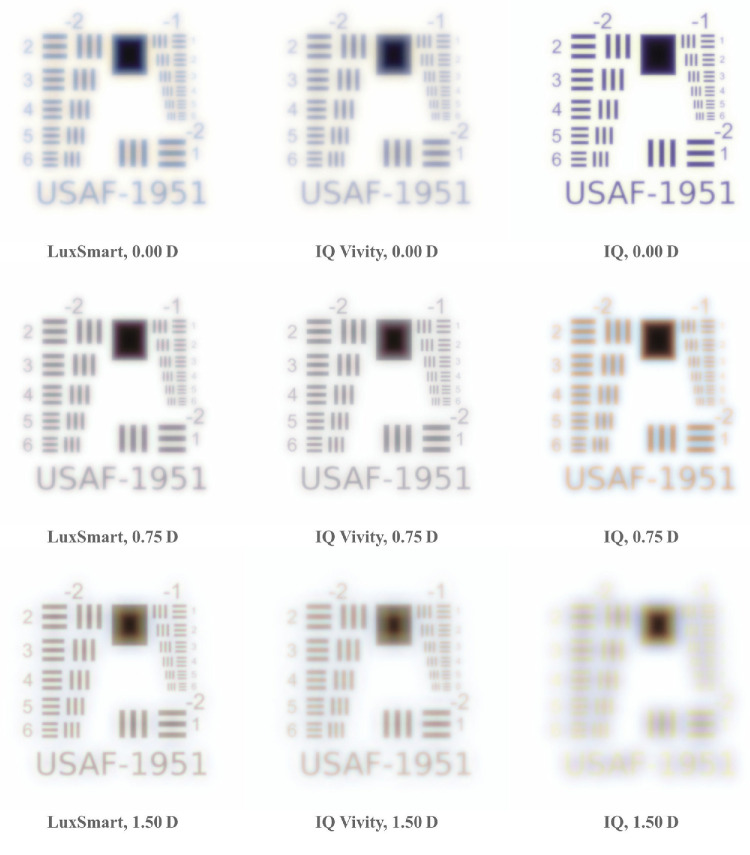 Figure 7
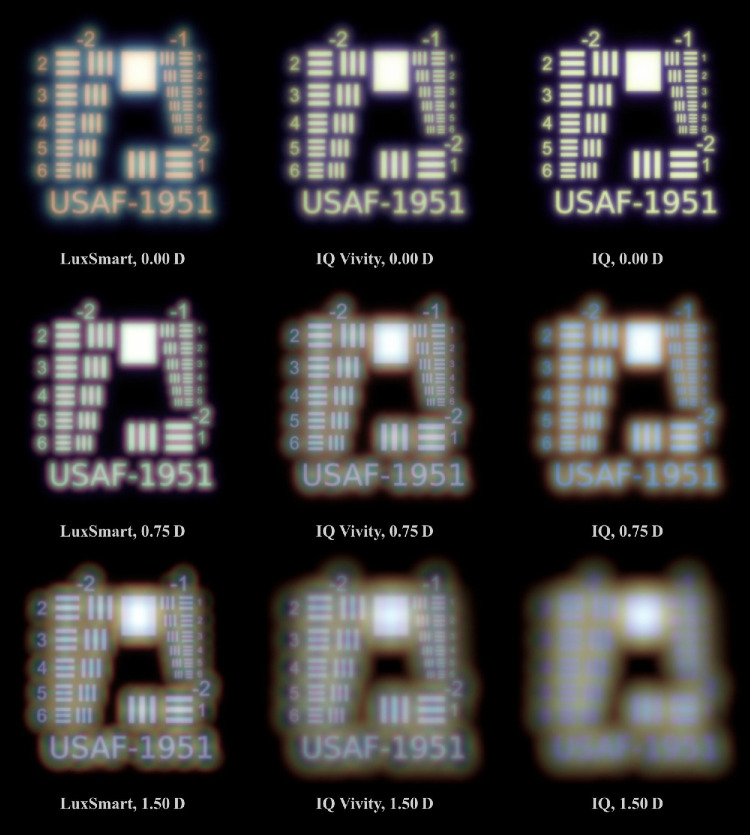 Figure 8
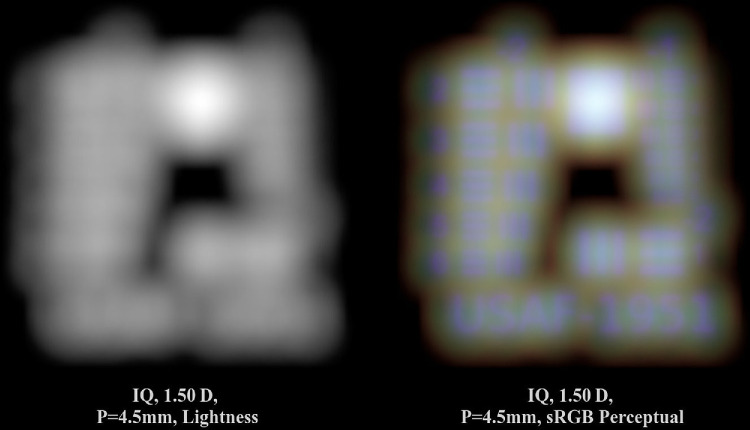 Figure 9
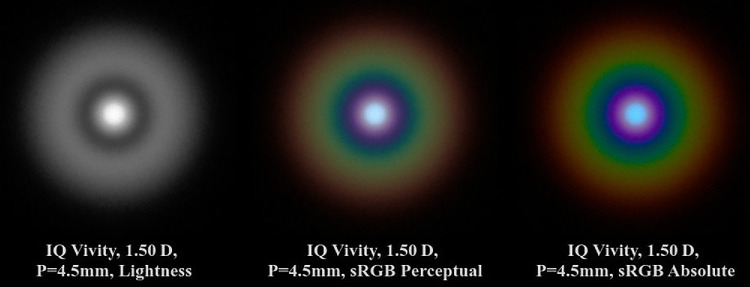 Figure 10
| LuxSmart | IQ Vivity | IQ | ||
|---|---|---|---|---|
| Photopic | 0.00 D | + + | + + | + + + |
| 0.75 D | + + | + + | o | |
| 1.50 D | + + | + | – | |
| Mesopic | 0.00 D | + + | + + + | + + + |
| 0.75 D | + + + | + + | o | |
| 1.50 D | + | o | – |
Peer Reviews
No public reviews on file for this paper yet. If you reviewed it on a platform where reviews are public (OpenReview, ICLR, NeurIPS, ICML), you can paste yours below so the community can read it here.
Videos
No videos yet. Explain this paper in a talk, walkthrough, or lecture? Add one.
Taxonomy
TopicsOphthalmology and Visual Impairment Studies · Intraocular Surgery and Lenses · Image Processing Techniques and Applications
Introduction
Extended-depth-of-focus (EDoF) intraocular lenses (IOLs) offer a new, promising solution for cataract surgery. By enhancing intermediate vision, they serve as a middle ground between monofocal and multifocal lenses. Although their range of vision does not match that of multifocal intraocular lenses (MIOLs), they outperform MIOLs for intermediate vision under mesopic conditions.1^,^2 They also offer reduced photic phenomena compared with bifocal MIOLs1^,^3 and trifocal MIOLs,3^,^4 and improved contrast sensitivity compared to a trifocal IOL.1^,^2 This benefit is particularly evident with non-diffractive EDoF lenses, which show significantly fewer visual disturbances than their diffractive counterparts.5^–^7 EDoF IOLs are expected to have a higher tolerance to refractive shift and postoperative residual errors.8^–^10 Furthermore, some patients who are not suitable candidates for MIOL now have an opportunity to reduce their spectacle dependence.11^,^12 This is especially beneficial as intermediate vision plays an important role in daily activities.
The selection of an appropriate lens should take into account medical factors as well as the patient's preferences. This process necessitates a comprehensive understanding of the various lens types, as well as differences between specific models. A comparison of lenses, along with an estimation of photic phenomena and visual quality, would greatly aid in selecting a lens that meets the patient's needs. Typically, such decisions are based on a combination of clinical studies, publications with in vitro measurements, or, possibly biased, marketing material. In contrast to these three, this work introduces a simulation approach that facilitates virtual retinal imaging to demonstrate the lens performance across different scenarios. Some advantages of this approach include easier adjustment, higher reproducibility, more flexibility, and the elimination of the need for specialized equipment.
When simulating optical performance, a monochromatic characterization with a narrowband spectrum is insufficient. Real vision is strongly polychromatic, and the human eye exhibits significant levels of both longitudinal chromatic aberration (LCA) and transverse chromatic aberration (TCA). LCA is quantified as 2.5 diopter (D) over the entire visible spectrum,13^,^14 whereas the average magnitude of subjective foveal TCA is reported as 0.82 arcmin.15 Multiple works show decreased contrast sensitivity and visual acuity for broadband stimuli compared with narrowband sources.16^–^18 Roorda et al. directly demonstrated an improvement of acuity and contrast sensitivity with LCA and TCA being corrected for polychromatic light.19 Moreover, several studies show LCA increasing the depth of focus.17^,^20^,^21
In addition to aberrations, color contrast plays a significant role in the perception of disturbing effects and image sharpness. The complex interplay between color and luminance, influenced by psychophysical phenomena, such as the Hunt effect, the Bezold-Brücke shift, or the Helmholtz-Kohlrausch effect, further complicates visual appearance.22^,^23
It is noteworthy that there have been recent efforts to compare polychromatic IOL performance in vitro.24^–^28 Notably, the updated International Organization for Standardization (ISO) 11979-2:202429 standard for in vitro measurements now also mandates a broadband white spectrum for optical characterization. In the following sections, an in silico approach is introduced that accounts for a wide spectrum and the chromatic behavior of all optical elements.
Methods
Lenses
This work compares three different lenses, one monofocal and two refractive EDoF IOLs. All three evaluated IOLs are biconvex, hydrophobic, and have a common refractive power of 20 D.
The monofocal AcrySof IQ (Alcon Laboratories Inc., Fort Worth, TX) with its aspheric design serves as a reference lens. The AcrySof IQ Vivity (Alcon Laboratories Inc.) incorporates the X-Wave-technology, a patented non-diffractive wavefront-shaping design30 that extends the depth of focus to 1.5 D.31 This effect is achieved through an elevated surface region between the radial position r = 0*.55 mm and r = 1.1 mm on the anterior surface.32 Both Alcon lenses share a refractive index of n = 1.5542 and an Abbe number of V = 37.31^,^33 The second EDoF IOL, the LuxSmart (Bausch & Lomb Inc., Bridgewater Township, NJ), features an innermost zone on the anterior side that generates a combination of fourth- and sixth-order spherical aberration of opposite signs.31 This is followed by a transition region and an outer aberration-free zone. The EDoF of the LuxSmart is specified as 1.5 D31 and its optic material as n = 1.*540 and V = 43.31^,^34
The virtual lens models used in this study originate from our previous work, where they were generated through a three-dimensional measurement and subsequent data processing. Further details on the measurement and processing procedure are available in Mendroch et al.,35 whereas a second publication32 presents the resulting lens properties, surface profiles, and refractive power distributions. For clarity and accessibility, the power profiles from these results are also presented in Figures 1, 2, and 3.
Simulated radial optical power profile of the Alcon IQ lens.
Simulated radial optical power profile of the Alcon IQ Vivity lens.
Simulated radial optical power profile of the Bausch & Lomb LuxSmart lens.
Simulator
The custom-built simulator enhances the sequential raytracer from the previous work.32 Its features include the ability to model various spatial, spectral, and angular light distributions, as well as different types of dispersive and non-dispersive elements such as lenses, filters, apertures, and detectors. A new feature is the capability to render intensity and full-color images on a detector area. This is accomplished by propagating the entire visible wavelength spectrum toward the detector and rendering its spatially varying spectral intensities into a representable image. In doing so, the simulator replicates both the brightness and color impression, aiming to create a realistic simulation of the patient's perspective. The following equation models the dispersive behavior of both the eye and the IOL:
In this equation, coefficients A and B are fitted for each material so the model aligns with the specified center index and Abbe number for the FdC spectral wavelengths. A value of was chosen for a moderately steep dispersion curve in the violet region, which is a compromise between the Cauchy model ( ) and the Herzberger formula ( ).36 A ray bending approach approximates the diffraction effects inside the eye, as outlined in Appendix C. Convolutional image simulation is also available and explained in detail in Appendix B. The full raytracer is open source and available online.37
Eye Model
The following simulations utilize the Arizona eye model developed by Schwiegerling.14 This eye model accurately matches on- and off-axis aberration levels from clinical data and accounts for wavelength and adaptation dependencies. Other researchers have already used this eye model to simulate a virtual phakic or pseudophakic eye.38^–^41
The IOL is placed at a specific anterior chamber depth (ACD). This value is provided as 3.91 mm for the LuxSmart and 4.23 mm for both Alcon models.33 Although the first value worked well for the LuxSmart, the latter values were adapted to 4.10 mm (IQ Vivity) and 4.15 mm (IQ) to better match results of Azor et al.42 This small difference can be attributed to differences in the eye model or an imprecise knowledge of the refractive index. Figure 4 illustrates the pseudophakic eye geometry with the Alcon IQ within the raytracer. In our imaging approach, the retina is modeled as a rectangular detector plane. For small angles, such as ±2 degrees, there is only a negligible difference between a plane and a curved retinal surface.
Simulation geometry with the Alcon IQ IOL inside the Arizona eye model.
Color Rendering
For a realistic representation of simulated color images, accurate color rendering is essential. However, the standard red-green-blue (sRGB) color space, widely used in digital media, can only reproduce a limited subset of all human visible colors. To address this limitation, we adopt an approach that preserves image brightness and hue while reducing color saturation. A color transformation with the so-called perceptual rendering intent desaturates the image with a uniform scaling factor and ensures that all colors fit within the target color space. Although this process reduces the overall color intensity, it preserves the relative saturation relationships within the image. Without this adjustment, incorrect saturation ratios could lead to perceptual brightness changes due to the Helmholtz-Kohlrausch effect. The specific computation method is detailed in Appendix A, which also provides an overview of various color spaces.
Printed media have a different, yet also limited color space. For optimal color representation, it is recommended to view this publication on a digital device with high color accuracy and high sRGB coverage.
Image Simulation
Photic phenomena are effectively represented through the raytracing of pinhole images. Real-life equivalences are the headlights of a car or small dots on a monitor screen. The pinholes are modeled as a circular, Lambertian radiator and emitting a D65 daylight spectrum. The simulations are performed with 60 million rays for each pinhole image. All images were rendered in sRGB with the perceptual rendering intent described in the Appendix A.
Next, resolution charts are an effective method to illustrate the impact of lens model and viewing condition. These types of visualizations are the most accessible for potential patients, as they intuitively demonstrate the effects of acuity and aberrations. The target simulation uses a modified version of a digital recreation43 of the US Air Force (USAF)-1951 resolution test chart.44 The chart covers a larger field of view and has significantly more structural details than the pinhole. Achieving a similar image quality requires a considerably higher number of rays. Furthermore, even more rays are required to simulate a bright image background. Hence, polychromatic image convolution is utilized to generate the target image, which reduces computational effort and simultaneously minimizes sampling noise. This methodology is described in Appendix B.
A pupil-dependent assessment offers a more precise understanding of both day and night vision scenarios. In the photopic case, the text and lines are rendered black on a white background, whereas in the mesopic case, white text on a black background is simulated. The distinction between the two scenes is crucial, as aberrations affect the image differently in each context. Photic phenomena are much more prominent against a black background, where the aberrations cause an enlargement of structures. Conversely, on a white background, dark structures appear to shrink, and their contrast diminishes significantly.
Results
Pinhole Images
Figure 5 shows the pinhole image results for a pupil diameter of 3.0 mm and Figure 6 for 4.5 mm. Similar to the works of Azor et al.42^,^45 the pinhole occupies a visual angle of approximately 3.4 arcmin. This corresponds to the size of a 10 cm diameter headlight at 100 m viewing distance (approximately 0.0 D) and a dot of 0.67 mm diameter at 0.67 m (equal to 1.5 D) monitor viewing distance. High resolution versions without potential color artifacts from the proofing process are available in an external repository.46
Polychromatic simulation of a 3.4 arcmin pinhole for a 3.0 mm photopic pupil.
Polychromatic simulation of a 3.4 arcmin pinhole for a 4.5 mm mesopic pupil.
In the photopic situation depicted in Figure 5, the monofocal IQ lens shows the pinhole sharply with no noticeable glare in the distance vision case. However, both LuxSmart and IQ Vivity exhibit significant glare, with the Alcon lens showing slightly more. In intermediate vision, the image produced by the monofocal lens becomes completely out of focus. The IQ Vivity lens presents a halo similar in size to its monofocal counterpart, but contrasts with a slightly defocused pinhole image at its center and a darker ring surrounding it. The LuxSmart lens renders the pinhole more sharply than the IQ Vivity lens, with noticeably less glare. Whereas in the far vision scenario the pinhole appears slightly greenish or orangish for all lenses, in the intermediate scenario it takes on a more bluish hue. At 1.50 D, a distinct color gradient in the halos and glares suggests the presence of chromatic aberration.
In the mesopic simulation in Figure 6, the monofocal lens exhibits slight glaring in distance vision and a more defocused image for the intermediate range compared to the photopic case. The IQ Vivity produces less glare in far vision compared to the photopic simulation, yet it still remains larger than that of the IQ lens. In intermediate vision, the halo is larger compared to the smaller pupil diameter, yet similar in dimensions to the IQ model.
The LuxSmart demonstrates the largest glare among all three lenses for distant vision but exhibits the smallest glare in intermediate vision. Compared to the photopic simulation, there is a noticeable increase in chromatic aberration for all lenses.
Resolution Charts
Resolution charts for a photopic pupil diameter of 3.0 mm are presented in Figure 7, whereas those for a 4.5 mm mesopic pupil can be found in Figure 8. This target occupies a visual open angle of 2 degrees relative to the eye. A point spread function is calculated for object distances of 100 m (≈ 0.0 D), 1.33 m (0.75 D), and 0.67 m (1.5 D). High resolution versions of these figures are available.46
Daylight simulations of the USAF resolution target. The line spacing of element 2 in group −2 corresponds to 10 c/deg.
Night-time simulations of the USAF resolution target. The line spacing of element 2 in group −2 corresponds to 10 c/deg.
Among all three lenses, the monofocal Alcon IQ demonstrates the best performance at 0.0 D in terms of sharpness and minimal aberrations. In the mesopic scenario, a slight amount of glare becomes apparent due to residual spherical aberration. For the other two vergences, the image becomes progressively more defocused, irrespective of pupil diameter. At 0.75 D, only some lines are discernible, and at 1.50 D, no lines are recognizable.
The IQ Vivity lens reproduces nearly all lines for distance vision under photopic conditions, although its performance in terms of acuity and contrast is inferior to that of the monofocal model. At 0.75 D, there is a slight increase in acuity. However, at the highest vergence, sharpness declines and brightness fringes become significantly more pronounced. In the mesopic scenario, the target remains nearly as sharp as with the monofocal model, although a slight glare is seen. However, as vergence increases, glare becomes more pronounced and sharpness significantly diminishes. At 1.50 D, the lines in group −1 are barely distinguishable. At this point, there is a clear overlay of a nearly in-focus blue image and a blurred, greenish image.
The LuxSmart lens produces similarly sharp images across all vergences in photopic vision, with the best performance at 1.50 D, despite the presence of large brightness fringes. In the mesopic case, acuity peaks at 0.75 D. Elements of group −1 remain recognizable across the other two vergences, however, there is an increase in glaring. This is especially true at 1.50 D, where significant chromatic aberration is evident.
Discussion
Image Quality
Both EDoF lenses clearly demonstrate an increased depth of focus compared to the monofocal model. As illustrated in Figures 7 and 8, at vergences of 0.75 D and 1.50 D, both lenses exhibit significantly more acuity than the monofocal reference model. Whereas the monofocal lens provides superior acuity at 0.0 D, the EDoF models still deliver sufficient image quality with only a low amount of aberrations. Another important aspect is the presence of glares and halos, which are best observed in the pinhole images in Figures 5 and 6. The EDoF lenses render the pinhole more sharply at shorter distances, and the brightness fringes are of the same or smaller size with reduced intensity. Thus, both the IQ Vivity and LuxSmart not only provide distinctly improved intermediate vision but also display comparable levels of visual disturbances. Clinical studies confirm these findings, indicating both enhanced intermediate vision and similar photic phenomena for these lenses compared with a monofocal intraocular lens.47^–^50
The Table shows subjective visual quality scores summarizing the resolution chart findings. The two lenses differ in several aspects. The IQ Vivity exhibits an EDoF character under daylight conditions, but behaves more like a monofocal lens under night conditions, as the far vision image is nearly free of aberrations. Nonetheless, a partial EDoF effect remains, because intermediate vision acuity does not decrease as sharply when compared with the monofocal lens. For mesopic vision, the glare is almost identical to that of the monofocal model. This similarity is due to the outer lens areas having an almost identical power profile, as detailed in the previous publication.32
With the LuxSmart during day vision, all three vergences demonstrate high image quality. However, in mesopic conditions, a vergence of 0.75 D stands out with the sharpest vision. At night, the LuxSmart outperforms the IQ Vivity in terms of depth of focus, despite exhibiting more glare in the distance vision image.
These findings align with the positive characteristics that manufacturers attribute to their lenses, as described in the previous article.32 Whereas one advantage of the IQ Vivity is its nearly aberration-free performance for night-driving, the LuxSmart excels with an EDoF, irrespective of the lighting conditions.
Color Effects
Previous images exhibit distinct colored regions, which result from wavelength-dependent and dispersive behavior. A green narrowband stimulus would only reproduce the green-containing areas without other colors such as red and blue. This clearly demonstrates the importance of incorporating the entire human-visible spectral range in image formation.
Color significantly contributes to the subjective visual impression, as structures are more easily distinguished through color contrast. This scenario is depicted in Figure 9. The simulation of the Alcon IQ from Figure 8 for pupil diameter P = 4*.*5 mm and vergence 1.50 D is presented using only lightness information on the left, and including color information on the right side. Whereas, in the left, the image is only blurry, uniform areas are visible, the right image reveals several distinct elements. The large upper square is apparent, as well as the rough outlines of numbers and group elements. This is possible because the blue light components are nearly in focus, which is also evident in the pinhole image in Figure 6. In reality, the visual impression would be even stronger, as an image with reduced chroma is displayed here.
Perceptual difference between a lightness and color (sRGB Perceptual RI) image.
As outlined in Appendix A, the type of color conversion and visualization is crucial for results close to reality. Figure 10 shows the important role of rendering intents (RIs). The pinhole image of the Alcon IQ Vivity from Figure 6, for the case of a 4.5 mm pupil and 1.50 D vergence, is displayed in 3 different representations. Going from left to right, these are a lightness image, sRGB with absolute, and perceptual RI. The perceptual RI image correctly reproduces the lightness, whereas the right image deviates noticeably. This is especially visible in the blue ring, which appears much brighter due to its saturation and the Helmholtz-Kohlrausch effect. The sharp edge of this blue ring is due to a high saturation gradient and has no basis in reality. Last, the absolute colorimetric rendering intent also incorrectly reproduces the lightness ratio between the bluish core and the halo.
Different color representations for the IQ Vivity pinhole simulation.
Comparison With Earlier Work
Pinhole Images
Azor et al.45 conducted a direct comparison of pinhole images for the LuxSmart and IQ Vivity lens. These findings are also available in a brochure published by Bausch & Lomb.51 The experimental setup, including pupil diameter, viewing angle, and vergences, is consistent with the mesopic simulations depicted in Figure 6, except for a narrowband green light source. Consistent with our findings, the LuxSmart exhibits slightly brighter and larger glare compared to the IQ Vivity lens for distance vision. In addition, under intermediate vision conditions, the Bausch & Lomb lens presents a greater degree of glare compared to the 0.0 D focus, and the IQ Vivity shows a significant halo. In another study by Azor et al.,42 their Figure 2 presents the photopic scenario for distance vision. In this figure, both lenses clearly depict the pinhole, yet the glare is significantly more pronounced for the IQ Vivity lens. The results align with the findings of the work at hand.
Fernández-Vega-Cueto et al.52 conducted measurements of pinhole images for the IQ Vivity lens. In their paper, it is evident that for far vision, the glare with a 3.0 mm pupil diameter is greater than observed for 4.5 mm, which is consistent with our results.
In the work by Baur et al.,53 a comparison of disturbing effects for a 4.5 mm pupil is presented. The IQ Vivity lens displays slightly larger glare than the IQ lens from Alcon. However, in both instances, the disturbing effects are minimal. These observations conform with our findings and align with the measurements provided by Alcon in their “Optical Bench Halo Measurements” brochure section.54
The results obtained in the study at hand are consistent with those reported in the previously mentioned publications. Differences in certain aspects can be attributed to the use of a wider spectrum. Furthermore, some works utilize a logarithmic representation of brightness rather than a model based on human visual sensitivity.
Resolution Charts
Oltrup et al.55 conducted simulations of resolution target images using the measured modulation transfer function (MTF) of the Alcon IQ. Of particular relevance is Figure 7B, which depicts the results for a 4.5 mm pupil and an object angle of 2 degrees. Although the assessments are monochromatic, the simulation conditions are otherwise comparable. The corresponding results in Figure 8 show minimal color effects, therefore allowing for direct comparison of the images. Overall, the simulations convey a similar impression of sharpness.
The study by Schmid et al.31 presents a comparison between LuxSmart and IQ Vivity lenses for distance vision, with Figure 4a being particularly relevant to our analysis. Our findings, as presented in Figures 7 and 8, align with theirs by demonstrating similar sharpness for both lenses when the pupil diameter is 3 mm. At a pupil size of 4.5 mm, the IQ Vivity lens clearly outperforms the LuxSmart, which exhibits noticeable blur.
Polychromatic target imaging is explored in the works of Łabuz et al.24 and Montagud-Martínez et al.26 Although these studies examine different lens models, they reveal the general dispersive properties of IOLs. In some figures, a double image with a white-greenish core and a violet glare is apparent, whereas others display combinations of white-yellow to blue, or white-cyan to red.
The LuxSmart lens product brochure51 provides an area of MTF measurement for a 3 mm pupil and different defocus values, comparing it to the IQ Vivity lens. This comparison aligns with the analysis in Figure 7, showing comparable acuity at vergences of 0.0 D and 0.75 D, and demonstrating superior sharpness for the Bausch & Lomb lens at 1.5 D.
The work by Azor et al.42 provides an area of MTF values for the two EDoF lenses across a wide defocus range in Figure B. In the figure, the LuxSmart lens achieves a higher value at 1.5 D for a 3.0 mm pupil, while exhibiting values comparable to those of the IQ Vivity lens at 0.0 D and 0.75 D. Under mesopic conditions, the IQ Vivity records a higher area MTF value at 0.0 D but falls short compared to the LuxSmart at the other two vergences. The sharpness and clarity of the line groups mirror the behavior observed in our simulations.
Limitations
The previous work32 discusses the data quality of the lens models. Besides the described deviations in surface shape and refractive index, the results are also influenced by the ACD constant. Although the equivalent constants inside the Arizona eye model are unknown, the selected values most certainly fall inside the expected postoperative positional fluctuation range. All these aforementioned errors lead to changes in global and local optical power, therefore influencing the beam path, shape of the point spread function (PSF), and hence the retinal image.
Differences to the standard setup further complicate the comparison between in vitro measurements and this work's results. Both models differ not only in geometry and materials, but in measurement conditions and procedure as well. Earlier versions of the ISO 1197929 demanded a green, narrowband stimulus instead of a broadband spectrum. Furthermore, the object distance is not changed by moving the object, but instead approximated by moving the detector.
The simulator developed does not replicate the complete physics of light. The transmission behavior of the eye and the IOL was not simulated, nor was the influence of stray light or multiple reflections. However, it is to be expected that these influences have only a minor effect on image formation under these experimental conditions. The influence of wave optics is only approximated. Raytracing with the HURB approach from Appendix C implies that the aperture is the primary source of diffraction within the eye and the lens shape does not contribute significantly. The smooth profiles of the monofocal lens and the LuxSmart do not indicate any shape-induced diffraction effects. However, the IQ Vivity features a wavefront shaping design that consists of a more complex annular structure with multiple linear segments.30^,^32 But upon closer inspection, the minimum width of 100 µm and height differences of 1 µm correspond to a small angular change of 0.6 degrees relative to the base profile. The aperiodic design with wide, shallow segments and smooth transitions similarly suggests that significant diffraction effects are unlikely. Based on these characteristics, a geometric-optical description should suffice for accurate simulation results. Nevertheless, we cannot conclusively exclude a slight impact of wave-optical effects on the through-focus energy distribution. But such deviations are expected to be smoothed out due to additional aberrations, especially spherical aberration and chromatic dispersion.
It is worth emphasizing that a simulation-based approach cannot replace clinical studies. Only in a real eye can the effects of its true geometry be determined, including the exact postoperative position and alignment of the IOL. Last, another missing but indisputable factor for visual outcomes is neuroadaptation.
Conclusions
This work showcased the method and the results for simulating realistic retinal images. It became evident how relevant the wavelength-dependent behavior is, together with the importance of color in human perception.
The simulation-based approach has proven to be a valuable tool in understanding IOLs. The developed methods successfully characterize IOLs and highlight the differences between two EDoF lenses. This includes technical aspects such as surface structure, refractive power profile, and beam path, as well as the visual impressions through pinhole images or resolution charts. Whereas technical data are crucial for developers or ophthalmologists, simulated images provide the most accessible and comprehensible references for patients.
In the future, the influences of decentration, variation of the anterior chamber depth, or tilt could also be investigated. Another possibility is to simulate a broader range of lenses or tailor the simulation to a patient's specific eye geometry. The simulation offers such flexibility, providing even more application opportunities. Thus, this approach serves as a valuable complement to other methods, offering additional insights into the functionality of IOLs.
The reference list from the paper itself. Each links out to its DOI / PubMed record.
- 1Kondylis G, Klavdianou O, Palioura S. Multifocal and extended depth of focus intraocular lenses. Ann Eye Sci. 2019; 4: 5.
- 2Gil MÁ, Varón C, Cardona G, Buil JA. Far and near contrast sensitivity and quality of vision with six presbyopia correcting intraocular lenses. J Clin Med. 2022; 11(14): 4150.35887913 10.3390/jcm 11144150 PMC 9316344 · doi ↗ · pubmed ↗
- 3Hovanesian JA, Jones M, Allen Q. The Vivity extended range of vision IOL vs the Pan Optix trifocal, Re Stor 2.5 active focus and Re Stor 3.0 multifocal lenses: a comparison of patient satisfaction, visual disturbances, and spectacle independence. Clin Ophthalmol. 2022; 16:145–152.35082481 10.2147/OPTH.S 347382 PMC 8785133 · doi ↗ · pubmed ↗
- 4Asena L, Kırcı Dogan I, Oto S, Dursun Altınors D. Comparison of visual performance and quality of life with a new nondiffractive EDOF intraocular lens and a trifocal intraocular lens. J Cataract Refract Surg. 2023; 49(5): 504–511.36700928 10.1097/j.jcrs.0000000000001142 · doi ↗ · pubmed ↗
- 5Guarro M, Sararols L, Londoño GJ, et al. Visual disturbances produced after the implantation of 3 EDOF intraocular lenses vs 1 monofocal intraocular lens. J Cataract Refract Surg. 2022; 48(12): 1354–1359.35786815 10.1097/j.jcrs.0000000000000988 · doi ↗ · pubmed ↗
- 6Scheepers MA, Hall B. Randomized and double-blind comparison of clinical visual outcomes of 2 EDOF intraocular lenses. J Cataract Refract Surg. 2023; 49(4): 354–359.36975011 10.1097/j.jcrs.0000000000001113 · doi ↗ · pubmed ↗
- 7Fernandes MC, Nunomura CY, Messias A. Visual performance and photic disturbances with diffractive and nondiffractive EDOF intraocular lenses using mini-monovision: randomized trial. J Cataract Refract Surg. 2024; 50(2): 153–159.37847119 10.1097/j.jcrs.0000000000001330 · doi ↗ · pubmed ↗
- 8Reinhard T, Maier P, Böhringer D, et al. Comparison of two extended depth of focus intraocular lenses with a monofocal lens: a multi-centre randomised trial. Graefes Arch Clin Exp Ophthalmol. 2020; 259(2): 431–442.32915276 10.1007/s 00417-020-04868-5PMC 7843553 · doi ↗ · pubmed ↗