Association Between Serum Anion Gap and Risk of Postoperative Delirium in Patients Undergoing Gastric Surgery in ICU: A Retrospective Study From the MIMIC‐IV Database
Simin Yang, Xinwei Su

TL;DR
Higher serum anion gap levels are linked to increased risk of postoperative delirium in ICU patients after gastric surgery.
Contribution
Identifies serum anion gap as a novel biomarker for predicting postoperative delirium risk in ICU gastric surgery patients.
Findings
Elevated serum anion gap is independently associated with increased postoperative delirium risk.
Nonlinear positive correlation exists between serum anion gap levels and delirium risk.
Serum anion gap has limited predictive value with an AUC of 0.606 for postoperative delirium.
Abstract
This study aimed to investigate the association between serum anion gap (AG) levels and postoperative delirium (POD) incidence in intensive care unit (ICU) patients undergoing gastric surgery. We conducted a retrospective study using data from the Medical Information Mart for Intensive Care IV (MIMIC‐IV) database. Patients who underwent gastric surgery were included to investigate the potential association between serum AG and POD risk. Restricted cubic spline (RCS) regression was used to evaluate nonlinear relationships, and receiver operating characteristic (ROC) curves were used to assess predictive performance. Subgroup and sensitivity analyses were performed to verify the reliability and consistency of the results. Among the 2467 ICU patients who underwent gastric surgery, elevated serum AG levels were independently associated with increased POD risk. The RCS analysis revealed a…
Genes, proteins, chemicals, diseases, species, mutations and cell lines named across the full text — each resolved to its canonical identifier and authoritative record.
Click any figure to enlarge with its caption.
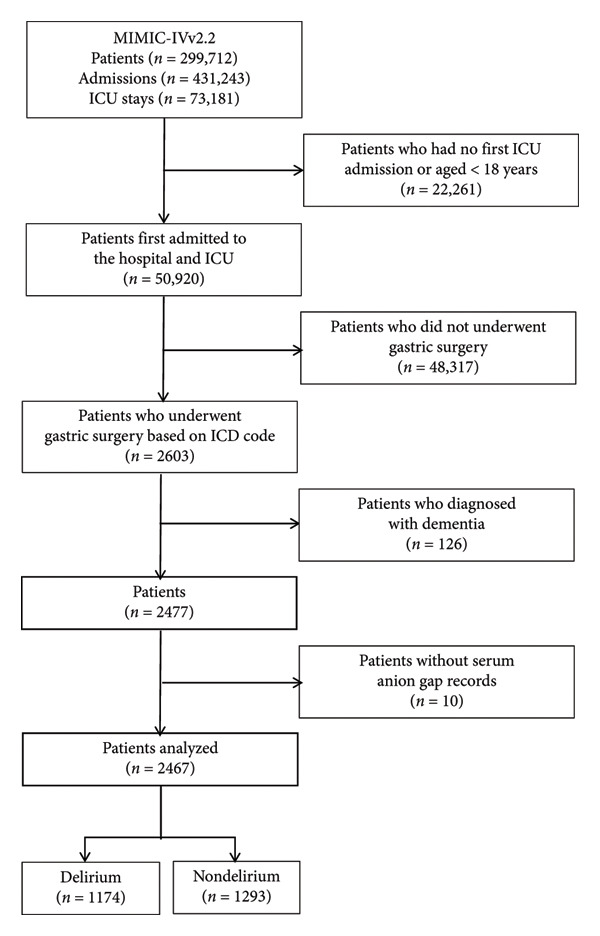 Figure 1
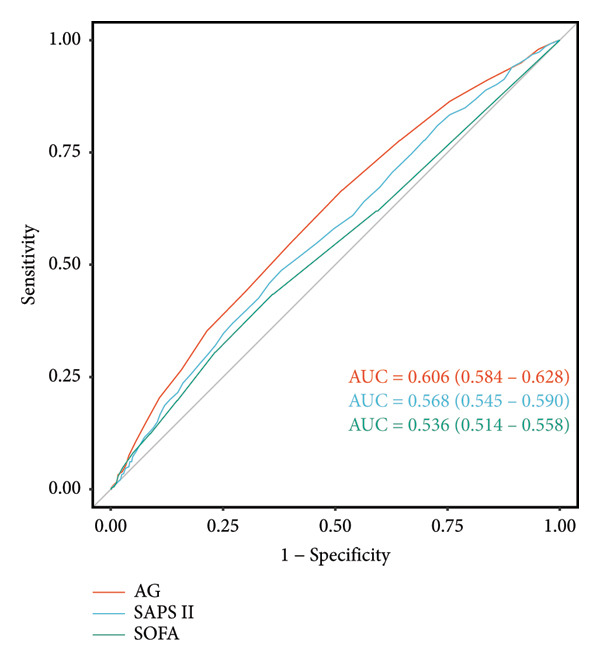 Figure 3
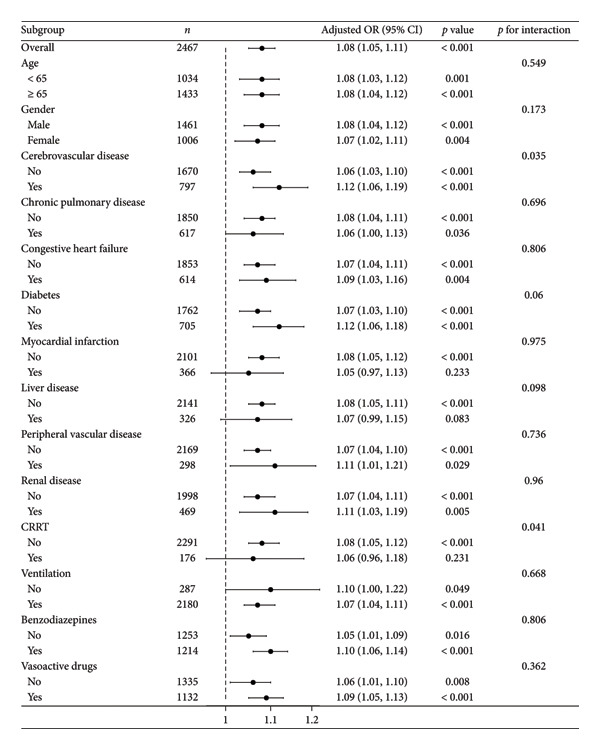 Figure 4
| Variables | Overall ( | Missing data | Nondelirium ( | Delirium ( |
|
|---|---|---|---|---|---|
| Age (years) | 68 (57, 78) | — | 68 (56, 79) | 68 (57, 78) | 0.796 |
| Gender, | — | 0.056 | |||
| Male | 1461 (59.22%) | 789 (61.02%) | 672 (57.24%) | ||
| Female | 1006 (40.78%) | 504 (38.98%) | 502 (42.76%) | ||
| Cerebrovascular disease, | — | < 0.001 | |||
| No | 1670 (67.69%) | 977 (75.56%) | 693 (59.03%) | ||
| Yes | 797 (32.31%) | 316 (24.44%) | 481 (40.97%) | ||
| Chronic pulmonary disease, | — | 0.683 | |||
| No | 1850 (74.99%) | 974 (75.33%) | 876 (74.62%) | ||
| Yes | 617 (25.01%) | 319 (24.67%) | 298 (25.38%) | ||
| Congestive heart failure, | — | 0.117 | |||
| No | 1853 (75.11%) | 988 (76.41%) | 865 (73.68%) | ||
| Yes | 614 (24.89%) | 305 (23.59%) | 309 (26.32%) | ||
| Diabetes, | — | 0.349 | |||
| No | 1762 (71.42%) | 934 (72.24%) | 828 (70.53%) | ||
| Yes | 705 (28.58%) | 359 (27.76%) | 346 (29.47%) | ||
| Myocardial infarction, | — | 0.925 | |||
| No | 2101 (85.16%) | 1102 (85.23%) | 999 (85.09%) | ||
| Yes | 366 (14.84%) | 191 (14.77%) | 175 (14.91%) | ||
| Liver disease, | — | 0.987 | |||
| No | 2141 (86.79%) | 1122 (86.77%) | 1019 (86.80%) | ||
| Yes | 326 (13.21%) | 171 (13.23%) | 155 (13.20%) | ||
| Peripheral vascular disease, | — | 0.787 | |||
| No | 2169 (87.92%) | 1139 (88.09%) | 1030 (87.73%) | ||
| Yes | 298 (12.08%) | 154 (11.91%) | 144 (12.27%) | ||
| Renal disease, | — | 0.365 | |||
| No | 1998 (80.99%) | 1056 (81.67%) | 942 (80.24%) | ||
| Yes | 469 (19.01%) | 237 (18.33%) | 232 (19.76%) | ||
| SAPS II | 37 (29, 46) | — | 35 (28, 44) | 38 (30, 48) | < 0.001 |
| SOFA | 1.00 (0.00, 3.00) | 9 (0.36%) | 1.00 (0.00, 2.00) | 1.00 (0.00, 3.00) | 0.001 |
| AG (mmol/L) | 14.0 (12.0, 17.0) | — | 14.0 (12.0, 16.0) | 15.0 (13.0, 18.0) | < 0.001 |
| BUN (mg/dL) | 19 (13, 32) | 1 (0.04%) | 19 (13, 34) | 19 (13, 30) | 0.040 |
| CA (mmol/L) | 8.30 (7.80, 8.80) | 2 (0.08%) | 8.30 (7.70, 8.70) | 8.30 (7.80, 8.80) | 0.003 |
| CL (mmol/L) | 105 (101, 108) | — | 105 (101, 109) | 104 (100, 108) | < 0.001 |
| CR (mg/dL) | 0.90 (0.70, 1.30) | — | 0.90 (0.70, 1.30) | 0.90 (0.70, 1.40) | 0.146 |
| GLU (mg/dL) | 133 (109, 169) | — | 129 (107, 164) | 137 (111, 175) | < 0.001 |
| HB (mg/dL) | 10.60 (9.00, 12.40) | 1 (0.04%) | 10.30 (8.80, 12.00) | 11.00 (9.20, 12.80) | < 0.001 |
| PLT (× 109/L) | 199 (144, 267) | 1 (0.04%) | 207 (148, 276) | 192 (143, 256) | < 0.001 |
| K (mmol/L) | 4.10 (3.70, 4.50) | — | 4.10 (3.70, 4.50) | 4.10 (3.70, 4.50) | 0.506 |
| NA (mmol/L) | 139.0 (136.0, 142.0) | — | 139.0 (136.0, 142.0) | 139.0 (136.0, 142.0) | 0.606 |
| WBC (× 109/L) | 11.3 (8.2, 15.3) | 1 (0.04%) | 11.1 (7.9, 14.8) | 11.6 (8.6, 15.7) | < 0.001 |
| CRRT | — | < 0.001 | |||
| No | 2291 (92.87%) | 1238 (95.75%) | 1053 (89.69%) | ||
| Yes | 176 (7.13%) | 55 (4.25%) | 121 (10.31%) | ||
| Ventilation | — | < 0.001 | |||
| No | 287 (11.63%) | 215 (16.63%) | 72 (6.13%) | ||
| Yes | 2180 (88.37%) | 1078 (83.37%) | 1102 (93.87%) | ||
| Benzodiazepines | — | < 0.001 | |||
| No | 1253 (50.79%) | 710 (54.91%) | 543 (46.25%) | ||
| Yes | 1214 (49.21%) | 583 (45.09%) | 631 (53.75%) | ||
| Vasoactive drugs | — | < 0.001 | |||
| No | 1335 (54.11%) | 840 (64.97%) | 495 (42.16%) | ||
| Yes | 1132 (45.89%) | 453 (35.03%) | 679 (57.84%) | ||
| Los ICU | 8 (3, 18) | — | 4 (2, 11) | 13 (6, 22) | < 0.001 |
| Los hospital | 21 (14, 33) | — | 17 (10, 27) | 25 (18, 38) | < 0.001 |
| Variable | Model 1 | Model 2 | Model 3 | Model 4 | ||||||||
|---|---|---|---|---|---|---|---|---|---|---|---|---|
| OR | (95% CI) |
| OR | (95% CI) |
| OR | (95% CI) |
| OR | (95% CI) |
| |
| AG (continuous) | 1.09 | (1.07, 1.12) | < 0.001 | 1.08 | (1.06, 1.10) | < 0.001 | 1.07 | (1.04, 1.10) | < 0.001 | 1.08 | (1.05, 1.11) | < 0.001 |
| AG (quintiles) | ||||||||||||
| Q1 (5, 12) | Ref | Ref | Ref | Ref | Ref | Ref | Ref | Ref | ||||
| Q2 (12, 14) | 1.49 | (1.15, 1.92) | 0.002 | 1.43 | (1.10, 1.86) | 0.008 | 1.41 | (1.07, 1.84) | 0.013 | 1.44 | (1.09, 1.90) | 0.010 |
| Q3 (14, 17) | 1.87 | (1.48, 2.37) | < 0.001 | 1.69 | (1.32, 2.16) | < 0.001 | 1.56 | (1.21, 2.02) | < 0.001 | 1.60 | (1.23, 2.08) | < 0.001 |
| Q4 (17, 41) | 2.96 | (2.32, 3.78) | < 0.001 | 2.62 | (2.03, 3.38) | < 0.001 | 2.42 | (1.82, 3.23) | < 0.001 | 2.50 | (1.86, 3.36) | < 0.001 |
|
| < 0.001 | < 0.001 | < 0.001 | < 0.001 | ||||||||
Peer Reviews
No public reviews on file for this paper yet. If you reviewed it on a platform where reviews are public (OpenReview, ICLR, NeurIPS, ICML), you can paste yours below so the community can read it here.
Videos
No videos yet. Explain this paper in a talk, walkthrough, or lecture? Add one.
Taxonomy
TopicsRenal function and acid-base balance · Chemical and Physical Studies · Vitamin C and Antioxidants Research
1. Introduction
Postoperative delirium (POD) is an acute neuropsychiatric syndrome characterized by the sudden onset of fluctuating disturbances in consciousness, attention, perception, and cognition [1]. As the most common surgical complication in older patients [2], POD typically arises from multifactorial etiologies including medication effects, metabolic derangements, and underlying medical conditions [3, 4]. This transient yet serious condition carries significant clinical consequences, being associated with prolonged hospitalization, accelerated cognitive decline, increased mortality risk, and substantial reductions in quality of life [5, 6].
Serum anion gap (AG) has gained recognition as an important prognostic biomarker for postoperative complications, with established correlations between elevated serum AG levels and adverse surgical outcomes [7–10]. In the intensive care unit (ICU) setting, serum AG measurement has become routine practice due to ubiquitous availability of blood gas analyzers. As a key metric of acid–base balance, increased serum AG typically reflects metabolic acidosis and has demonstrated prognostic value across multiple acute and chronic conditions [11, 12]. While initial studies focused on serum AG’s association with mortality in critically ill populations, more recent investigations have expanded these findings to include neurological outcomes, particularly in patients with impaired consciousness [13, 14]. These collective observations suggest that serum AG may represent a valuable predictor for POD.
The clinical significance of this potential association is underscored by Yamato et al.’s report [15], which reported a 4.5% POD incidence among gastric cancer surgery patients, highlighting the need for reliable risk stratification tools in this population. While the AG has been explored as a prognostic marker in other critical care contexts [16], to our knowledge, this is the first study to specifically investigate the association between preoperative serum AG levels and the risk of POD in ICU patients undergoing gastric surgery. To address this critical knowledge gap, we performed a comprehensive retrospective analysis utilizing the Medical Information Mart for Intensive Care IV (MIMIC‐IV) database, which provides detailed physiological and outcome data for critically ill surgical patients.
2. Methods
2.1. Data Source and Ethics Statement
The MIMIC‐IV database (Version 2.2), developed by the Computational Physiology Laboratory at the Massachusetts Institute of Technology (MIT), is an open‐access resource comprising de‐identified clinical data from patients treated at the Beth Israel Deaconess Medical Center (BIDMC) in Boston, Massachusetts, USA. This comprehensive dataset spans patient admissions from 2008 to 2019. In accordance with stringent patient privacy protocols, informed consent was not required for data collection. A member of the research team completed the Collaborative Institutional Training Initiative (CITI) program, specifically the course “Data or Specimens Only Research,” which addresses ethical considerations in human subjects research. The author Xinwei Su obtained certification (CITI Name ID: 13066813; Record ID: 61100760) and was subsequently granted access to the MIMIC‐IV database. The study design and implementation strictly adhered to established guidelines and regulatory standards, including the principles of the Declaration of Helsinki, ensuring ethical compliance throughout the research process.
2.2. Population Selection Criteria
The study included patients aged 18 years or older undergoing gastric surgery, identified through International Classification of Disease (ICD) codes (Supporting Data Table S1) from the MIMIC‐IV database (Version 2.2). The exclusion criteria encompassed: (1) patients younger than 18 years at first admission, (2) ICU stays shorter than 24 h, and (3) patients lacking serum AG records. After applying these criteria, 2467 patients qualified for study inclusion. Figure 1 illustrates the patient screening process.
Flowchart of patient selection. Flowchart for selecting patients from the MIMIC‐IV database. ICU, intensive care unit; ICD, International Classification of Disease.
2.3. Data Extraction
Data were extracted using Structured Query Language (SQL) and Navicat Premium software (Version 16). Serum AG served as the primary study variable. The analysis included potential confounding variables, such as demographic information, comorbid conditions, laboratory results, and clinical scoring systems. The primary outcome was delirium occurrence after gastric surgery during ICU hospitalization. Delirium was diagnosed using the CAM‐ICU scoring tool, which evaluates four characteristics: (1) acute mental status changes or fluctuations; (2) inattention; (3) disorganized thinking; and (4) altered level of consciousness. Medical staff documented these characteristics on the “chartevents” form. According to the CAM‐ICU scale, a diagnosis of delirium (CAM‐ICU‐positive) requires the patient to display characteristics 1 and 2, along with either 3 or 4.
2.4. Statistical Analysis
To minimize data bias, variables with missing values exceeding 10% were excluded. For variables with missing data below 10%, multiple imputation was implemented. The baseline characteristics of participants were divided into two groups based on delirium presence or absence. The analysis incorporated mean (standard deviation) for normally distributed variables and median (interquartile range [17]) for non‐normally distributed continuous variables, while categorical variables were expressed as frequencies and percentages. Normality tests and quantile–quantile (QQ) plots assessed data distribution, with appropriate descriptive statistics applied accordingly. Group comparisons for normally distributed continuous variables utilized Welch’s t‐test or ANOVA, while non‐normally distributed variables were analyzed using the Wilcoxon rank‐sum test or Kruskal–Wallis test. For categorical data comparisons, Fisher’s exact test was applied for expected frequencies < 5, and the chi‐squared test was used otherwise. Univariate and multivariate logistic regression models examined the independent associations between serum AG levels and POD development probability. Patients were stratified into four categories based on serum AG level IQR: Q1 (5–12), Q2 (12–14), Q3 (14–17), and Q4 (17–41) to investigate the relationship between serum AG categories and outcome indicators. To address potential confounding factors, variables were systematically incorporated into the logistic regression framework through progressively adjusted models. Serum AG was analyzed as both continuous and categorical variables across four models. Model 1 remained unadjusted. Model 2 adjusted for demographic and comorbidity data. Model 3 incorporated additional laboratory parameters and disease severity scores. Model 4 included special interventions. Variance inflation factors (VIF) were calculated to assess multicollinearity, with all variables showing VIF < 5 (Supporting Data Table S2). A restricted cubic spline (RCS) regression model was used to evaluate the potential linear association between serum AG concentration and POD occurrence probability. Receiver operating characteristic (ROC) curve analysis was conducted to assess the predictive accuracy of serum AG for POD risk. Subgroup analyses examined potential effect modifiers based on various clinical factors including age, gender, and comorbidities. Sensitivity analyses assessed result robustness across different patient populations by excluding patients with cerebrovascular disease, individuals under 65 years, and analyzing the original dataset without multiple imputation [3].
In our study, all statistical analyses were conducted using R software (Version 4.2.2) and MSTATA software (https://www.mstata.com), with statistical significance set at a two‐sided p < 0.05.
3. Results
3.1. Sample Size and Baseline Information
The study included 2467 patients, stratified by delirium status (present/absent), as shown in Table 1. The median age was 68 years (IQR: 57–78) in the overall cohort, with no significant difference between the delirium and nondelirium groups (p = 0.796). Males comprised 59.22% of the population, with a slightly higher proportion in the nondelirium group (61.02% vs. 57.24%, p = 0.056). Patients with delirium had a higher cerebrovascular disease prevalence (40.97% vs. 24.44%, p < 0.001) and increased utilization of continuous renal replacement therapy (CRRT) (10.31% vs. 4.25%, p < 0.001), ventilation (93.87% vs. 83.37%, p < 0.001), benzodiazepines (53.75% vs. 45.09%, p < 0.001), and vasoactive medications (57.84% vs. 35.03%, p < 0.001). The delirium group exhibited elevated severity scores, including Simplified Acute Physiology Score II (SAPS II) (median: 38 vs. 35, p < 0.001) and Sequential Organ Failure Assessment (SOFA) (median: 1.00 vs. 1.00, p = 0.001). Laboratory values were also higher, including serum AG (median: 15.0 mmol/L vs. 14.0 mmol/L, p < 0.001), glucose (median: 137 mg/dL vs. 129 mg/dL, p < 0.001), and hemoglobin (median: 11.00 g/dL vs. 10.30 g/dL, p < 0.001). ICU stay (median: 13 days vs. 4 days, p < 0.001) and hospital stay (median: 25 days vs. 17 days, p < 0.001) were significantly longer in the delirium group. Other comorbidities and laboratory parameters, including chronic pulmonary disease, diabetes, and sodium levels, showed no significant differences.
3.2. Visualization of the Nonlinear Relationships by RCS
The association between serum AG and POD risk was evaluated using RCS models. In Model 1 (Figure 2(a)), Model 2 (Figure 2(b)), and Model 4 (Figure 2(d)), a nonlinear relationship emerged between serum AG and POD risk (p for nonlinearity < 0.05), with delirium odds increasing alongside serum AG levels. In Model 3 (Figure 2(c)), the relationship demonstrated a positive linear trend (p for nonlinearity = 0.055).
Figure 2. Restricted cubic spline (RCS) curves showing the association between serum AG and the risk of POD in ICU patients undergoing gastric surgery. (a) Model 1 (unadjusted). (b) Model 2 (adjusted for demographic and comorbidity data). (c) Model 3 (additionally adjusted for laboratory parameters and disease severity scores). (d) Model 4 (further adjusted for special interventions). The red solid line represents the estimated OR of POD associated with serum AG levels. The red shaded area indicates the 95% CI. The bar chart at the bottom shows the distribution of patients across serum AG values.(a)(b)(c)(d)
3.3. Predictive Value of Serum AG in POD Development Using Logistic Regression Analysis
Logistic regression analysis revealed that increasing serum AG levels consistently correlated with higher POD risk across all models in Table 2. Each unit increase in serum AG yielded an odds ratio (OR) of 1.09 (95% CI: 1.07–1.12, p < 0.001) in the unadjusted Model 1, 1.08 (95% CI: 1.06–1.10, p < 0.001) in Model 2, 1.07 (95% CI: 1.04–1.10, p < 0.001) in Model 3, and 1.08 (95% CI: 1.05–1.11, p < 0.001) in Model 4. When categorized into quartiles, higher serum AG quartiles showed progressively increased delirium risk compared to the reference quartile (Q1). Q2 demonstrated an OR of 1.49 (95% CI: 1.15–1.92, p = 0.002) in Model 1, showing slight decreases with adjustments in Models 2–4. Q3 exhibited an OR of 1.87 (95% CI: 1.48–2.37, p < 0.001) in Model 1, maintaining similar patterns in adjusted models. Q4 displayed the highest risk, with an OR of 2.96 (95% CI: 2.32–3.78, p < 0.001) in Model 1, remaining significant throughout all models. A significant dose–response relationship persisted, as evidenced by p for trend < 0.001 across all models. These findings indicate that both continuous and categorical serum AG measurements strongly correlate with increased POD risk, independent of various clinical and laboratory factors.
3.4. ROC Curves
ROC curve analysis was performed to evaluate the predictive capabilities of serum AG and severity of illness scores (SAPS II and SOFA) for POD occurrence in post–gastric surgery patients. Serum AG (area under the curve [AUC] = 0.606, 95% CI: 0.584–0.628) demonstrated superior predictive performance compared to SAPS II (AUC = 0.568, 95% CI: 0.545–0.590) and SOFA (AUC = 0.536, 95% CI: 0.514–0.558), exhibiting moderate predictive accuracy (Figure 3). These findings highlight serum AG’s potential as an effective predictor of POD in gastric surgery patients.
ROC curves to assess the predictive power of serum AG on the incidence of POD. AUC, area under the curve; AG, anion gap; SAPS II, Simplified Acute Physiology Score II; SOFA, Sequential Organ Failure Assessment; ROC, receiver operating characteristic; POD, postoperative delirium.
3.5. Subgroup Analysis and Sensitivity Analysis
Subgroup analyses examined multiple variables, including age, gender, special interventions (ventilation, CRRT, benzodiazepine use, and vasoactive drug use), and various comorbidities including cerebrovascular disease, chronic pulmonary disease, congestive heart failure, diabetes, myocardial infarction, liver disease, peripheral vascular disease, and renal disease. Results revealed no significant interactions between these subgroups (p for interaction > 0.05), except for cerebrovascular disease (p for interaction = 0.035) and CRRT (p for interaction = 0.041). These results suggest that the relationship between serum AG and POD risk remains consistent across most subgroups, with notable interactions in cerebrovascular disease and CRRT subgroups, as shown in Figure 4.
Forest plot for the relationship between serum AG and POD. Serum AG was analyzed as a continuous variable. The above models were adjusted for the variables in Model 4. In each case, the models were not adjusted for stratification variables. CRRT, continuous renal replacement therapy; AG, anion gap; POD, postoperative delirium.
To ensure the robustness of our primary findings regarding the serum AG‐POD association, we conducted comprehensive sensitivity analyses. These analyses consistently demonstrated a statistically significant relationship between elevated serum AG levels and increased POD risk across all tested models (see Supporting Data Tables S3–S5). The stability of this association under varying analytical conditions strengthens the validity of our conclusions.
4. Discussion
Our retrospective cohort study of 2467 ICU patients undergoing gastric surgery demonstrated a significant, dose‐dependent association between elevated serum AG levels and increased POD risk. This relationship remained robust across all sensitivity analyses and predefined subgroup stratifications (age, sex, and comorbidity burden). Serum AG levels had a statistically significant but limited predictive value for POD, with an AUC of 0.606 (95% CI: 0.584–0.628). ROC analysis revealed an inherent trade‐off between the test’s sensitivity and specificity. At a threshold achieving 50% sensitivity, specificity was approximately 70%; when sensitivity was increased to 75%, specificity declined to 40%. To better evaluate clinical utility, we calculated positive and negative predictive values (PPV and NPV) across different disease prevalence scenarios. In low‐prevalence populations (e.g., 1%), the PPV was critically low (< 2%), indicating that positive results would be predominantly false positives, potentially causing unnecessary patient anxiety and resource utilization. In high‐prevalence settings (e.g., 30%), the PPV improved but remained suboptimal (35%–42%), meaning over half of positive results would still be false positives. Conversely, the NPV remained consistently high across prevalence scenarios, suggesting the test holds greater utility for ruling out disease than for confirming it. These findings indicate that this test in its current form is unsuitable for general population screening. When applied to high‐risk populations, positive results require cautious interpretation and should be integrated with other clinical indicators. Future research should focus on optimizing diagnostic thresholds or developing integrated diagnostic algorithms that incorporate this test alongside other biomarkers to enhance its predictive capability.
Despite significant improvements in gastric surgical techniques and subsequent reductions in mortality rates, postoperative neurocognitive complications—particularly delirium—continue to pose substantial clinical challenges [18]. These complications maintain high prevalence rates and significantly impair patient recovery trajectories. While the precise pathophysiology of delirium remains elusive, growing evidence implicates metabolic derangement, including acidosis, as potential contributors to its development [19, 20]. A growing body of evidence suggests that electrolyte imbalances and acid–base disturbances are associated with an increased risk of POD across various surgical contexts. For example, Li‐Hong Wang et al. reported a significant association between electrolyte disorders, including hyponatremia and hypocalcemia, and the occurrence of POD following orthopedic surgery [21]. Similarly, Zhang et al. identified electrolyte abnormalities as risk factors for POD in patients undergoing coronary artery bypass grafting [22]. Regarding acid–base imbalance, Aldemir et al. observed that metabolic acidosis was associated with a higher incidence of POD in surgical ICU patients [23]. This association has also been confirmed in a meta‐analysis by Zaal et al., which demonstrated a significant correlation between metabolic acidosis and POD in patients undergoing noncardiac surgery in the ICU [24]. To our knowledge, this is the first study to specifically investigate the association between serum AG levels and the risk of POD in ICU patients undergoing gastric surgery. Despite its statistical limitations, the primary clinical relevance of the AG lies in its role as a low‐cost, rapidly available, and routinely measured biomarker. Our study suggests that an elevated preoperative AG could serve as a simple, integrative “red flag” to identify surgical patients at higher physiological vulnerability for POD, prompting heightened clinical vigilance and the application of multidisciplinary preventive bundles.
Serum AG, calculated as the difference between unmeasured cations and anions in plasma, primarily reflects the concentration of organic acids, albumin, and phosphate [25]. As a well‐established clinical tool, serum AG serves two key functions: evaluation of acid–base disorders and differentiation of metabolic acidosis subtypes [26]. Elevated serum AG metabolic acidosis, a distinct category of metabolic disturbance, has been associated with poorer outcomes across multiple pathological states [27]. Clinical studies have consistently demonstrated correlations between increased serum AG levels and both disease severity and mortality in diverse conditions including chronic kidney disease, sepsis, acute pancreatitis, and sudden cardiac arrest [28–31].
Elevated serum AG, an indicator of metabolic acidosis, may potentiate neuroinflammation through three primary mechanistic pathways based on previous research. First, acidosis‐induced microglia activation triggers release of pro‐inflammatory mediators (e.g., nitric oxide [NO], prostaglandins, and interleukin‐1β) that amplify oxidative stress and neuroinflammatory responses [32]. Second, acidotic conditions suppress astrocytic glutamate transporters, leading to extracellular glutamate accumulation, NMDA receptor overactivation, excitotoxic calcium influx, and subsequent neuronal apoptosis [33]. Third, lactate‐mediated serum AG elevation impairs cerebrovascular function via G protein–coupled receptor 4 (GPR4) inhibition, increasing blood–brain barrier permeability and facilitating neurotoxin extravasation [34]. These pathophysiological insights suggest that serum AG may serve as a promising biomarker for POD risk in ICU patients undergoing gastric surgery. However, these proposed pathways remain hypothetical and are not directly supported by our observational data. It is critical to emphasize that AG itself is not a causal agent, but rather a biomarker reflective of broader systemic derangements. In most clinical scenarios, an elevated AG is the consequence of underlying conditions, such as hypotension, renal dysfunction, diabetes, intoxication, or other metabolic abnormalities that predispose patients to neurological compromise postoperatively, which are more plausibly the direct contributors to the development of delirium. Therefore, although our study identifies serum AG as a biomarker of POD in ICU patients undergoing gastric surgery based on the first analysis of its nonlinear association using RCSs, its clinical significance should be interpreted within the broader context of metabolic and clinical risk factors.
Our study provides the first evidence of a significant, nonlinear association between serum AG levels and POD incidence in this population, as demonstrated through RCS analysis. This study identifies serum AG as a potential biomarker associated with POD risk. Importantly, AG is a standard, routinely measured, and low‐cost biochemical parameter that is readily available in most clinical settings, including ICUs and perioperative wards. These characteristics make AG a practical and scalable tool for early risk stratification, particularly in resource‐limited environments or high‐volume surgical centers. While AG alone may not dictate clinical decisions, its inclusion in multimodal risk assessment models could enhance the identification of patients who may benefit from closer monitoring, targeted interventions, or preventive strategies against delirium. These findings support the clinical relevance of AG beyond its traditional role in metabolic monitoring, extending its utility to perioperative neurocognitive risk evaluation.
We emphasize that this is a retrospective observational study and, as such, it cannot establish causality between serum AG and POD. Our study, which is based on data from the MIMIC‐IV database, has several inherent limitations typical of retrospective designs. First, due to the retrospective nature of the data collection, inherent biases may exist, and MIMIC‐IV, which is derived primarily from a North American population, may not be fully generalizable to other regions or healthcare systems with different perioperative practices. However, we rigorously screened all eligible patients to mitigate this concern. Second, serum AG levels were measured only upon the patient’s initial admission to the ICU, and dynamic changes in serum AG were not assessed. Further research is needed to explore the potential impact of serum AG fluctuations over time. Third, we were unable to include several key variables that are known to influence POD risk, including preoperative cognitive status (e.g., MMSE and MoCA), history of delirium, anesthetic techniques, intraoperative medication use (e.g., benzodiazepines, inhalation anesthetics, and opioid administration), postoperative pain scores, sleep quality, and infection status. While we attempted to extract available proxies, certain data elements were not consistently recorded in MIMIC‐IV. These omissions may have influenced our findings and represent important avenues for future research. Additionally, although we adjusted for known confounding variables, residual or unmeasured factors may still influence the results. Given these limitations, future large‐scale, multicenter prospective studies are warranted to validate the prognostic role of serum AG in predicting the risk of POD among gastric surgery patients admitted to the ICU.
5. Conclusion
This study establishes an independent association between serum AG and increased POD risk in ICU patients following gastric surgery, suggesting that serum AG may function as a signal of physiological vulnerability for POD.
Ethics Statement
The MIMIC‐IV database has been granted ethical approval by the Institutional Review Boards of the Beth Israel Deaconess Medical Center and the Massachusetts Institute of Technology.
Consent
The requirement for informed consent was waived, given that all information in MIMIC‐IV is anonymized.
Disclosure
All authors approved the submitted version.
Conflicts of Interest
The authors declare no conflicts of interest.
Author Contributions
Simin Yang and Xinwei Su designed the research. Simin Yang collected and analyzed the data and drafted the manuscript. Simin Yang and Xinwei Su revised the manuscript. All authors contributed to the article.
Funding
The authors have nothing to report.
Supporting Information
Supporting information is provided in a Word document containing supporting data Tables (S1–S3), listing ICD codes, multicollinearity diagnostics, and sensitivity analysis results for POD risk.
Supporting information
Supporting Information Additional supporting information can be found online in the Supporting Information section.
The reference list from the paper itself. Each links out to its DOI / PubMed record.
- 1Mattison M. L. P. , Delirium, Annals of Internal Medicine. (2020) 173, no. 7, ITC 49–ITC 64, 10.7326/AITC 202010060.33017552 · doi ↗ · pubmed ↗
- 2Yan E. , Veitch M. , Saripella A. et al., Association Between Postoperative Delirium and Adverse Outcomes in Older Surgical Patients: A Systematic Review and Meta-Analysis, Journal of Clinical Anesthesia. (2023) 90, 10.1016/j.jclinane.2023.111221.37515876 · doi ↗ · pubmed ↗
- 3Guo P. , Ma Y. , Su W. et al., Association Between Baseline Serum Bicarbonate and the Risk of Postoperative Delirium in Patients Undergoing Cardiac Surgery in the ICU: A Retrospective Study From the MIMIC-IV Database, BMC Anesthesiology. (2024) 24, no. 1, 10.1186/s 12871-024-02738-9.PMC 1143821339342157 · doi ↗ · pubmed ↗
- 4Ge Q.-Y. , Zheng C. , Song X.-B. et al., The Relationship Between the Average Infusion Rate of Propofol and the Incidence of Delirium During Invasive Mechanical Ventilation: A Retrospective Study Based on the MIMIC IV Database, CNS Neuroscience and Therapeutics. (2025) 31, no. 3, 10.1111/cns.70273.PMC 1186898540018993 · doi ↗ · pubmed ↗
- 5Huang H. , Li H. , Zhang X. et al., Association of Postoperative Delirium With Cognitive Outcomes: A Meta-Analysis, Journal of Clinical Anesthesia. (2021) 75, 10.1016/j.jclinane.2021.110496.34482263 · doi ↗ · pubmed ↗
- 6Hoogma D. F. , Venmans E. , Al Tmimi L. et al., Postoperative Delirium and Quality of Life After Transcatheter and Surgical Aortic Valve Replacement: A Prospective Observational Study, Journal of Thoracic and Cardiovascular Surgery. (2023) 166, no. 1, 156–166.e 6, 10.1016/j.jtcvs.2021.11.023.34876283 · doi ↗ · pubmed ↗
- 7Zhao D. , Li Y. , Huang J. et al., Association of Serum Anion Gap and Risk of Long-Term Mortality in Patients Following Coronary Artery Bypass Grafting: A Propensity Score Matching Study, Journal of Cardiac Surgery. (2022) 37, no. 12, 4906–4918, 10.1111/jocs.17167.36378900 · doi ↗ · pubmed ↗
- 8Sun X. , Lu J. , Weng W. , and Yan Q. , Association Between Anion Gap and All-Cause Mortality of Critically Ill Surgical Patients: A Retrospective Cohort Study, BMC Surgery. (2023) 23, no. 1, 10.1186/s 12893-023-02137-w.PMC 1041351837559030 · doi ↗ · pubmed ↗