Soft crystalline properties of 2D frameworks constructed from lithium ions and dinitriles
Taichi Nishiguchi, Kotoha Kageyama, Takuya Kurihara, Nanae Shimanaka, Shun Tokuda, Shuto Tsuda, Nattapol Ma, Satoshi Horike

TL;DR
This paper explores the unique properties of 2D frameworks made from lithium ions and dinitriles, showing they have low melting points and unusual thermal expansion.
Contribution
The study introduces new 2D frameworks with unique mechanical and thermal properties due to weak Li+-dinitrile interactions.
Findings
The frameworks exhibit low melting temperatures below 100 °C.
They show large positive and negative thermal expansion.
Metal ion diffusion was observed in the 2D structures.
Abstract
We constructed two-dimensional (2D) molecular frameworks composed of lithium ions (Li+) and dinitrile aliphatic ligands to explore their mechanical and thermal properties. Calorimetry, X-ray diffraction, density functional theory calculations, alternating current impedance, and solid-state nuclear magnetic resonance evidenced behaviours and properties originating from the weakly linked 2D system. We found low melting temperatures (<100 °C), high mechanical deformability, large positive and negative thermal expansion, and metal ion diffusion. These features were uniquely observed in the integration of Li+ and dinitriles into extended molecular structures. We synthesised four crystalline frameworks from lithium ions and aliphatic dinitrile molecules. Properties based on the weak metal–ligand interactions were studied based on the understanding of well-defined crystal structures.
Genes, proteins, chemicals, diseases, species, mutations and cell lines named across the full text — each resolved to its canonical identifier and authoritative record.
Click any figure to enlarge with its caption.
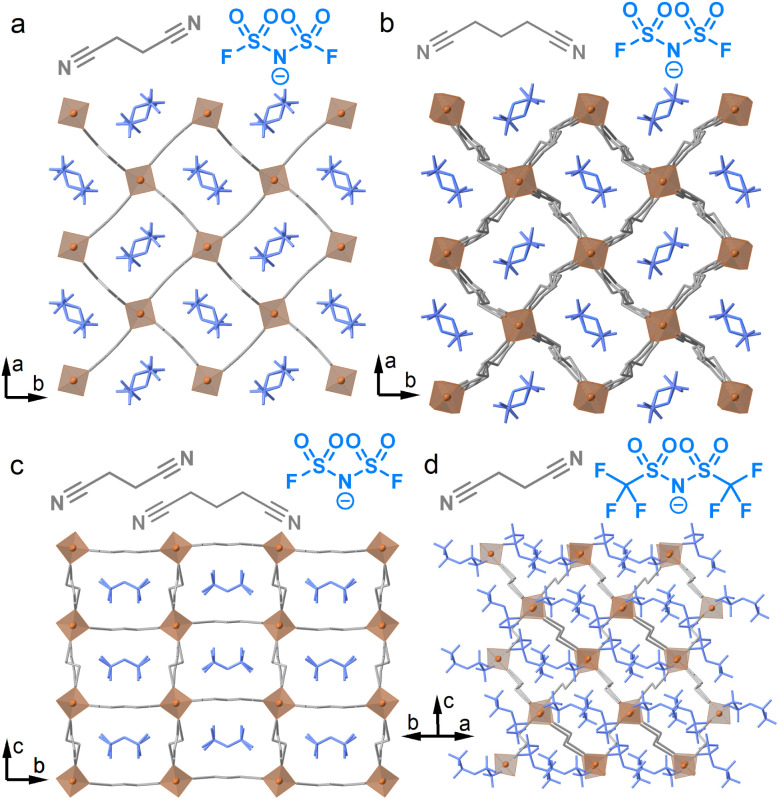 Fig. 1
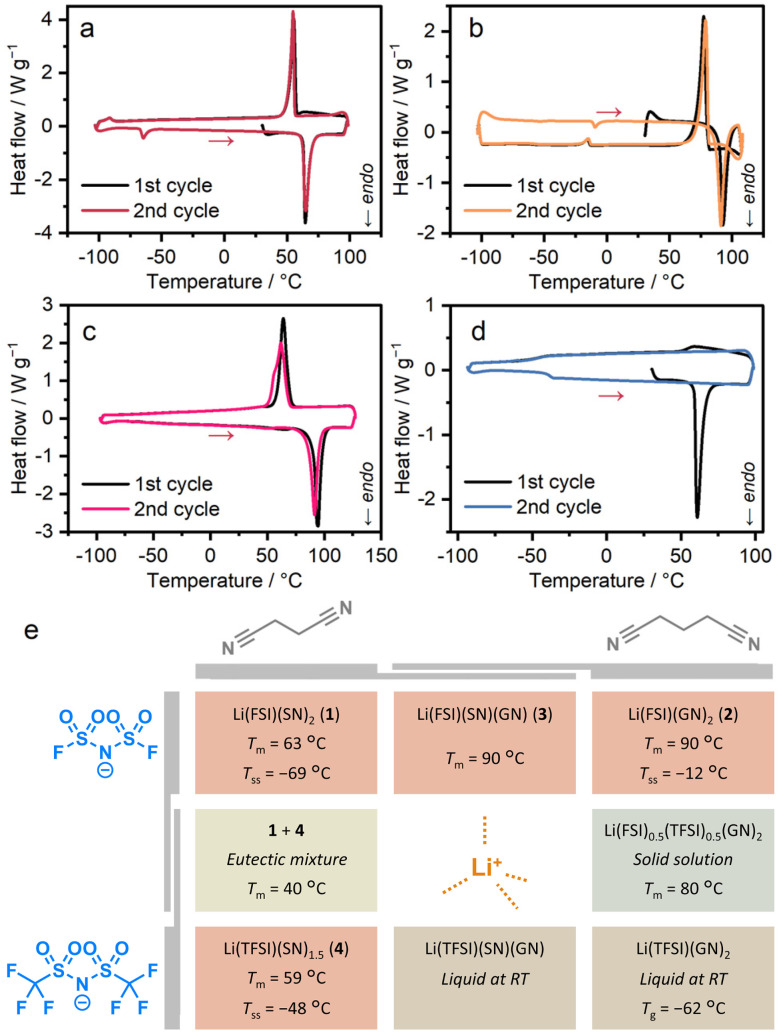 Fig. 2
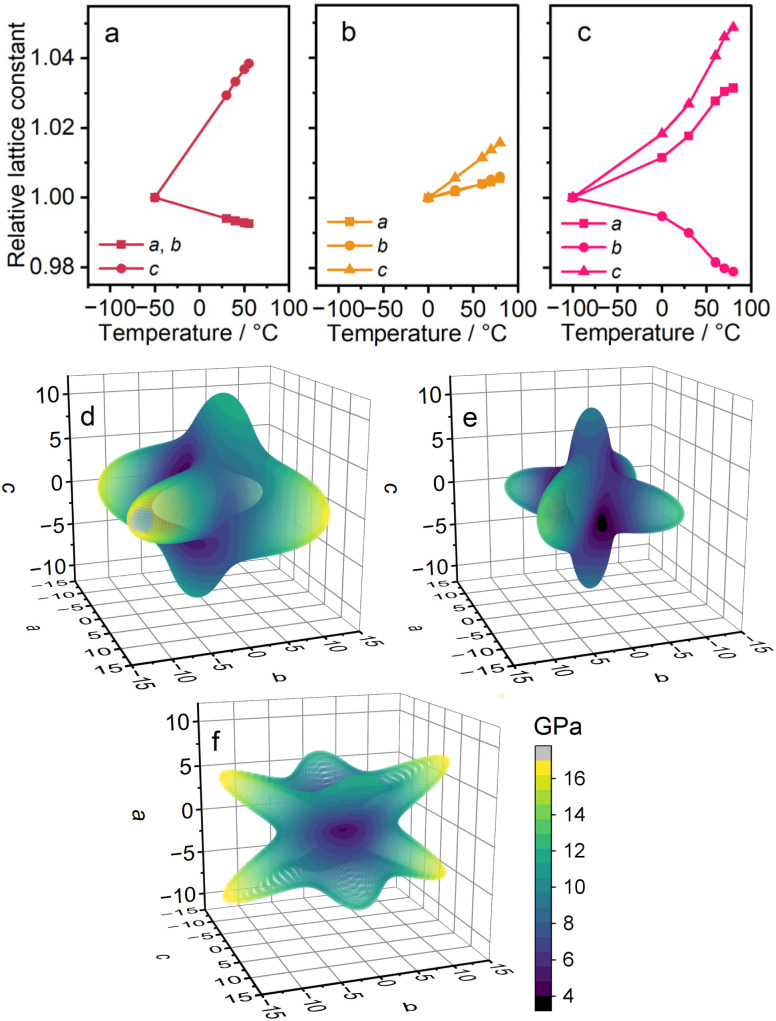 Fig. 3
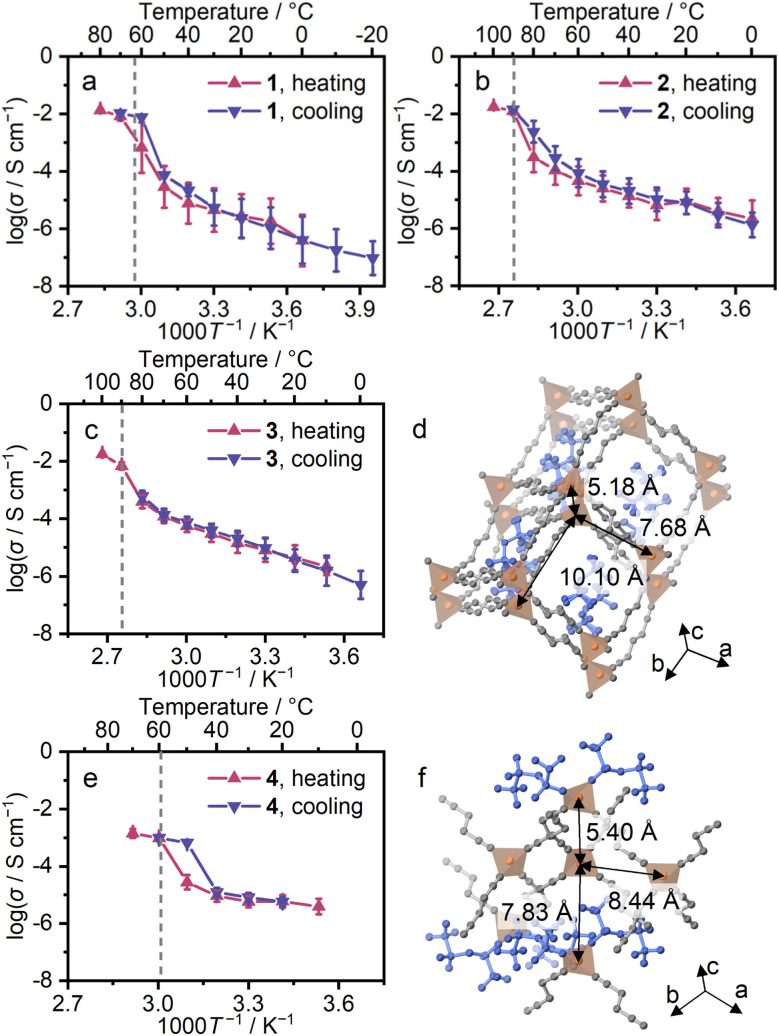 Fig. 4
| Sample |
| Δ | Δ |
| Δ | Δ |
|
|---|---|---|---|---|---|---|---|
| 1 | 63 | 34 | 100 | −69 | 3.8 | 18.5 | — |
| 2 | 90 | 29 | 80 | −12 | 1.3 | 5.0 | — |
| 3 | 90 | 39 | 107 | — | — | — | — |
| 4 | 59 | 27 | 81 | — | — | — | −48 |
| 10.540.5 | 40 | 30 | 97 | — | — | — | — |
- —Japan Society for the Promotion of Science10.13039/501100001691
- —Asahi Glass Foundation10.13039/100007684
- —Japan Science and Technology Agency10.13039/501100002241
Peer Reviews
No public reviews on file for this paper yet. If you reviewed it on a platform where reviews are public (OpenReview, ICLR, NeurIPS, ICML), you can paste yours below so the community can read it here.
Videos
No videos yet. Explain this paper in a talk, walkthrough, or lecture? Add one.
Taxonomy
TopicsThermal Expansion and Ionic Conductivity · Advanced Battery Materials and Technologies · Covalent Organic Framework Applications
Introduction
Coordination polymers (CPs) and metal–organic frameworks (MOFs) are molecular frameworks featuring well-defined, periodic structures. Conventional design and synthesis of CP/MOFs have focused on the robustness and stability of frameworks based on stronger coordination bonds by applying high-valent transition metal ions such as oxophilic Zr^4+^ and Cr^3+^ and rigid ligands.^1,2^ On the other hand, frameworks based on weaker metal–ligand interactions have been relatively unexplored, despite their potential to exhibit distinct dynamic and thermomechanical behaviours.
In recent studies, synthetic approaches to incorporate weak metal–ligand interactions have been adopted to create CP/MOF crystals with phase changes, including melting behaviours.^3–7^ Controlling the bond strength (enthalpic factor) and the mobility of molecular components (entropic factor) reduces the melting temperature (Tm) to a value lower than the decomposition temperature, yielding a stable liquid state.^8,9^ In other words, CP/MOFs constructed from metal ions and bridging ligands with weak interactions would represent not only the chance to explore the melting phenomena but also their unique physical (especially, thermal) properties in the crystalline state; however, many of them have been overlooked.
Here, we report molecular frameworks constructed from lithium ions (Li^+^) and dinitriles. We selected Li^+^ as nodes and dinitrile aliphatic linkers to construct crystalline frameworks, utilising their non-directional bonding and the inherent flexibility of the linker molecules.^10–13^ A solvent-free melt-cooling reaction was employed instead of a self-assembling process in solutions to incorporate these components into single crystalline phases. The crystalline products are two-dimensional (2D) structures and exhibit low Tm ranging from 59 to 90 °C, below those typically reported for CP/MOFs. They exhibited Young's moduli below 18 GPa, and one compound showed large positive and negative thermal expansion, with the absolute value of the coefficient exceeding 100 × 10^−6^ K^−1^. The weak interactions between the metal and ligands facilitate dissociation of the coordination interactions, resulting in the diffusion of the metal ions in the crystalline phase.
Results and discussion
Crystal structures
Four Li-based frameworks, Li(FSI)(SN)2 (1), Li(FSI)(GN)2 (2), Li(FSI)(SN)(GN) (3), and Li(TFSI)(SN)1.5 (4) (FSI^−^ = bis(fluorosulfonyl)imide, TFSI^−^ = bis(trifluoromethanesulfonyl)imide, SN = succinonitrile, and GN = glutaronitrile) were synthesised (see the SI for the detailed synthetic methods).^10,14–16^ A solvent-free melt-cooling reaction was performed under an Ar atmosphere to effectively trap the metastable, weak interactions in the crystalline states. This reaction is necessary because no crystals were formed using conventional solvothermal reactions with ethanol, acetonitrile, or tetrahydrofuran. In Fig. 1 and S1, we reveal the structures through single crystal X-ray diffraction (SC-XRD) analyses of 2, 3, and 4, along with the previously reported structure of 1. All obtained crystals consist of tetrahedral Li^+^ and dinitrile linkers. 2, 3, and 4 feature 2D sheet structures. Compounds 2 and 3 consist of frameworks with tetracoordinated Li^+^ and SN/GN linkers, containing FSI within them. In contrast, 4 has two inequivalent Li^+^ sites; one site is coordinated with four SN, while the other has two SN and two TFSI^−^. The TFSI^−^ anions cap the sheets to form a 2D extended structure. The 2-nm sheets exhibit a sql topology, as determined by TOPOS Pro,^17^ with a two-fold inclined interpenetration. Mixtures of Li(BF_4_) and SN, and Li(PF_6_) and SN, at the molar ratio of 1/2 formed solids with unclear melting behaviours, suggesting the formation of impurity phases. These results indicate the importance of FSI^−^ and TFSI^−^ for the formation of pure single phases.
Schematic representations of dinitriles and anions, and crystal structures of (a) Li(FSI)(SN)2 (1) at −100 °C, (b) Li(FSI)(GN)2 (2) at 0 °C, (c) Li(FSI)(SN)(GN) (3) at 0 °C, and (d) Li(TFSI)(SN)1.5 (4) at −175 °C. SN/GN: grey, Li+: orange, and FSI−/TFSI−: blue. H atoms are omitted for clarity.
Thermal behaviours
Thermogravimetric analysis (TGA) determined the decomposition temperatures of 1–4 to be 109, 140, 139, and 139 °C (Fig. S2), forming a stable liquid state over a temperature window of 50 °C. In Fig. 2, differential scanning calorimetry (DSC) revealed melting peaks for 1–4 at 63, 90, 90, and 59 °C (Fig. 2a–d). Tm of 1 aligns with the reported value, suggesting high phase purity.^10^ Variable-temperature (VT) powder X-ray diffraction (PXRD) of powder samples, matching the patterns simulated from SC-XRD structures, confirmed the complete transformation during melting (Fig. S3). We synthesised Li(TFSI)(bpe)2 (bpe = 1,2-bis(4-pyridyl)ethane) to elucidate the role of the ligand in reducing Tm (Fig. S4 and Table S1). It showed a Tm of 219 °C in DSC, without significant weight loss in TGA (Fig. S5), a temperature comparable to reported TFSI^−^- and pyridine-based melting CPs and analogues (168–245 °C).^18–21^ This indicates that the origin of the low Tm of 1–4 arises from the weak interaction between Li^+^ and nitrile groups. In the DSC of 4, a glass transition was observed at −48 °C (Tg) in the second heating process. This indicates the low diffusivity of the components due to the bulky TFSI^−^ and a high Li^+^/linker ratio, suppressing crystallisation to form a glassy state.^22^ We performed DSC at different ramping rates (Fig. S6). While ramping rates of 3 K min^−1^ or higher observed no crystallisation, the heating process at 2 K min^−1^ resulted in crystallisation. This indicates that ramping rates above 2 K min^−1^ are required for the formation of a stable glassy/liquid phase of 4.
DSC profiles of (a) 1, (b) 2, (c) 3, and (d) 4. Red arrows indicate heating processes. (e) Summary of thermal and phase behaviours.
To gain an understanding of low-melting behaviours, we studied the thermodynamic parameters. The melting enthalpy (ΔHfus) and melting entropy (ΔSfus) for 1, 2, 3, and 4 are presented in Table 1. The lower ΔHfus for 2 compared to 1 results from the increased cation–anion distances, which reduce the electrostatic stability of 2.^8,23^ According to the equation Tm = ΔHfus/ΔSfus, a higher ΔHfus corresponds to a higher Tm. However, 2 exhibits a higher Tm than 1 despite its lower ΔHfus. This can be attributed to the significantly lower ΔSfus of 2, highlighting the important role of entropy, which has been discussed in relation to ionic liquids and CPs.^20,24^ Among the low-melting MOFs, entropy also plays a significant role in their melting behaviours. The lower ΔSfus of 2, despite the longer alkyl chain, indicates a higher degree of freedom, or more ‘liquid-like’ dynamics of GN in 2. The high ΔHfus and ΔSfus of 3 originate from the more densely packed structure, supported by the density (Table S1). The lower ΔHfus and ΔSfus of 4 are explained by the lower symmetry of the crystal and fewer aliphatic components in the composition.
In addition to melting, small sharp peaks were observed in DSC of 1 and 2 at −69 and −12 °C (Tss). The solid–solid transition (SST) entropies (ΔSss) of 1 and 2 were 18.5 and 5.0 J K^−1^ mol^−1^. They are equal to 2.2 R and 0.6 R, where R is the universal gas constant. These results indicate an increase in the number of states (W) by 9.3 and 1.8 times, as derived from Boltzmann's equation, S
<svg xmlns="http://www.w3.org/2000/svg" version="1.0" width="13.200000pt" height="16.000000pt" viewBox="0 0 13.200000 16.000000" preserveAspectRatio="xMidYMid meet"><metadata> Created by potrace 1.16, written by Peter Selinger 2001-2019 </metadata><g transform="translate(1.000000,15.000000) scale(0.017500,-0.017500)" fill="currentColor" stroke="none"><path d="M0 440 l0 -40 320 0 320 0 0 40 0 40 -320 0 -320 0 0 -40z M0 280 l0 -40 320 0 320 0 0 40 0 40 -320 0 -320 0 0 -40z"/></g></svg>
R In(W).^25^ The W of 1.8 for 2 is almost equal to 2, and this is consistent with the disordering of GN into two possible conformations at a higher temperature than Tss. The W of 9.3 for 1 suggests the disordering of both SN and FSI^−^ in the SST.
Phase behaviours of mixtures and analogues
We investigated the mixture of the crystals and analogues to further understand the phase behaviours of the systems (Fig. 2e). We applied physical mixing for 1 and 2 with equimolar amounts. The PXRD pattern after five-minute hand grinding in a mortar matched that of 3, without diffraction peaks of 1 or 2 (Fig. S7). The pattern was fitted with the space group of Pbcm, supporting the formation of 3 (Fig. S8 and Table S2). This indicates the formation of 3, suggesting high diffusivity of the components and formability of the crystalline state of 3.
For the mixture of 1 and 4, we studied 1x4_1−x (x = 0.25, 0.5, 0.75), prepared by melt-cooling processes of the mixtures with a molar ratio of x/(1 − x) on a Li^+^ basis. PXRD patterns after the melt-cooling process confirmed the co-presence of 1 and 4 crystal phases in all the mixtures without forming any new phases (Fig. S9). While 1_0.25_4_0.75 and 1_0.75_4_0.25_ showed two melting peaks in DSC, 1_0.5_4_0.5_ exhibited a single melting peak at 40 °C (Fig. S10). These indicate the formation of a eutectic mixture with a Tm of 40 °C.^26,27^ The ΔHfus and ΔSfus were analysed to elucidate the thermodynamic origin of the reduction of Tm (Table 1). The ΔHfus value of 30 kJ mol^−1^ is comparable to the average of 1 and 4, suggesting the absence of enthalpic stabilisation by mixing the crystals. ΔSfus was calculated as ΔHfus/Tm = 97 J K^−1^ mol^−1^. This value is larger than the average of 1 and 4 ([101 + 80]/2 = 91) by 6 J K^−1^ mol^−1^, indicating the entropic contributions to the reduction of Tm. The value of 6 J K^−1^ mol^−1^ is close to R ln(2), and this is interpreted as the term of mixing entropy (ΔSmix) in the liquid state, which is given by the equation for ideal solutions as ΔSmix = − R [x ln(x) + (1 − x) ln (1 − x)]. These results highlight the pure and significant effect of mixing entropy on the minimisation of the Tm of the mixture.
The mixture of Li(FSI), Li(TFSI), and GN at the molar ratio of 1 : 1 : 4 formed a colourless crystalline powder. DSC of the product showed a sharp melting peak at 80 °C (Fig. S11), suggesting the formation of a pure crystalline phase. The PXRD pattern showed peaks at positions comparable to those of 2 (Fig. S12), proving the formation of a solid solution state with randomised anion positions with the formula of Li(FSI)0.5(TFSI)0.5(GN)2. We performed fitting of the PXRD pattern at 30 °C (Fig. S13). The extracted lattice constants are 0.1% larger than those of 2 (Tables S3 and S5), suggesting the expansion of the unit cell by including TFSI^−^ inside the frameworks.
We also attempted the synthesis of Li(TFSI)–GN and Li(TFSI)–SN–GN frameworks with the corresponding formula of Li(TFSI)(GN)2 and Li(TFSI)(SN)(GN). Each mixture of the precursors gave liquid states that remained uncrystallised over three years, forming a stable liquid state at room temperature. The DSC of Li(TFSI)(GN)2 observed a glass transition at −62 °C (Fig. S14), a temperature lower than the Tg of 4 by 14 °C, suggesting a possible Tm of 38 °C, assuming the TgTm ratio based on that of 4 (0.68, for the absolute temperatures). This suggests a Tm close to RT, preventing crystal formation and resulting in the room temperature liquid phase.
Mechanical properties
To investigate the mechanical properties associated with the weak metal–linker interaction, thermal expansivity was calculated from VT-PXRD patterns (Fig. S15–S17 and Tables S4–S6). Fig. 3a–c display the relative lattice constants of 1–3 as functions of temperature. For 1 and 2, temperatures above each Tss were taken into account. The coefficient of thermal expansion (CTE) was −69 × 10^−6^ and +370 × 10^−6^ K^−1^ for the a/b- and c-axes of 1, and +69 × 10^−6^, +76 × 10^−6^ and +200 × 10^−6^ K^−1^ for the a-, b-, and c-axes of 2. The CTE is substantial compared to reported CP/MOFs and is comparable to that of organic polymers.^28^ The negative thermal expansion (NTE) in 1 is understood as a result of expansion along the c-axis and flexible deformation of the 3D network. For 3, the CTE was +270, +180, and −110 × 10^−6^ K^−1^ for the a-, b-, and c-axes, across the temperature range of −100–80 °C. Both positive and negative thermal expansions are considered ‘colossal’, reaching the CTE as large as ±100 × 10^−6^ K^−1^, and significant anisotropic expansion was observed.^29,30^ The NTE in 3 indicates the contraction of the Li–GN–Li linkage, suggesting that the higher deformability of the longer aliphatic chain contributes to the softer mechanical properties.
Mechanical properties of 1–3. Relative lattice constants of (a) 1, (b) 2, and (c) 3. Computed spatial dependence of Young's moduli of (d) 1, (e) 2, and (f) 3.
The mechanical properties of 1–3 were computed. The elastic tensors are calculated using the density functional theory (DFT) method (Fig. S18 and S19).^31,32^Fig. 3d–f show the spatial dependence of Young's moduli. The anisotropies in the ab plane of 1 and 2 are attributed to the low-symmetric initial structures considered in DFT calculations.^33,34^ The calculated Young's moduli range 4.3–17.7 (1), 3.3–13.7 (2), and 0.3–16.8 GPa (3). These values are smaller compared with reported CP/MOFs, such as Zr_6_(OH)4_O_4(1,4-benzenedicarboxylate)6 (UiO-66, 37.1–46.3 GPa) or Zn_3_O(1,4-benzenedicarboxylate)2, (MOF-5, 9.5–19.7 GPa), suggesting the effect of the weak metal–linker interaction on stiffness.^35,36^1 and 2 are stiff along the Li–SN/GN–Li linkage. The smaller Young's modulus of 2 compared to 1 suggests the softness of the longer aliphatic chain of GN relative to SN. Despite similarities in the crystal structures, 3 exhibits a different shape of spatial dependence. The low Young's modulus along the a-axis of 3 indicates the deformability of the zig-zag structure in the Li–SN–Li linkage.
Diffusion behaviours
Impedance measurements were conducted for 1–4 (Fig. S20 and S21). A high transference number (0.95) and a hopping conduction mechanism of Li^+^ were reported for 1, suggesting potential opportunities for Li^+^ conductivity in 2–4 as well.^10,37^ Temperature-step DSC was conducted for 4 with the same temperature program as the impedance measurements (Fig. S22), observing crystallisation at 50 °C. Ion conductivity was calculated from the semi-circles of the obtained Nyquist plot. Fig. 4 shows Arrhenius plots for the first and after-melting cycles. The conductivity (σ) of 1–4 at 30 °C in the after-melting cycle was 1.3, 1.5, 1.3, and 1.2 × 10^−5^ S cm^−1^, and the activation energies (Ea) were 16, 13, 21, and 8 kJ mol^−1^ (Fig. S23). The comparable σ and Ea of 1–3 suggest the identical Li^+^ hopping mechanism in the conduction. The Ea of 4 is lower by 0.5 times, suggesting different Li^+^ conduction paths in 4. The crystal of 4 is in a lower symmetry with a higher number of neighbouring Li^+^ sites, and this leads to the formation of several possible Li^+^ ion paths, reducing the Ea in Li^+^ conduction (Fig. 4d and f). The ^7^Li T1 relaxation time in VT solid-state nuclear magnetic resonance (SS-NMR) corroborates the Ea of conductivity. In Fig. S24, the ^7^Li T1 relaxation time is plotted as a function of temperature. The Ea values of each ^7^Li T1 relaxation time followed the same trend as those observed from Li^+^ conductivity (Table S7). This suggests a Li^+^-conduction mechanism based on Li^+^ hopping, and the difference of Ea between 1–3 and 4 supports the identical Li^+^ hopping mechanism in 1–3 and multiple conduction paths in 4.
Li+ conductivity (σ) of 1–4. Arrhenius plots of Li+ conductivity for (a) 1, (b) 2, (c) 3, and (e) 4. Red and blue plots represent heating and cooling processes. The dashed lines indicate the Tm. The crystal structures of (d) 3 and (f) 4. The distances between neighbouring Li+ are indicated.
Conclusions
Four framework crystals, Li(FSI)(SN)2, Li(FSI)(GN)2, Li(FSI)(SN)(GN), and Li(TFSI)(SN)1.5, were synthesised from Li^+^ and aliphatic dinitrile linkers by a solvent-free melt-cooling process. These are constructed through weak metal–ligand interactions, as explained by HSAB theory, leading to low Tm below 90 °C. DFT-based elasticity analyses revealed high and anisotropic deformability, attributed to the aliphatic softness and framework topology. XRD-based thermal expansion analyses observed a large linear CTE of +370 × 10^−6^ K^−1^ in one framework, as well as a large negative thermal expansion with a CTE of −110 × 10^−6^ K^−1^ in another one, attributed to structural anisotropy. AC impedance and solid-state NMR elucidated an ionic conductivity of 1.5 × 10^−5^ S cm^−1^ at room temperature based on the weak metal–linker interactions. This work provides clear evidence and guidelines for synthesising mechanically soft, thermally active molecular frameworks based on weak metal–linker interactions.
Author contributions
T. N. and K. K. contributed equally to this work. T. N., K.·K., and S. H. conceptualised the project. K. K., T. N., T. K., N.·S., S. To., S. Ts, and N. M. contributed to data collection and formal analyses. T. N. and S. H. summarised the findings in the manuscript, and all the authors approved the final version.
Conflicts of interest
There are no conflicts to declare.
Supplementary Material
SC-OLF-D5SC06222E-s001
SC-OLF-D5SC06222E-s002
The reference list from the paper itself. Each links out to its DOI / PubMed record.
- 1Furukawa H. Cordova K. E. O'Keeffe M. Yaghi O. M. Science 201334112304442399056410.1126/science.1230444 · doi ↗ · pubmed ↗
- 2Horike S. Nagarkar S. S. Ogawa T. Kitagawa S. Angew. Chem., Int. Ed.2020596652666410.1002/anie.20191138431631497 · doi ↗ · pubmed ↗
- 3Bennett T. D. Cheetham A. K. Fuchs A. H. Coudert F.-X. Nat. Chem.2016911162799592010.1038/nchem.2691 · doi ↗ · pubmed ↗
- 4Bennett T. D. Horike S. Nat. Rev. Mater.20183431440
- 5Ma N. Horike S. Chem. Rev.2022122416342033504474910.1021/acs.chemrev.1c 00826 · doi ↗ · pubmed ↗
- 6León-Alcaide L. Christensen R. S. Keen D. A. JordáJ. L. Brotons-Alcázar I. Forment-Aliaga A. Mínguez Espallargas G. J. Am. Chem. Soc.202314511258112643715870710.1021/jacs.3c 01455 PMC 10214446 · doi ↗ · pubmed ↗
- 7Ma N. Kosasang S. Berdichevsky E. K. Nishiguchi T. Horike S. Chem. Sci.202415747475013878474410.1039/d 4sc 01793 e PMC 11110139 · doi ↗ · pubmed ↗
- 8Liu M. Mc Gillicuddy R. D. Vuong H. Tao S. Slavney A. H. Gonzalez M. I. Billinge S. J. L. Mason J. A. J. Am. Chem. Soc.2021143280128113357091110.1021/jacs.0c 11718 · doi ↗ · pubmed ↗