Protocol for the detection of large dense-core vesicle exocytosis using an automated image-processing algorithm
Aishwarya Makam, Vishnu Ramadas, Anly Tollan, Ishan Bhattacharyya, Abhimanyu Dubey, Nikhil R. Gandasi

TL;DR
This paper introduces a protocol using an automated image-processing algorithm to detect and analyze exocytosis in human pancreatic islet cells.
Contribution
A novel protocol for detecting large dense-core vesicle exocytosis using Lagrangian particle tracking in high-throughput microscopy.
Findings
The protocol is validated using mathematical models, TetraSpeck beads, and cell images.
It enables efficient analysis of vesicle dynamics in human pancreatic islet cells.
The method is applicable to other cellular processes and large datasets.
Abstract
Investigating exocytosis in human pancreatic islet cells is challenging due to small vesicle size and variable imaging parameters. Here, we present a protocol to detect and analyze exocytosis with an image-processing algorithm using Lagrangian particle tracking. We describe steps for sample preparation, total internal reflection fluorescence (TIRF) microscopy imaging, and computational analysis. The algorithm is validated by mathematical models, TetraSpeck beads, and cell images. Its applicability to other cellular processes and its handling of large sets of data make it useful for high-throughput microscopy research. For complete details on the use and execution of this protocol, please refer to Makam et al.1 •Instructions for isolation, culture, and transfection of human pancreatic islet cells•Steps for preparation of beads and artificial images for algorithm validation•Guidance on…
Genes, proteins, chemicals, diseases, species, mutations and cell lines named across the full text — each resolved to its canonical identifier and authoritative record.
Click any figure to enlarge with its caption.
 Figure 1
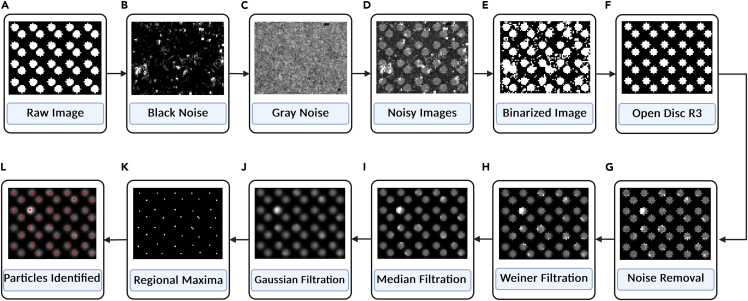 Figure 2
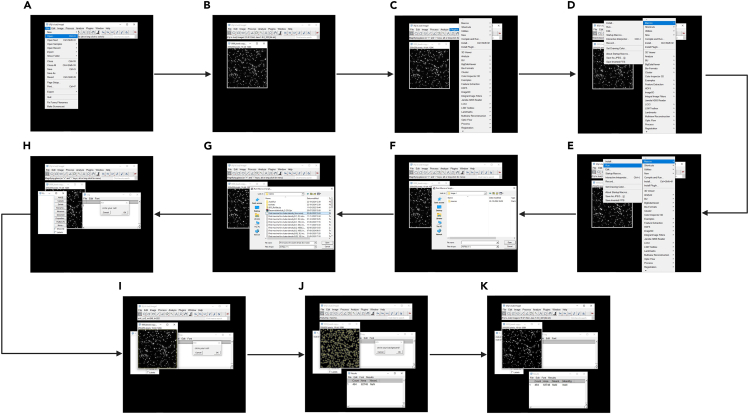 Figure 3
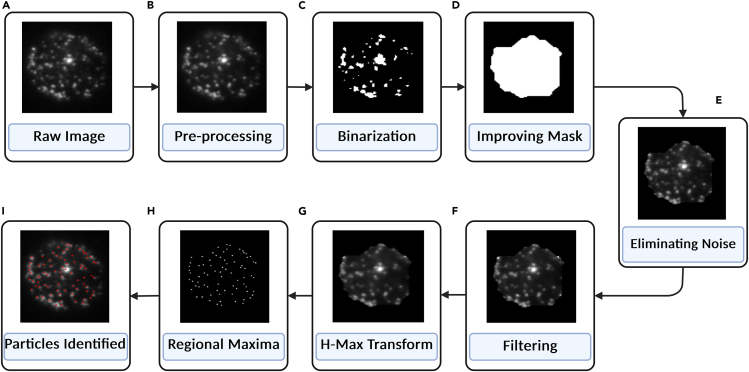 Figure 4
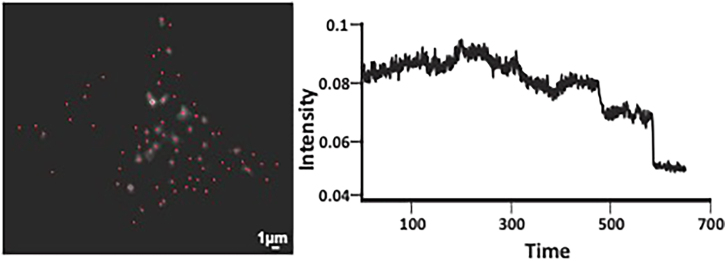 Figure 5
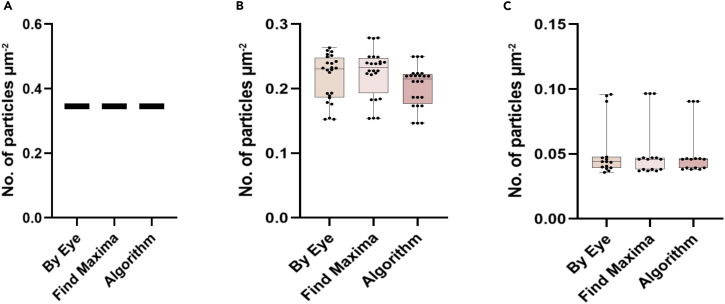 Figure 6
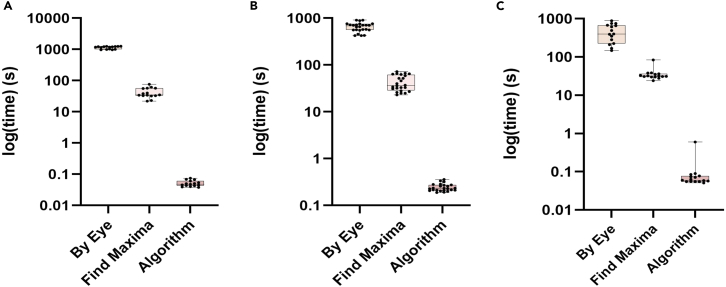 Figure 7
Peer Reviews
No public reviews on file for this paper yet. If you reviewed it on a platform where reviews are public (OpenReview, ICLR, NeurIPS, ICML), you can paste yours below so the community can read it here.
Videos
No videos yet. Explain this paper in a talk, walkthrough, or lecture? Add one.
Taxonomy
TopicsCellular transport and secretion · Advanced Fluorescence Microscopy Techniques · Cell Image Analysis Techniques
Before you begin
The biggest challenge of this task is to come up with an effective, versatile image-processing tool for analyzing exocytosis, a vital cellular process that deals with the release of vesicular contents.2^,^3 As vesicles are small in size and there are a lot of variances in imaging parameters, current tools are generally lacking in terms of precision and speed.1^,^4 We set out to design an efficient Lagrangian particle tracking algorithm with high sensitivity for accurately locating punctate structures. During exocytosis, the punctate structures disappear with numerous changes in intensity; therefore, effective processing of large sets of data is essential.5 Validation against artificial images, fluorescent beads, and live cell images enables us to provide an enhanced method better suited to existing methods and achieve rapid, high-throughput analyses of exocytosis as well as other cell-based dynamics.1^,^4^,^6
Ensure all ethical clearances are in place for handling human pancreatic islets and verify that institutional and regional regulations are met.6 Prepare all reagents needed, such as CMRL 1066 culture medium, imaging buffer, and cell dissociation buffer, in a sterile form, and store them in proper conditions. Calibrate TIRF microscope, verify laser alignment.7^,^8 Prepare adenovirus stocks for granule markers (e.g., NPY-Venus or NPY-mCherry) and prepare Lipofectamine 2000 for transfection.9^,^10 Install and familiarise yourself with the Lagrangian particle tracking algorithm to verify compatibility with your imaging setup.5^,^9^,^11^,^12^,^13 Follow biosafety level 2 (BSL-2) protocols when handling human tissue and viral vectors and dispose of biohazardous waste according to institutional policy.14 These preparations are crucial to the protocol’s smooth operation and prevention of delays.
Institutional permissions
All experimental protocols adhere to the policies of the Nordic Network for Clinical Islet Transplantation, ADI Isletcore at the University of Alberta and the Indian Institute of Science. Before beginning the experiments and following the procedures outlined in this protocol, it is critical to ensure that the required permissions from the relevant institutions, including patient/guardian consent, have been acquired.
Innovation
In the study, we describe automated analysis of imaging-based detection of exocytosis. Although many image analysis-based plugins existed for detection of membrane trafficking in general in live cells, very few work well for exocytosis specifically. Exocytosis, when visualized under a microscope, has a unique increase in fluorescence coupled with a complete abrupt loss of signal. The first step to detect such events is to detect labelled granules with high fidelity, so that we can follow a fraction of them that later undergo exocytosis. This protocol is unique since it follows Lagrangian particle tracking algorithm to detect granules with high fidelity across various time points, so changes during exocytosis can be detected. Another important advancement is the ability of the algorithm to detect exocytosis events from primary tissue, for example, in this case, the islets of Langerhans. Such a protocol would save immense time for researchers working on exocytosis using imaging-based methods and ensure a standard way across different such studies to obtain comparable data.
Key resources table
REAGENT or RESOURCESOURCEIDENTIFIERBiological samplesHuman isletsNordic Network for Clinical Islet Transplantation and ADI Isletcore at the University of Albertahttps://nordicislets.medscinet.com/en.aspx,https://www.bcell.org/adi-isletcore.htmlCell culture reagents and mediaCMRL 1066 culture mediumThermo Fisher Scientific215400265.5 mM glucoseThermo Fisher ScientificA249400110% fetal bovine serumThermo Fisher ScientificA52567012 mM L-glutamineThermo Fisher Scientific25030081Penicillin-Streptomycin (1,000 U/mL)Thermo Fisher Scientific15140122Ca^2+^-free cell dissociation bufferThermo Fisher Scientific131510140.5% trypsin EDTA (10×)Thermo Fisher Scientific15400–054Lipofectamine 2000Thermo Fisher Scientific11668027100 nm TetraSpeck beadsThermo Fisher ScientificT7279Poly-L-LysineSigma-AldrichP8920-100MLPlasmidNPY-mCherry, NPY-GFPAddgene74629, 67156BuffersNaClSisco Research Laboratories41721(CAS-7647-14-5)KClSisco Research Laboratories84984(CAS-7447-40-7)MgCl_2_Sisco Research Laboratories13546(CAS-7791-18-6)CaCl_2_Sisco Research Laboratories84336(CAS-10043-52-4)NaOHSisco Research Laboratories68151(CAS-1310-73-2HEPESThermo Fisher Scientific15630080D-glucoseSisco Research Laboratories42738 (CAS-50-99-7)PBS pH 7.4(1×)Thermo Fisher Scientific10010–023Software and algorithmsFiji (ImageJ) with Find Maxima pluginNIHhttps://imagej.net/software/fiji/downloadsMetamorphMolecular Deviceshttps://www.moleculardevices.com/products/cellular-imaging-systems/high-content-analysis/metamorph-microscopyMATLABMathWorksVersion: R2025aGraphPad Prism 8.0GraphPad Software, Inc.https://www.graphpad.com/Others22 mm CoverslipBluestarBSS3106-well Tissue Culture (TC)-treated clear flat-bottom polystyrene plate with round clear wells, sterileCorningCLS3516TIRF microscopeNikon InstrumentsNikon Ti2 EObjective lensNikon InstrumentsCameraCaim Research Ltd.Photometrics evolve 512 deltaLaserTOPTICA Photonics AG, Graefelfing, GermanyProduct ID: iChrome MLE-L-CD_30497 Version: .05
Materials and equipment
CMRL 1066 MediumReagentFinal concentrationAmountCMRL 1066 (base)N/A≈88 mLGlucose5.5 mM0.55 mLFetal calf serum10%10 mLL-Glutamine2 mM1 mLStreptomycin100 U/mL0.5 mLPenicillin100 U/mL0.5 mLTotalN/A100 mL 1× Trypsin (0.05% solution)ReagentFinal concentrationAmount0.5% trypsin10×1 mLPBS1×9 mLTotalN/A10 mL
Microscopy and image acquisition
Total Internal Reflection Fluorescence (TIRF) microscopy was used to visualize exocytotic events occurring at the plasma membrane. Live-cell imaging was performed using an AxioObserver Z1/Nikon Ti2 Eclipse TIRF microscope equipped with a 100× objective (NA 1.49) and an EMCCD camera (Photometrics evolve 512 delta). Images were captured at an acquisition rate of 20 frames per second with an exposure time of 50 ms. Excitation was performed using a 488 nm laser for GFP-tagged vesicles.
Step-by-step method details
Human pancreatic islet cell preparation
Timing: 3 weeks
This section helps in the preparation of human islets post-isolation for further imaging-related experiments.
- 1.Isolation and culture of human pancreatic islets
- a.Obtain human pancreatic islets from cadaveric donors with ethical approval and written donor consent.
- b.Culture the islets in CMRL 1066 medium supplemented with 5.5 mM glucose, 10% fetal calf serum (FCS), 2 mM L-glutamine, 100 U/mL penicillin, and 100 U/mL streptomycin.
- c.Cultures are maintained at 37°C in a humidified incubator with 5% CO_2_ for approximately two weeks. CRITICAL: It is essential to maintain the islets in a sterile condition during this recovery period. Alternative reagents like primosin can be used to avoid contamination.
- 2.Dispersion of Islets into Single Cell
- a.Islets are washed twice with Ca^2+^-free cell dissociation buffer.
- b.Treat the islets using 1× trypsin (0.05%) and incubate at 37°C for 5–10 min with gentle agitation.
- c.Add serum-containing medium to stop the reaction.
- d.Detach the cells and transfer them into a corning conical centrifuge tube.
- e.centrifuge the cells at 300 × g to pellet the cells.
- f.Resuspend the pellet with fresh serum-containing medium. CRITICAL: It is important to maintain the duration of trypsinization. Over trypsinisation may lead to degradation of the cells and prove detrimental to islet health.
- 3.Plating and transfection
- a.Rinse 22 mm glass coverslips with 70% ethanol and leave to air dry.
- b.Place the dried coverslips into a six-well plate.
- c.Prepare a working solution of Poly-L-Lysine (0.01% w/v in PBS) ≈ 500 μL per well in a 6-well plate.
- d.Add Poly-L-lysine solution to each well to completely cover each coverslip and incubate for 20 min at 25°C.
- e.Rinse the coverslips 2–3 times with PBS and leave to air-dry completely in a sterile laminar flow hood.
- f.Seed cells onto the Poly-L-Lysine coated coverslips at a density of 50,000–100,000 cells per coverslip.
- g.Incubate the cells 12-16 h in a 37°C, 5% CO_2_ incubator, to allow cells to attach onto the coverslips.
- h.Transfect the cells by adding 100 μl of OptiMEM containing 0.5 μg plasmid DNA (granule markers such as NPY-GFP or NPY-mCherry) and 0.5 μl of lipofectamine 2000. After 5-6 h of incubation, stop the transfection by replacing the medium with a complete serum-containing medium.
- i.Optional: Transfect cells with cDNA encoding eGFP-tagged proteins using Lipofectamine 2000.
- j.Image cells 24–36 h after transfection to allow recovery. CRITICAL: It is important to use OptiMEM during transfection to avoid stressing the cells. Alternatively, low serum-containing media can be used. Lipofectamine can be replaced by any other liposome-based transfection reagent which provides good transfection efficiency.
Preparation of beads and artificial images
Timing: 4 h
This section helps in the preparation of beads and artificial images important for the validation of the algorithm.
- 4.Immobilization of Fluorescent Beads
- a.Dilute 100 nm TetraSpeck beads at a 1:100 ratio in 1×PBS.
- b.Add 10 μL of the diluted beads onto a 22-mm coverslip.
- c.Allow the beads to settle for 10 min at 25°C.
- d.Gently wash 2-3 times with 1×PBS to remove unbound beads.
- e.TIRF microscopy can be used to image the beads.
- 5.Generation of Artificial Images
- a.Create circular objects using the equation
- i.(x±x1)^2^+(y+y1)^2^≤r^2^ where (x,y) – circle’s centre co-ordinates and r denotes the radius.
- b.Change the radius to create different vesicle areas.
- c.To represent differing vesicle sizes (distinguished, tangent, intersecting) apply differing radius r.Make several noisy versions (e.g., Gaussian, Poisson) and normalize all images to [0, 1].
- d.Final Image Composition: Final= w_1_.Noise_1_ + w_2_.Noise_2_ + (1-(w_1+w_2)).Raw
- e.Change several parameters (e.g., radius, weight of noise) to mimic TIRF images (Figure 1).Figure 1. Steps involved in the generation of artificial images(A–G) Creation of circular objects and addition of noise.(H–L) Filtration and particle identification using find maxima.
Induction of exocytosis
Timing: 10 min
This section details the induction of exocytosis in cultured islets.
- 6.For induction of exocytosis, prepare extracellular imaging buffer containing (in mM): 138 NaCl, 5.6 KCl, 1.2 MgCl_2_, 2.6 CaCl_2_, 10 D-glucose, and 5 HEPES (pH 7.4 with NaOH). Supplement with 200 μM diazoxide and 2 μM forskolin.15^,^16^,^17
- 7.Then apply a 75 mM KCl solution (prepared by equimolarly replacing NaCl in the buffer) locally using a pressurized glass electrode to evoke exocytosis.15^,^18
- 8.Maintain cells under constant perfusion with the exocytosis buffer at 32 °C during imaging.
Microscopy
Timing: 3–4 h
This section explains the microscopic examination of exocytosis events.
- 9.TIRF Microscopy Setup
- a.Set up the TIRF microscope with a 100×/1.45 objective.
- b.Samples will be excited with 491/488 nm lasers.
- c.Emission light is captured with an EMCCD camera (Photometrics evolve 512 delta).
- d.Keep the scaling to 160/130 nm per pixel.
Image processing and analysis—Granule quantification and analysis pipeline using algorithm
Timing: 1 day
This section enables the analysis of the images using the by-eye and find maxima-based detection methods.
- 10.By eye analysis
- a.Image analysis: Count the particles manually using Metamorph.
- b.Quantification: Record the total number of particles per image.
- c.Data processing: Calculate the averaged values based on individual images captured.
- d.Statistical analysis: Calculate the standard error of mean (SEM) for each condition. `
- 11.Find Maxima
- a.Calculate the granule density using the built-in plugin ’Find Maxima’ in ImageJ (Figure 2)Figure 2. Steps involved in the find maxima-based detection(A–C) Loading the image onto Fiji(ImageJ).(D–G) Selection of the macros and the find maxima plugin to be used.(H–K) Circling of the cell (ROI) and particle detection.
- b.Quantification: Record the total number of particles.
- c.Data processing: Average out the values obtained from individual images.
- d.Statistical analysis: Calculate the standard error of the mean (SEM) for each condition.
- 12.Algorithm
- a.Load acquired images into the algorithm.
- b.Detect punctate structures (vesicles) and quantify intensity changes.
- c.Compare results with ImageJ - Find Maxima and manual detection for validation.
Image-processing algorithm
Timing: 2 h
The section outlines the workflow of the image-processing algorithm for detecting exocytosis events (Figure S1).
- 13.Image Pre-processing
- a.Apply a Wiener filter to the raw images which helps to enhance the signal-to-noise ratio (SNR) while preserving edges.
- i.This step improves image clarity and prepares the data for subsequent processing.
Refer to Figure 3B for a visual representation of the pre-processed image.
- 14.Binarization
- a.Convert the pre-processed image into a binary format - Otsu’s Algorithm evaluates the threshold using zeroth and first-order cumulative moments.
- b.Address spatial intensity variations by dividing the image into smaller sub-images (32 × 32 pixels) and applying Otsu’s Algorithm to each sub-image. Note: If low-intensity pixels are not detected, reduce the sub-image size to 16 × 16 pixels or manually adjust the threshold for specific sub-images.Figure 3. Sequential steps involved in the workflow of the image processing algorithm(A and B) Image pre-processing.(C and D) Binarization and processing of the mask.(E and F) Noise removal and filtration.(G–I) Regional Maixma and particle detection.
Refer to Figure 3C for the binarized image.
- 15.Pre-Processing of Mask
- a.Refine the binary mask to isolate specific cell clusters using morphological closing operations (dilation followed by erosion) - Use a disc structuring element with a radius of 100 pixels to bridge larger gaps.
- b.Dilate with a disc of radius 5 ± 3 pixels.
- c.Apply an opening operation with a disc of radius 3 ± 1 pixels.
Refer to Figure 3D for the refined mask.
- 16.Noise Removal and Filtering
- a.Overlay the refined mask onto the original raw image to isolate cell clusters and set background pixels to zero.
Refer to Figure 3E for the masked image.
- b.Scale the intensity values of the masked image between 0 and 1.
- c.Visualize the image matrix as a surface plot, with intensity values representing height at each (x, y) position.
- i.Use the Regional Maxima finding algorithm to identify vesicles as local peaks.
- d.Apply a series of filters to reduce noise and enhance vesicle detection:
- i.Wiener filter
- ii.Sharpening filter
- iii.Gaussian filter
Refer to Figure 3F for the filtered image.
- e.If over-segmentation occurs, apply the H-Max Transform to suppress smaller peaks and reapply the Regional Maxima algorithm.
Refer to Figure 3G for the image after H-Max Transform.
- 17.Detection of Dynamic Events
- a.Identify particle positions across all images in a stack.
- b.Calculate intensity values by averaging the intensity at the particle position and its four neighboring points.
- c.Use the tracker to construct particle trajectories over time, revealing vesicle movement and intensity changes.Note: If no significant motion is detected, use the first frame to determine vesicle positions and calculate intensities for subsequent frames.
- i.Plot intensity values over time and create surface plots for visualization.
Refer to Figure 3I for the final vesicle positions.
- 18.Statistics.
- a.Present data as mean ± standard error of the mean (s.e.m.).
- b.Assess statistical significance using One-way ANOVA.
Expected outcomes
Images and movies of transduced human islets using a high-resolution TIRF microscope would enable the algorithm to identify vesicles (Figure 4, left). Step 6e would enable the detection of exocytosis, as shown in Figure 4, right.Figure 4. Detection of exocytosis using the algorithm(left) The identification of the vesicles in all the frames of the time-lapse movie.(right) Detection of exocytosis events based on changes in intensities in the marked coordinates used to identify vesicles.
The ability of the algorithm to detect particles in images of cells with low signal-to-noise ratio was built gradually by training it to detect particles in artificially ordered images, followed by images of Tetraspeck beads of a known size. The plots in Figure 5 show the accuracy of the algorithm to detect particles in the above-mentioned scenarios when compared to manual by eye-based and find maxima-based detection. The average time the algorithm takes to detect the particles will be significantly less than the other two methods, as shown in Figure 6.Figure 5. Accuracy plots showing the ability of the algorithm to detect particles(A–C) The Algorithm was able to detect efficiently the number of particles in A. the artificial images B. the beads images C. the real cell images in comparison with manual, by-eye detection and find maxima-based detection using Fiji/ImageJ (P-value>0.1).Figure 6. Time plots showing the efficiency of the algorithm to complete tasks accuratly and quickly(A–C) Plots showing the average time taken for the detection of the particles using the three techniques for A. artificial images B. beads images C. real cell images. In all the cases the algorithm was shown to take the significantly less amount of time when compared to the other two techniques (P-value<0.001).
Limitations
The algorithm’s detection is not suitable for images of Hematoxylin and eosin-stained sections of tissues or images from immunohistochemistry sections. Intracellular structures with a size range like the vesicles used here can be detected very efficiently, whereas processing parameters might have to be altered to enable the detection of particles with varying sizes. The exocytosis detection for relatively stationary particles is very detected with utmost precision here. In contrast, tracking of particles beyond a certain limit would not be possible, since this algorithm does not use the usual tracking-based method of exocytosis detection. While this has several uses, this limits the ability of the algorithm to detect extremely active movement of vesicles.
The fluorescent probes used for detection of exocytosis can show difference in fluorescence intensity patterns. Either the parameters of this algorithm have to changed based on probe, or there are many algorithms available based on different fluorescent probe.4^,^19^,^20^,^21^,^22^,^23^,^24^,^25^,^26^,^27^,^28
Troubleshooting
Problem 1
Improper islet dispersion (step 1b).
Potential solution
Islet dispersal is a critical step, and over- or under-dispersal will affect the viability of the cells for further procedures. This problem can occur due to improper digestion of the tissue. Hence, the collagenase concentration and treatment duration need to be determined based on the amount of tissue. Another stage at which this problem can occur is during trypsin digestion of the isolated islets. The amount of trypsin to be used and the incubation time need to be calculated based on the amount of tissue and the permeabilization extent of the tissue.
Problem 2
Lack of fluorescence-positive cells (step 1c).
Potential solution
While using the adenoviral-mediated method of labelling proteins, the MOI can be tweaked in order to achieve the ideal efficiency of positive cells. The ratio between the transfection reagent and the plasmid of interest needs to be standardized while using the transfection-based strategy.
Problem 3
Inability to detect the appropriate number of intracellular structures (vesicles) (step 5a).
Potential solution
The particle in question might be of a different diameter than what this algorithm has been made for. To be able to detect particles in datasets different from ours, the kernel size can be adjusted in the code. This would efficiently help in identifying particles of varying size range.
Resource availability
Lead contact
Further information and requests for resources and reagents should be directed to and will be fulfilled by the lead contact, Nikhil R. Gandasi ([email protected], [email protected]).
Technical contact
Technical questions on executing this protocol should be directed to and will be answered by the technical contact, Aishwarya Makam ([email protected]).
Materials availability
This study did not generate new materials.
Data and code availability
- •The MATLAB code for the algorithm data has been deposited at Github: https://github.com/dabhimanyu/bio_math_model_images.git.
- •Any additional information for reanalyzing this work is available from the lead contact upon request.
- •The version of record of the MATLAB pipeline used in this study is archived on Zenodo: https://doi.org/10.5281/zenodo.17342495 and corresponds to the GitHub release (v.1.0 doi) (Github: https://github.com/dabhimanyu/bio_math_model_images/releases/tag/v1.0-doi).
Acknowledgments
This research was funded by the 10.13039/100007780Indian Institute of Science – seed grants, 10.13039/501100001407Department of Biotechnology (DBT)-Ramalingaswami fellowship, 10.13039/501100001411Indian Council of Medical Research (ICMR) – Grants in Aid Scheme, 10.13039/501100001409Department of Science and Technology (DST)-10.13039/501100001843Science and Engineering Research Board (SERB) – Starting grants, Infosys Young Investigator grant, and Novo Nordisk Foundation grant, Rajiv Gandhi University of Health Sciences Extramural Grants, India were awarded to the N.R.G. lab. We were supported by DST-FIST grants and Longevity India Initiative. A.M. was supported by a fellowship from DBT and Prime Minister’s Research Fellowship (PMRF) for pursuing her PhD.
Author contributions
Conceptualization, N.R.G.; methodology, A.M., V.R., I.B., A.D., and N.R.G.; software, A.M.; validation, A.M., V.R., I.B., and A.D.; formal analysis, A.M., V.R., and I.B.; investigation, A.M. and N.R.G.; resources, A.M. and N.R.G.; data curation, A.M.; writing – original draft, A.M., V.R., I.B., A.T., and N.R.G.; writing – review and editing, A.M., V.R., I.B., A.T., A.D., and N.R.G.; visualization, N.R.G.; supervision, N.R.G.; project administration, N.R.G.; funding acquisition, N.R.G.
Declaration of interests
The authors declare no competing interests.
The reference list from the paper itself. Each links out to its DOI / PubMed record.
- 1Makam A.A.Dubey A.Maharana S.Gandasi N.R.Algorithm for semi-automatic detection of insulin granule exocytosis in human pancreatic β-cells Heliyon 102024 e 3830710.1016/j.heliyon.2024.e 38307 PMC 1148328339421365 · doi ↗ · pubmed ↗
- 2Rorsman P.Renström E.Insulin granule dynamics in pancreatic beta cells Diabetologia 4620031029104510.1007/s 00125-003-1153-112879249 · doi ↗ · pubmed ↗
- 3Wu L.-G.Hamid E.Shin W.Chiang H.-C.Exocytosis and Endocytosis: Modes, Functions, and Coupling Mechanisms Annu. Rev. Physiol.76201430133110.1146/annurev-physiol-021113-17030524274740 PMC 4880020 · doi ↗ · pubmed ↗
- 4Yuan T.Lu J.Zhang J.Zhang Y.Chen L.Spatiotemporal Detection and Analysis of Exocytosis Reveal Fusion “Hotspots” Organized by the Cytoskeleton in Endocrine Cells Biophys. J.108201525126010.1016/j.bpj.2014.11.346225606674 PMC 4302205 · doi ↗ · pubmed ↗
- 5Ouellette N.T.Xu H.Bodenschatz E.A quantitative study of three-dimensional Lagrangian particle tracking algorithms Exp. Fluids 40200630131310.1007/s 00348-005-0068-7 · doi ↗
- 6Gandasi N.R.Yin P.Omar-Hmeadi M.Ottosson Laakso E.Vikman P.Barg S.Glucose-Dependent Granule Docking Limits Insulin Secretion and Is Decreased in Human Type 2 Diabetes Cell Metab.272018470478.e 410.1016/j.cmet.2017.12.01729414688 · doi ↗ · pubmed ↗
- 7Colombo M.Raposo G.Théry C.Biogenesis, Secretion, and Intercellular Interactions of Exosomes and Other Extracellular Vesicles Annu. Rev. Cell Dev. Biol.30201425528910.1146/annurev-cellbio-101512-12232625288114 · doi ↗ · pubmed ↗
- 8Mattheyses A.L.Simon S.M.Rappoport J.Z.Imaging with total internal reflection fluorescence microscopy for the cell biologist J. Cell Sci.12320103621362810.1242/jcs.05621820971701 PMC 2964103 · doi ↗ · pubmed ↗