Association between SARS-CoV-2 in wastewater and COVID-19 hospitalizations in three countries, 2022–2024
Mustapha M. Mustapha, Laura E. Choi, Tobias Bergroth, Hannah R. Volkman, Kate Devlin, Jingyan Yang, Alon Yehoshua, Farid L. Khan, John M. McLaughlin, Jennifer L. Nguyen

TL;DR
This study shows that SARS-CoV-2 levels in wastewater can predict future hospitalizations, helping public health planning.
Contribution
The study demonstrates wastewater surveillance can predict hospitalization rates up to a week in advance across three countries.
Findings
Strong correlation (0.86-0.89) between wastewater virus levels and hospitalization rates in three countries.
Hospitalization rates lagged wastewater levels by about one week, with best prediction accuracy at one-week projections.
Wastewater to hospitalization ratios varied by country, with Denmark having the highest multiplier at 859.3.
Abstract
As fewer jurisdictions report national COVID-19 hospitalization rates and testing of mild and asymptomatic cases is reduced, there is a need to better understand the relationship between COVID-19 hospitalizations and alternative measures of COVID-19 circulation, such as wastewater surveillance. We described the association between levels of SARS-CoV-2 in wastewater and COVID-19 hospitalization rates at the national level during and after the pandemic and explored whether wastewater virus level can predict COVID-19 hospitalization rates. Retrospective analysis of public health reports of national wastewater surveillance and COVID-19 hospitalizations from Denmark, the Netherlands, and the United States from 2022 to 2024. For each country, we calculated Pearson correlation coefficients and hospitalization multipliers (defined as the hospitalization rate for a given scaled wastewater…
Genes, proteins, chemicals, diseases, species, mutations and cell lines named across the full text — each resolved to its canonical identifier and authoritative record.
Click any figure to enlarge with its caption.
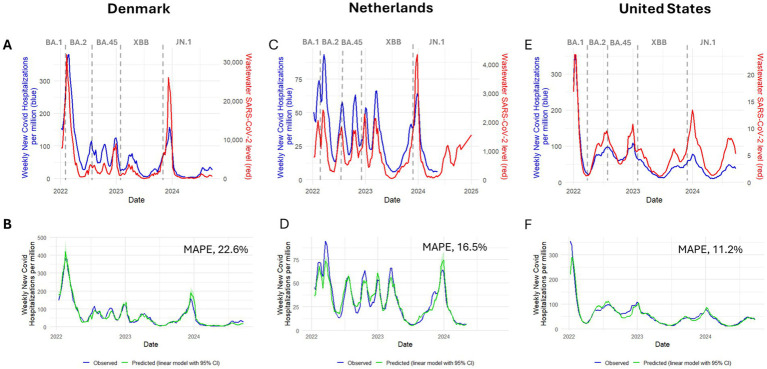 Figure 1
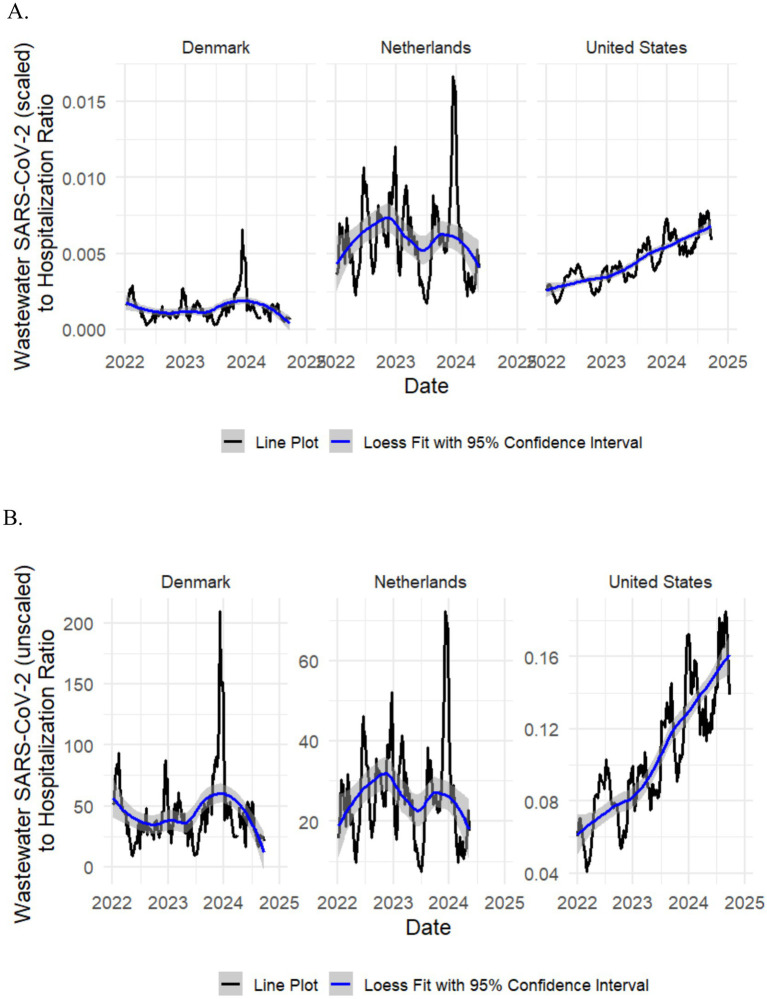 Figure 2
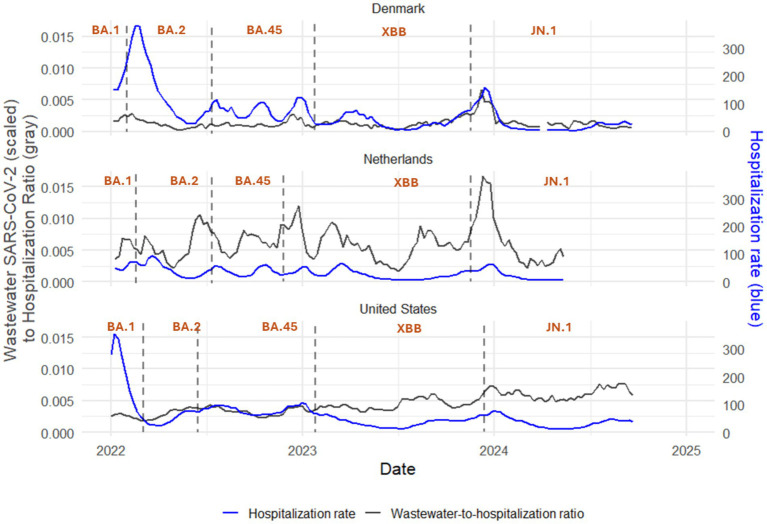 Figure 3
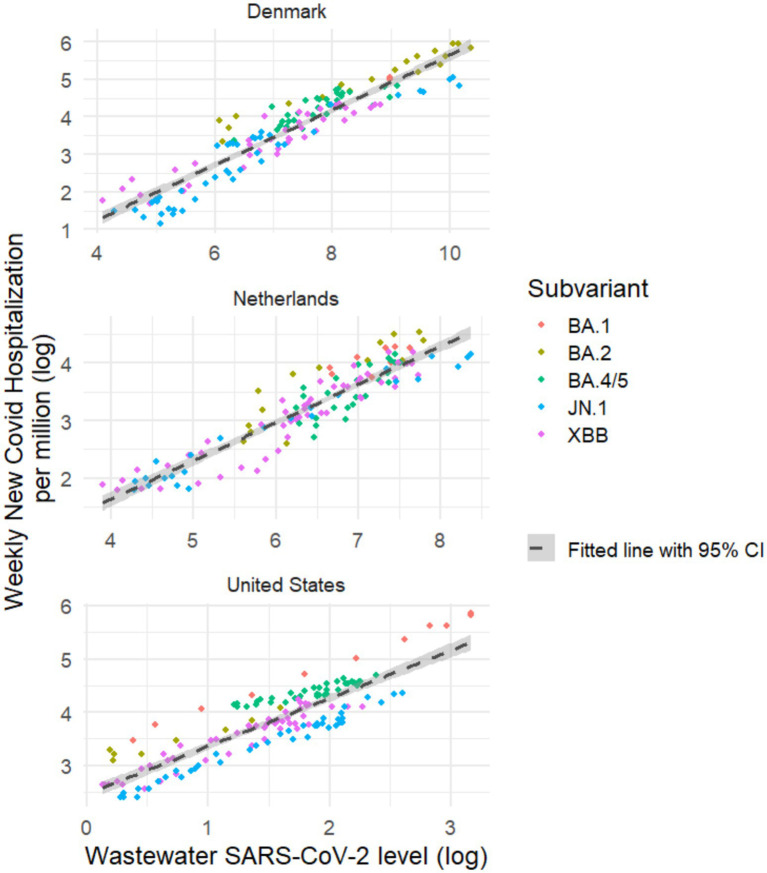 Figure 4
| Country | Variable | Date range | All Omicron, median (IQR) | By predominanta subvariant, median (IQR) | ||||
|---|---|---|---|---|---|---|---|---|
| BA.1 | BA.2 | BA.4/5 | XBB | JN.1 | ||||
| Denmark | Weekly new COVID-19 hospitalization rate, per M | January 6, 2022, to | 41.0 (21.8 to 83.3) | 152.1 (150.9 to 153.2) | 163.5 (71.9 to 272.0) | 72.5 (54.8 to 92.6) | 30.2 (16.6 to 58.1) | 16.5 (5.9 to 31.6) |
| Wastewater SARS-CoV-2 levelb | January 6, 2022, to | 1367.7 | 7907.0 | 7319.2 | 2386.7 | 1386.4 | 518.3 | |
| The Netherlands | Weekly new COVID-19 hospitalization rate, per M | January 8, 2022, to | 28.8 | 57.7 | 47.9 | 32.2 | 23.3 | 12.9 |
| Wastewater SARS-Cov-2 levelc | January 8, 2022, to | 706.0 | 1422.0 | 591.0 | 1030.0 | 574.0 | 586.0 | |
| United States | Weekly new COVID-19 hospitalization rate, per M | January 1, 2022, to | 45.0 | 149.0 | 29.5 | 77.5 | 41.0 | 35.0 |
| Wastewater SARS-CoV-2 leveld | January 1, 2022, to | 5.0 | 9.2 | 1.8 | 6.7 | 4.3 | 5.4 | |
| Country | Measure | Correlation coefficient (95% CI)/# of weeks lead or laga | |||||
|---|---|---|---|---|---|---|---|
| All Omicron | BA.1 | BA.2 | BA.4/5 | XBB | JN.1 | ||
| Denmark | Correlationb | 0.86 (0.82 to 0.90) | NA | 0.94 (0.85 to 0.98) | 0.72 (0.49 to 0.85) | 0.85 (0.73 to 0.92) | 0.94 (0.89 to 0.97) |
| Peak correlationc | 0.88 (0.84 to 0.91) | NA | 0.98 (0.95 to 0.99) | 0.78 (0.60 to 0.89) | 0.89 (0.80 to 0.94) | 0.94 (0.89 to 0.97) | |
| Lead or lagd | Lag 1 week | NA | Lag 1 week | Lag 1 week | Lag 2 weeks | No lead or lag | |
| The Netherlands | Correlation | 0.80 (0.72 to 0.85) | 0.76 (0.12 to 0.95) | 0.91 (0.75 to 0.97) | 0.81 (0.61 to 0.91) | 0.90 (0.83 to 0.94) | 0.96 (0.90 to 0.98) |
| Peak correlation | 0.83 (0.76 to 0.88) | 0.76 (0.12 to 0.95) | 0.98 (0.93 to 0.99) | 0.88 (0.75 to 0.95) | 0.96 (0.92 to 0.98) | 0.96 (0.90 to 0.98) | |
| Lead or lag | Lag 1 week | No lead or lag | Lag 1 week | Lag 1 week | Lag 1 week | Lag 1 week | |
| United States | Correlation | 0.89 (0.85 to 0.92) | 1.00 (0.98 to 1.00) | 0.99 (0.93 to 1.00) | 0.93 (0.87 to 0.96) | 0.91 (0.84 to 0.95) | 0.98 (0.97 to 0.99) |
| Peak correlation | 0.89 (0.85 to 0.92) | 1.00 (0.98 to 1.00) | 0.99 (0.93 to 1.00) | 0.93 (0.87 to 0.96) | 0.94 (0.90 to 0.97) | 0.98 (0.97 to 0.99) | |
| Lead or lag | No lead or lag | No lead or lag | No lead or lag | No lead or lag | Lag 2 weeks | No lead or lag | |
| Country | Median (interquartile range) | |||||
|---|---|---|---|---|---|---|
| All Omicron | BA.1 | BA.2 | BA.4/5 | JN.1 | XBB | |
| Denmark | 859.3 | 613.0 | 757.3 | 998.5 | 825.3 | 831.6 |
| The Netherlands | 178.3 | 191.8 | 226.6 | 138.4 | 224.5 | 173.1 |
| United States | 245.9 | 393.3 | 369.4 | 292.6 | 167.1 | 238.7 |
| Country | Median (interquartile range) | |||||
|---|---|---|---|---|---|---|
| All Omicron | BA.1 | BA.2 | BA.4/5 | XBB | JN.1 | |
| Denmark | 0.027 | 0.0192 | 0.0238 | 0.0313 | 0.0261 | 0.0259 |
| The Netherlands | 0.0411 | 0.0442 | 0.0522 | 0.0319 | 0.0399 | 0.0517 |
| United States | 10.3704 | 16.5874 | 15.5808 | 12.3392 | 10.0655 | 7.0483 |
| Country | Response | Predictors | Regression model coefficients | Model accuracy and goodness of fit | ||||||||
|---|---|---|---|---|---|---|---|---|---|---|---|---|
| Model ID | Intercept | Beta1 | Beta2 | MAPE | RMSE | AIC | BIC | Adj. R2 | CV | |||
| Denmark | Hospitalization rate | Wastewater | 1 | 26.3117 | 335.8185 | 101.5320 | 36.3183 | 1409.1532 | 1417.9781 | 0.7462 | 1469.2126 | |
| Wastewater (1-week lag) | 2 | 25.0774 | 341.6778 | 95.8298 | 34.2718 | 1392.9130 | 1401.7380 | 0.7740 | 1313.0483 | |||
| Log(wastewater) | 3 | 191.3050 | 40.3033 | 135.5194 | 43.6578 | 1460.6898 | 1469.5147 | 0.6332 | 2015.7790 | |||
| Log[wastewater (1-week lag)] | 4 | 190.8308 | 40.4189 | 141.2391 | 43.2823 | 1458.2710 | 1467.0959 | 0.6395 | 1984.1086 | |||
| Calendar days | 5 | 140.5708 | −0.1517 | 120.6669 | 58.0436 | 1540.4370 | 1549.2619 | 0.3516 | 3506.5445 | |||
| Log(hospitalization rate) | Wastewater | 6 | 3.1604 | 4.0236 | 96.0077 | 107.0464 | 352.4933 | 361.3182 | 0.4429 | 0.7216 | ||
| Wastewater (1-week lag) | 7 | 3.1483 | 4.0706 | 95.7711 | 108.2213 | 349.6193 | 358.4442 | 0.4542 | 0.7069 | |||
| Log(wastewater) | 8 | 5.9145 | 0.7301 | 35.9742 | 35.0474 | 151.4454 | 160.2704 | 0.8675 | 0.1709 | |||
| Log[wastewater (1-week lag)] | 9 | 5.9101 | 0.7336 | 32.4986 | 32.9625 | 138.3727 | 147.1976 | 0.8793 | 0.1558 | |||
| Log[wastewater (1-week lag)]; calendar days | 10 | 6.0938 | 0.6309 | −0.0010 | 22.5803 | 14.7158 | 68.5334 | 80.3000 | 0.9272 | 0.0948 | ||
| Log[wastewater (2-week lag)] | 11 | 5.8040 | 0.7039 | 41.6413 | 38.2575 | 195.4880 | 204.2914 | 0.8160 | 0.2364 | |||
| Log[wastewater (2-week lag)]; calendar days | 12 | 6.0079 | 0.5947 | −0.0011 | 33.4587 | 22.5483 | 148.0983 | 159.8362 | 0.8701 | 0.1684 | ||
| Log[wastewater (4-week lag)] | 13 | 5.3967 | 0.5824 | 73.6441 | 53.7921 | 304.5415 | 313.3014 | 0.5757 | 0.5348 | |||
| Log[wastewater (4-week lag)]; calendar days | 14 | 5.6799 | 0.4423 | −0.0014 | 62.3349 | 42.6146 | 272.9827 | 284.6626 | 0.6654 | 0.4250 | ||
| The Netherlands | hospitalization rate | Wastewater | 1 | 13.1675 | 88.6971 | 43.1179 | 12.6943 | 948.5023 | 956.8397 | 0.6370 | 176.8091 | |
| Wastewater (1-week lag) | 2 | 12.3352 | 91.9854 | 38.4411 | 11.9178 | 933.4799 | 941.8173 | 0.6800 | 158.2523 | |||
| Log(wastewater) | 3 | 65.2404 | 16.5128 | 42.3429 | 11.4934 | 924.8483 | 933.1857 | 0.7024 | 136.6031 | |||
| Log[wastewater (1-week lag)] | 4 | 66.0796 | 17.0768 | 41.5510 | 10.8213 | 910.5092 | 918.8465 | 0.7362 | 121.5412 | |||
| Calendar days | 5 | 52.6212 | −0.0464 | 73.8507 | 17.7938 | 1028.8739 | 1037.2113 | 0.2867 | 327.9935 | |||
| Log(hospitalization rate) | Wastewater | 6 | 2.5426 | 3.1236 | 45.0816 | 32.6910 | 173.9112 | 182.2485 | 0.5934 | 0.2621 | ||
| Wastewater (1-week lag) | 7 | 2.5189 | 3.2137 | 43.7820 | 34.5564 | 164.7967 | 173.1341 | 0.6234 | 0.2452 | |||
| Log(wastewater) | 8 | 4.5418 | 0.6646 | 24.4139 | 11.3195 | 49.2661 | 57.6035 | 0.8573 | 0.0869 | |||
| Log[wastewater (1-week lag)] | 9 | 4.5790 | 0.6890 | 19.5775 | 10.4619 | 3.2713 | 11.6086 | 0.9031 | 0.0593 | |||
| Log[wastewater (1-week lag)]; calendar days | 10 | 4.7158 | 0.6287 | −0.0006 | 16.4553 | 7.0263 | −36.1272 | −25.0107 | 0.9310 | 0.0425 | ||
| Log[wastewater (2-week lag)] | 11 | 4.5395 | 0.6757 | 22.3577 | 13.0112 | 48.5837 | 56.8957 | 0.8583 | 0.0871 | |||
| Log[wastewater (2-week lag)]; calendar days | 12 | 4.7004 | 0.6100 | −0.0007 | 19.4164 | 9.8779 | 16.3881 | 27.4709 | 0.8930 | 0.0667 | ||
| Log[wastewater (4-week lag)] | 13 | 4.3142 | 0.5760 | 42.9242 | 18.5462 | 168.8394 | 177.1002 | 0.5988 | 0.2461 | |||
| Log[Wastewater (4-week lag)]; calendar days | 14 | 4.5717 | 0.4869 | −0.0010 | 38.2390 | 15.8497 | 146.6682 | 157.6825 | 0.6714 | 0.2034 | ||
| United States | Hospitalization rate | Wastewater | 1 | −6.9465 | 277.0964 | 31.0861 | 23.3001 | 1303.1409 | 1312.0084 | 0.7762 | 602.5052 | |
| Wastewater (1-week lag) | 2 | −4.8622 | 264.1106 | 28.7247 | 24.5944 | 1318.4938 | 1327.3612 | 0.7507 | 666.2846 | |||
| Log(wastewater) | 3 | 143.9635 | 51.7814 | 47.5568 | 34.9501 | 1418.2925 | 1427.1600 | 0.4965 | 1314.0691 | |||
| Log[wastewater (1-week lag)] | 4 | 142.7768 | 51.3250 | 46.6604 | 34.7918 | 1417.0028 | 1425.8703 | 0.5010 | 1294.4332 | |||
| Calendar days | 5 | 100.9702 | −0.0880 | 64.1076 | 42.4949 | 1473.8038 | 1482.6713 | 0.2556 | 1893.3982 | |||
| Log(hospitalization rate) | Wastewater | 6 | 2.9698 | 3.5888 | 35.0877 | 47.6151 | 142.3462 | 151.2137 | 0.6734 | 0.1600 | ||
| Wastewater (1-week lag) | 7 | 2.9800 | 3.4926 | 34.8754 | 46.6866 | 139.7994 | 148.6668 | 0.6793 | 0.1575 | |||
| Log(wastewater) | 8 | 5.2903 | 0.8882 | 28.5787 | 27.3244 | 98.4463 | 107.3138 | 0.7603 | 0.1160 | |||
| Log[wastewater (1-week lag)] | 9 | 5.2771 | 0.8846 | 27.4228 | 27.7922 | 89.6188 | 98.4863 | 0.7747 | 0.1089 | |||
| Log[wastewater (1-week lag)]; calendar days | 10 | 5.6803 | 0.8205 | −0.0010 | 11.2378 | 14.8143 | −130.3849 | −118.5616 | 0.9525 | 0.0230 | ||
| Log[wastewater (2-week lag)] | 11 | 5.1748 | 0.8309 | 28.1959 | 25.6548 | 106.9636 | 115.8099 | 0.7284 | 0.1235 | |||
| Log[wastewater (2-week lag)]; calendar days | 12 | 5.5514 | 0.7676 | −0.0010 | 17.5296 | 17.9373 | −21.3438 | −9.5487 | 0.8914 | 0.0497 | ||
| Log[wastewater (4-week lag)] | 13 | 4.8518 | 0.6519 | 38.3401 | 22.8450 | 173.0608 | 181.8642 | 0.5041 | 0.2005 | |||
| Log[wastewater (4-week lag)]; calendar days | 14 | 5.1863 | 0.5871 | −0.0009 | 32.5134 | 20.2407 | 126.6521 | 138.3900 | 0.6474 | 0.1440 | ||
Peer Reviews
No public reviews on file for this paper yet. If you reviewed it on a platform where reviews are public (OpenReview, ICLR, NeurIPS, ICML), you can paste yours below so the community can read it here.
Videos
No videos yet. Explain this paper in a talk, walkthrough, or lecture? Add one.
Taxonomy
TopicsSARS-CoV-2 detection and testing · COVID-19 epidemiological studies · COVID-19 Clinical Research Studies
Introduction
COVID-19 hospitalizations are an important measure of disease severity and an indicator of the public health burden of COVID-19 (1). National COVID-19 hospitalization rates reflect the overall strain on healthcare systems, guiding resource allocation and policy decisions including emergency preparedness (2, 3). Unlike case counts, which can be influenced by testing availability and individual reporting behaviors, hospitalization rates provide a more stable and clinically meaningful measure of disease burden. Monitoring hospitalization rates at the national level enables timely, coordinated responses to surges in severe illness and supports strategic planning for current and future public health threats (2, 3).
Following declaration of an end to the pandemic by the World Health Organization in May 2023, there was decreased reporting of SARS-CoV-2 infections and COVID-19 hospitalizations. This reduction in reporting in the post-pandemic period has increased the need for alternative measures of disease burden, such as wastewater SARS-CoV-2 levels (4). Wastewater surveillance has emerged as an important measure of community-level infection trends independent of the availability of COVID-19 testing, and can provide an early measure of potential increases in more severe illness (5–7). Such early data may aid timely public health decision-making and resource planning, such as allocation of hospital resources. Several studies have demonstrated a strong correlation between wastewater SARS-CoV-2 levels and measures of COVID-19 burden, including hospitalizations (5, 6, 8–23). However, most of these studies reported data at the municipal or sub-national level, or over a relatively short period of a few months (5, 6, 8–11, 14, 15, 18, 19, 22, 24–27). Few studies have examined the use of wastewater as a potential correlate of COVID-19 hospitalizations on a national scale. A study in the United States that assessed wastewater surveillance data from 159 counties in 45 states from June 2021 through January 2023 found that wastewater-based models accurately predicted county-level weekly new COVID-19 admissions in the following 1–4 weeks (13). Two additional studies from the United States each found a strong positive correlation between county wastewater virus levels and reported COVID-19 cases from June 2020 to May 2021 (21) and with reported COVID-19 cases and COVID-19 hospitalizations in the upcoming 2 weeks from January to September 2022 (21, 23). A study of Austria’s wastewater surveillance system covering about 70% of the country’s population from April 2020 through August 2022 found that wastewater viral loads were predictive of COVID-19 hospital occupancy, with an average lead time of 9–12 days, allowing prediction of short-term demand for public health services (12).
Here we describe the association between wastewater SARS-CoV-2 levels and COVID-19 hospitalization rate from 2022 through 2024 and explore whether wastewater virus level can predict current and anticipated COVID-19 hospitalization rates at the aggregate national level.
Methods
Study design
This study was a retrospective analysis of public health reports of national wastewater surveillance and COVID-19 hospitalizations from 2022 through 2024.
Inclusion criteria
We conducted a search for national wastewater surveillance and COVID-19 hospitalization data among 27 countries included in a prior study evaluating under-reporting of SARS-CoV-2 infections (28). These 27 countries were selected based on the availability of COVID-19 case report data: Austria, Belgium, Brazil, Canada, Chile, China, Colombia, Denmark, Finland, France, Germany, Greece, Ireland, Israel, Italy, Japan, Luxembourg, Malaysia, the Netherlands, Portugal, Qatar, Singapore, South Africa, Spain, Sweden, the United Kingdom, and the United States.
Our search yielded three countries—Denmark, the Netherlands, and the United States—that met the criteria for sufficient data for analysis, defined as: (1) availability of ≥24 months of national SARS-CoV-2 wastewater surveillance data starting from January 2022 [e.g., United States (24), Denmark (17, 29), and the Netherlands (30)], and (2) availability of data on weekly new COVID-19 hospital admissions and/or hospital occupancy starting from January 2022 (31–33).
Wastewater SARS-CoV-2 levels
Wastewater SARS-CoV-2 surveillance data were obtained through publicly available country-specific dashboards, reports, and official websites. Countries were included in the wastewater analyses if datasets were downloadable and provided at least 2 years of data starting January 2022. We excluded countries without publicly available national aggregate wastewater values, even if they reported regional or sub-national data. In cases where reported data were not downloadable, the study team contacted publishers of nationally representative wastewater reports.
In Denmark, wastewater SARS-CoV-2 levels are reported as SARS-CoV-2 relative to fecal matter x 10^7^ during January 6, 2022 through September 19, 2024 (29). In the Netherlands, wastewater SARS-CoV-2 levels are reported as average number of SARS-CoV-2 particles x 10^11^ during January 8, 2022 through September 21, 2024 (30). In the United States, wastewater SARS-CoV-2 levels are defined as the number of standard deviations above the baseline wastewater SARS-CoV-2 level, transformed to the linear scale (reported as National Wastewater Viral Activity Level) during January 1, 2022, through September 21, 2024 (34). All wastewater datasets were downloaded on October 28, 2024.
COVID-19 hospitalizations
Data on COVID-19 hospitalizations were sourced from official public health surveillance reports for all countries with available wastewater surveillance data. Nationally representative measures of hospitalizations were collected, prioritizing data on weekly new hospitalizations expressed as rates per million inhabitants when available. We also supplemented our search of official sources of hospitalization data with data on COVID-19 hospitalization from public repositories including Our World in Data (32).
Hospitalization rates were obtained from the Statens Serum Institut web page for Denmark (29). Netherlands hospitalization rates were obtained from Our World In Data, a publicly available resource that sources hospitalization data from the Netherlands National Coordination Center Patient Distribution (32, 35). In the United States, hospitalization rates were obtained from the Centers for Disease Control and Prevention’s COVID-19 Hospitalization Surveillance Network (COVID-NET) dashboard which monitors laboratory-confirmed, COVID-19-associated hospitalizations (31). All hospitalization datasets were downloaded on October 28, 2024.
Subvariant predominance
For each country, we defined a subvariant predominance period as any consecutive period when a specific subvariant attained 50% or higher prevalence for ≥4 weeks. Subvariant prevalence was sourced from publicly available databases such as covariants.org or national SARS-CoV-2 surveillance reports. For each country, we defined predominance period by major variant of concern (Omicron) and its major subvariants – BA.1, BA.2, BA.4/5, XBB, or JN.1 (Supplementary Table).
Data cleaning and exploratory data analyses
Completeness and consistency of variables were evaluated through exploratory analyses. Variables with differing reporting frequencies (e.g., daily vs. weekly) were standardized by converting daily data into trailing weekly sums. For countries without clear day of the week when data are reported (example, “week 1, 2022”), we assigned the weekly value to the Saturday corresponding to the United States CDC “Epi Week” reporting, a widely adopted standard for public health surveillance reporting (36). All COVID-19 hospitalization data were converted to weekly new hospitalization rate per million population using United Nations population estimates in instances where only raw numbers of hospitalizations were available (37). Across the three countries included in this study, there was one missing data point from Denmark (weekly hospitalization rate for the week of April 4, 2024) and two missing data points from the Netherlands (wastewater virus levels for the weeks corresponding to October 8, 2023 and September 29, 2024). Weeks with missing data were excluded from the analysis.
Scaled wastewater SARS-CoV-2 level
To enable cross-country comparisons, national wastewater SARS-CoV-2 levels were scaled from 0 to 1 by dividing observed levels by the maximum level for each country during the study period. A uniform scale for wastewater SARS-CoV-2 levels partially overcomes the heterogeneity of measurement scales for our data. For example, wastewater SARS-CoV-2 levels were reported as SARS-CoV-2 relative to fecal matter x 10^7^ in Denmark, average number of SARS-CoV-2 particles x 10^11^ in the Netherlands, and number of standard deviations above the baseline wastewater SARS-CoV-2 level, transformed to the linear scale in the United States.
Statistical analyses
For each country, we calculated descriptive statistics including medians and interquartile ranges for national wastewater virus levels and hospitalization rates for the overall study period and by subvariant predominance. We explored the association between wastewater virus levels and hospitalization rate using line plots, scatterplots, and correlation coefficients. We also assessed different lags between wastewater and hospitalization data for each country overall, and by subvariant predominance, using analysis of peak correlation coefficients (38) within a range of 0–4 weeks lead or lag. For variable combinations with sample sizes ≥8 weeks, we calculated Pearson correlation coefficients along with corresponding 95% confidence intervals (CI) using the cor function in R version 4.1 (39). Data consistency and variability were evaluated to identify appropriate statistical transformations, such as logarithmic scaling.
To explore time trends in the association between hospitalization rates and wastewater virus levels, we calculated two measures: (1) Wastewater to hospitalization ratio – defined as scaled wastewater SARS-CoV-2 level divided by weekly new COVID-19 hospitalization rate per million, which is a measure of the scaled wastewater virus level for a given weekly new COVID-19 hospitalization rate (2) Hospitalization multiplier – defined as the inverse of wastewater to hospitalization ratio. The hospitalization multiplier is a measure of national hospitalization rate for a given scaled wastewater level. For example, a hospitalization multiplier of 100 can be interpreted as a weekly new COVID-19 hospitalization rate that is approximately a hundred times the observed scaled wastewater level. The rationale for a hospitalization multiplier is to generate a simple number that can be applied in real world settings to translate a given scaled wastewater virus level into an expected weekly new COVID-19 hospitalization rate. Medians, interquartile ranges (IQR), and descriptive plots by country and predominant subvariant were generated for these two measures.
We explored whether wastewater SARS-CoV-2 levels were predictive of weekly new COVID-19 hospitalizations by evaluating several country-specific linear regression models using weekly new COVID-19 hospitalization, with or without log-transformation as a response variable, and scaled wastewater SARS-CoV-2 levels, with a lag of 0–4 weeks and log-transformations as the main predictor. We used lags of 0–4 weeks in keeping with previous studies and the available weekly hospitalization rates in all three countries in our study (5, 8, 11, 12). We also explored whether the association between hospitalization and wastewater virus level was consistent over time by including number of days since January 1, 2022 as a covariate in our regression models. We evaluated regression models using Akaike and Bayesian information criteria (AIC and BIC), adjusted R^2^, as well as mean absolute percent error (MAPE) and root mean square error (RMSE). We chose MAPE as the main model selection criterion because it was both scale and model agnostic.
All identified data sources were downloaded on October 28, 2024, and analyzed using R v4.1. Medians and interquartile ranges were calculated using the R quantile function and the cor function was used for correlation analyses (39).
Results
Denmark
Wastewater SARS-CoV-2 levels (reported as SARS-CoV-2 relative to fecal matter x 10^7^) had a median of 1367.7 × 10^7^ (IQR, 551.3 to 3359.4) during January 6, 2022 through September 19, 2024, with a decreasing trend over time (Table 1; Figure 1A). The highest median wastewater SARS-CoV-2 level was observed during BA.1 predominance (7907.0 × 10^7^; IQR, 7905.4 to 7908.6), followed by BA.2 (7319.2 × 10^7^; IQR, 1210.4 to 17625.7), with the lowest median levels occurring during XBB (1386.4 × 10^7^; IQR, 679.0 to 2396.0) and JN.1 predominance (518.3 × 10^7^; IQR, 196.3 to 925.8). Median weekly new COVID-19 hospitalization rates per million population were 41.0 (IQR, 21.8 to 83.3) for the full study period (Table 1; Figure 1A). The highest COVID-19 hospitalization rates were observed during BA.2 predominance with a median of 163.5 weekly new COVID-19 hospitalizations per million (IQR, 71.9 to 272.0), followed by BA.1 predominance (median 152.1; IQR, 150.9 to 153.2), and lowest during XBB (median 30.2; IQR, 16.6 to 58.1) and JN.1 predominance (median 16.5; IQR, 5.9 to 31.6).
Wastewater SARS-CoV-2 level and weekly new COVID-19 hospitalizations over time (A,C,E), and observed and predicted weekly new COVID-19 hospitalizations (B,D,F) in Denmark (A,B), the Netherlands (C,D), and the United States (E,F), 2022–2024. Vertical dashed lines represent start/end dates of Omicron subvariant predominance. Predicted hospitalizations are based on a Model #10 in Tables 5, which is a linear regression model that uses log-transformed, scaled wastewater virus levels with 1 week lag and calendar days as predictors and log-transformed weekly new COVID-19 hospitalizations as outcome. Model coefficients and goodness of fit measures are provided in Table 5 (Model #10). MAPE – mean absolute percentage error for Model #10.
The Netherlands
In the Netherlands, wastewater SARS-CoV-2 level (reported as average number of SARS-CoV-2 particles x 10^11^) had a median of 706.0 (IQR, 343.0 to 1228.5) during January 8, 2022 through September 21, 2024 (Table 1; Figure 1C) (30, 40). Wastewater virus levels were highest during BA.1 predominance (1422.0 × 10^11^; IQR, 1014.8 to 1663.5), followed by BA.4/5 (1030.0 × 10^11^; IQR, 662.0 to 1565.0), and were lowest during XBB (574.0 × 10^11^; IQR, 266.0 to 1130.0), and JN.1 predominance (586.0 × 10^11^; IQR, 147.5 to 1072.0). Median weekly new COVID-19 hospitalization rate per million was 28.8 (IQR, 14.5 to 46.9) during January 8, 2022, through May 4, 2024 (Table 1; Figure 1C). Hospitalization rates peaked during BA.1 predominance with 57.7 new COVID-19 hospitalizations per million (IQR, 48.8 to 70.0), followed by 47.9 per million (IQR, 19.9 to 71.0) during BA.2 predominance, and were lowest during XBB (23.3 per million; IQR, 11.1 to 38.7) and JN.1 predominance (12.9 per million; IQR, 7.30 to 33.5).
United States
In the United States, wastewater SARS-CoV-2 level is defined as the number of standard deviations above the baseline wastewater SARS-CoV-2 level, transformed to the linear scale (reported as National Wastewater Viral Activity Level) (24). Median wastewater SARS-CoV-2 level was 5.0 (IQR, 2.7 to 7.2) during January 1, 2022, through September 21, 2024 (Table 1; Figure 1E). The highest levels were observed during BA.1 predominance (median, 9.2; IQR, 3.2 to 18.1), followed by BA.4/5 (median, 6.7; IQR, 5.0 to 8.3), JN.1 (median, 5.4; IQR, 2.3 to 7.8), and XBB (median, 4.3; IQR, 2.1 to 5.6). Median weekly new COVID-19 hospitalization rate per million population was 45.0 (IQR, 29.0 to 71.0) during January 1, 2022 through September 21, 2024 (Table 1; Figure 1E) (31). Hospitalization rates peaked during BA.1 predominance (149.0 per million; IQR, 66.5 to 277.5), followed by BA.4/5 (77.5 per million; IQR, 70.8 to 94.0), and were lowest during JN.1 (35.0 per million; IQR, 18.0 to 45.0) and BA.2 predominance 29.5 (25.0 to 41.0).
Hospitalization multipliers
The median hospitalization multipliers using scaled wastewater SARS-CoV-2 level were 859.3 (IQR, 621.7 to 1210.4), 178.3 (IQR, 133.7 to 243.7), and 245.9 (IQR, 184.0 to 293.7) for Denmark, the Netherlands, and the United States, respectively, during the study period (Table 3; for multipliers using unscaled wastewater SARS-CoV-2 level, see Table 4). There was no clear temporal trend in median hospitalization multiplier in Denmark and the Netherlands with a potential trend of decreasing median multipliers over time in the United States (Table 3). In Denmark, median hospitalization multipliers peaked during BA.4/5 predominance (998.5; IQR, 831.2 to 1118.6) and were lowest during BA.1 predominance (613.0; IQR, 608.6 to 617.3). In the Netherlands, median hospitalization multipliers peaked during BA.2 predominance (226.6; IQR, 81.8 to 298.0) and were lowest during BA.4/5 predominance (138.4; IQR, 121.1 to 183.6). In the United States, median hospitalization multipliers peaked at 393.3 (IQR, 360.9 to 485.5) during BA.1 predominance and were lowest during JN.1 predominance at 167.1 (IQR, 144.5 to 184.6). Loess plots (Figures 2, 3) also show no clear temporal trend in wastewater to hospitalization ratio in Denmark and the Netherlands with potential trend of increasing wastewater to hospitalization ratios in the United States.
Ratio of scaled (A) and unscaled (B) wastewater SARS-CoV-2 level to weekly new COVID-19 hospitalization rate per million in Denmark, the Netherlands, and the United States, 2022–2024.
Line charts of ratio of scaled wastewater SARS-CoV-2 level to weekly new COVID-19 hospitalization rate per million (gray, left y-axis) with weekly new COVID-19 hospitalization rate per million (blue, right y-axis) in Denmark, the Netherlands, and the United States, 2022–2024. Vertical dashed lines represent start/end dates of Omicron subvariant predominance.
Correlation analysis
There was a strong correlation (Pearson correlation coefficients ≥0.80) between weekly new COVID-19 hospitalization rate and wastewater SARS-CoV-2 level in all three countries (Table 2). In Denmark, the correlation coefficient was 0.86 (95% CI, 0.82 to 0.90), in the Netherlands it was 0.80 (95% CI, 0.72 to 0.85), and in the United States it was 0.89 (95% CI, 0.85 to 0.92). Correlations were consistently strong across all subvariant predominance periods in all three countries (range, 0.72 to 1.0). Across all Omicron subvariant predominance periods, correlations in the United States remained consistently high (≥0.91), while correlations in Denmark showed more variability, with the strongest correlation during BA.2 (0.94, 95% CI: 0.85 to 0.98) and JN.1 (0.94, 95% CI: 0.89 to 0.97) but a relatively weaker correlation during BA.4/5 (0.72, 95% CI: 0.49 to 0.85). In the Netherlands, correlations were lowest during BA.1 (0.76, 95% CI: 0.12 to 0.95) and highest during JN.1 predominance (0.96, 95% CI: 0.90 to 0.98).
The peak correlation between weekly hospitalization rate and wastewater for Denmark and the Netherlands occurred at a lag of 1 week while peak correlation for the United States had no lead or lag (Table 2). However, linear regression models suggested a 1-week lag between hospitalization rate and wastewater virus levels in all three countries (Table 5).
Regression models
For Denmark, the Netherlands, and the United States, the best fitting regression model used log-transformed weekly new COVID-19 hospitalization rate as response variable with log-transformed wastewater virus level from the previous week and calendar days as covariates (Table 5; Figures 1B,D,F, 4). Model intercepts (6.1, 4.7, and 5.7, for Denmark, the Netherlands and the United States, respectively), regression coefficients for wastewater virus level (0.63, 0.63, and 0.82, for Denmark, the Netherlands and the United States, respectively), and calendar days (−0.0010, −0.0006 and −0.0010 for Denmark, the Netherlands and the United States, respectively) were generally similar across the three countries in our study. These models suggest that (1) log-transformed weekly hospitalization rate increases as the log-transformed previous-week wastewater SARS-CoV-2 level increases, and (2) in all three countries, there was a statistically significant decrease in log-transformed weekly hospitalization rate over time after adjusting for wastewater virus level.
Weekly new COVID-19 hospitalizations (log-transformed) and wastewater SARS-CoV-2 level (log-transformed) by predominant subvariant.
The best fitting regression model was the same for all three countries (model 10 in Table 5, Supplementary Figures 1–3) with high adjusted R^2^ values (>0.9) and MAPE of 22.6, 16.5 and 11.2% for Denmark, the Netherlands, and the United States, respectively. Increasing the wastewater lag to 2–4 weeks reduced model accuracy but still provided moderately accurate predictions. For example, increasing the wastewater lag to 2 weeks (4 weeks) increased MAPE to 33.5, 19.4, and 17.5% (62.3, 38.2, and 32.5%), in Denmark, the Netherlands and the United States, respectively (models 12 and 14 in Table 5).
Discussion
In this study, we evaluated the association between levels of SARS-CoV-2 in wastewater and COVID-19 hospitalization rates at the national level from January 2022 through September 2024 (encompassing both pandemic and post-pandemic periods) in Denmark, the Netherlands, and the United States. We found a strong positive correlation between wastewater SARS-CoV-2 levels and weekly new COVID-19 hospitalization rates in all three countries with overall correlation coefficients ranging from 0.80 to 0.89. Correlation coefficients ranged from 0.72 to 1.0 during BA.1, BA.2, BA.4/5, XBB, and JN.1 predominance periods. Correlation coefficients were consistently high in the United States (>0.9) during all subvariant predominance periods while there was some variation in correlation coefficients in Denmark (range 0.72 to 0.94) and the Netherlands (range, 0.76 to 0.96). These differences may reflect variation in national testing intensity, hospitalization admission criteria, or the response of health systems during different phases of the pandemic. Taken together, these results suggest that SARS-CoV-2 wastewater virus levels are a reliable predictor of COVID-19 hospitalization rates both during and after the pandemic and regardless of changes in circulating variants, even though the degree of correlation of wastewater to hospitalization dynamically changes during the different waves of infection. These findings align with several studies reporting strong positive correlations between wastewater virus levels and COVID-19 hospitalizations across diverse geographic settings and variant predominance (5, 8, 11–15, 41).
We also observed that the peak correlation between wastewater SARS-CoV-2 levels and weekly hospitalizations occurred with a one-week lag in Denmark and Netherlands while peak correlation coefficients occurred with no lead or lag in the United States. In all three countries, the best fitting linear regression models used a 1-week lag between hospitalization and wastewater virus levels, and included log-transformed, scaled, wastewater virus level and calendar days as predictors and log-transformed hospitalization rate as outcome. This model performed best overall across Omicron sub-variant predominance periods and across geographical regions. Taken together, our findings suggest a lag between wastewater virus level and hospitalization rate of 1 week for Denmark and Netherlands and 0–1 week for the United States. Our results are consistent with previous studies of wastewater SARS-CoV-2 levels and hospitalization, which reported lags of 4 to 12 days (5, 8, 11, 12, 14, 15, 42). The reason for a lag between hospitalization and wastewater SARS-CoV-2 levels likely reflects the natural history of SARS-CoV-2 infection, with virus shedding beginning at the presymptomatic and early symptomatic stage, and severe symptoms that would require hospitalization generally occurring days after initial symptoms begin (43). Another potential reason for a lag between wastewater and hospitalization rates could be reporting delays in hospitalization data.
Hospitalization multipliers (the hospitalization rate for a given scaled wastewater virus level) were highly variable across countries with medians of 859.3 (IQR, 621.7 to 1210.4), 178.3 (IQR, 133.7 to 243.7), and 245.9 (IQR, 184.0 to 293.7) in Denmark, the Netherlands and the United States, respectively. Regression models, however, showed a statistically significant decrease in hospitalization rate relative to wastewater virus levels over time in all three countries during the study period. The trend of decreasing hospitalization rates relative to wastewater virus levels is likely due to an increase in population immunity from immunizations and infection over time (1). Alternatively, the decreasing hospitalization could also be due to improvements in outpatient treatment of infected cases and/or decreasing virulence of recent SARS-CoV-2 variants (2).
This finding is consistent with a study from Florida (USA) that found total COVID-19 hospitalizations relative to wastewater were highest during the initial infection wave in 2020 followed by Delta and Omicron waves (10). Although a subsequent study conducted in California reported that wastewater to hospitalization ratios were relatively consistent across two Omicron waves of infections (a likely Omicron BA.1/BA.2 wave from December 2021 through March 2022 and a likely BA.4/5 wave from April through September 2022) (8). Discrepancies between these studies could be a result of their limited geographic scope or differences in time periods. Namely, while rates of hospitalization have fallen over time, there may not have been dramatic differences in rates of hospitalization between the first two Omicron waves. Regardless, our finding of decreased hospitalizations relative to wastewater virus levels over time in Denmark, the Netherlands, and the United States is likely a result of increasing population immunity to SARS-CoV-2, improved early treatment of COVID-19, or both (44). Hospitalization multipliers are easy to compute and interpret and could serve as a contemporaneous measure of disease burden. A knowledge of historical multipliers for any given country can be applied to the wastewater level today to calculate expected hospitalization burden. In essence, hospitalization multipliers enable public health professionals to rapidly translate wastewater surveillance signals into expected healthcare demand, thereby supporting proactive resource allocation. In summary, wastewater surveillance data offers a population-level signal of infection trends that precedes increases in hospitalizations, and is independent of clinical testing rate, thereby supporting timely public health decision-making and resource planning.
Limitations
This study has several limitations. First, it focused on three countries with publicly available national wastewater surveillance data, limiting the generalizability of the findings. Additional studies from a broader range of countries, particularly low- and middle-income settings, are needed to understand the global association between wastewater surveillance and COVID-19 hospitalizations (45). While scaling SARS-CoV-2 wastewater concentrations to each country’s observed maximum enables within-country temporal comparisons, differences in assay type, viral target regions, sample processing protocols, and normalization strategies limit the interpretation of results across settings. Likewise, differences in hospitalization rates may be due to heterogeneity in hospitalization definitions, availability of testing, population immunity levels, and vaccination coverage across countries during the study period. Additional factors that may explain differences in hospitalization multipliers include differences in population composition such as age, and immune status, differences in vaccine coverage, prior infections and prevailing SARS-CoV-2 variants (38, 46–49). For example, the U. S. reports SARS-CoV-2 wastewater virus levels as deviations from historical baselines, whereas Denmark and the Netherlands use absolute viral load measures relative to fecal content. These discrepancies may partially account for the observed differences in hospitalization multipliers and model coefficients. For example, both regression and correlation analysis found a 1-week lag between wastewater virus levels and hospitalization rate in Denmark and Netherlands while in the United States, regression analysis found a lag of 1 week in contrast to correlation analysis that found no lead or lag. While it is reasonable to assume that the true lag in the United States is somewhere between 0 and 7 days, it is difficult to determine whether the true lag is closer to 7 days.
Second, the aggregation of data at the national level on a weekly time scale may mask regional variations or localized spikes in infections and hospitalizations. In addition, efforts to make wastewater data comparable across jurisdictions do not capture underlying differences in sample collection, laboratory methods, and data aggregation. Developing standardized protocols for wastewater data collection, analysis, and reporting is essential for improving comparability. Similarly, there are subtle differences in how COVID-19 hospitalizations are defined, with the US reporting weekly new COVID-19 hospitalization rate based on a representative sample of the US population, while hospitalization rates in Denmark and the Netherlands were based on total number of weekly new COVID-19 hospitalizations at the national level which may include both patients with COVID-19 as their primary cause of hospitalization and patients with incidental infections (2, 40). In Netherlands, it is reported that only about 54 to 78% of hospitalized SARS-CoV-2-infected patients had COVID-19 as the primary or a secondary reason for admission (40). Another potential source of uncertainty is within country changes in number of wastewater monitoring sites and refinements of laboratory and/or statistical methods. For example, the proportion of the U. S. population served by national wastewater surveillance sites increased from 12% in 2020 to 45% in 2022 (24). In Denmark, the number of sampling sites declined from 202 in April 2022 to 29 in April 2024 with corresponding reduction in population coverage from 85 to 48% (50).
Third, while hospitalization multipliers can provide important information on real-time COVID-19 burden in real world settings, these multipliers are context specific and not generalizable between different settings. Also, hospitalization multipliers do not account for temporal changes in the relationship between wastewater virus level and hospitalization driven by changes in surveillance systems and/or changes in disease severity over time. Thus, hospitalization multipliers should be ideally supplemented with additional epidemiologic data including test positivity rate, emergency department and/or urgent care visits and context-specific modeling.
Fourth, we used linear regression models with a limited number of variables, namely, scaled wastewater virus level and calendar days to predict national COVID-19 hospitalization rate. Our model could potentially be improved with additional epidemiological variables and/or more complex modelling approaches.
Conclusion
SARS-CoV-2 wastewater virus levels were strongly correlated with COVID-19 hospitalization rates in the following week, providing a cost-effective method for real-time COVID-19 tracking in the post-pandemic era as global and national COVID-19 surveillance systems continue to wind down.
The reference list from the paper itself. Each links out to its DOI / PubMed record.
- 1Nikolla DA Oskvarek J J Zocchi MS Rahman NA Leubitz A Moghtaderi A . 2024;16:e 56546. doi: 10.7759/cureus.56546 PMC 1102778838646211 · doi ↗ · pubmed ↗
- 2Taylor CA Patel K Pham H Kirley PD Kawasaki B Meek J . COVID-19-Associated Hospitalizations Among U.S. Adults Aged >/=18 Years - COVID-NET, 12 States, October 2023-April 2024. MMWR Morb Mortal Wkly Rep. (2024) 73:869–75. doi: 10.15585/mmwr.mm 7339 a 239361542 PMC 11449267 · doi ↗ · pubmed ↗
- 3Allan M Lievre M Laurenson-Schafer H de Barros S Jinnai Y Andrews S . The World Health Organization COVID-19 surveillance database. Int J Equity Health. (2022) 21:167. doi: 10.1186/s 12939-022-01767-5, 36419127 PMC 9685131 · doi ↗ · pubmed ↗
- 4WHO. Statement on the fifteenth meeting of the IHR (2005) Emergency Committee on the COVID-19 pandemic. Geneva: World Health Organization (2024).
- 5Kirby AE Walters MS Jennings WC Fugitt R La Cross N Mattioli M . Using Wastewater Surveillance Data to Support the COVID-19 Response - United States, 2020-2021. MMWR Morb Mortal Wkly Rep. (2021) 70:1242–4. doi: 10.15585/mmwr.mm 7036 a 2, 34499630 PMC 8437053 · doi ↗ · pubmed ↗
- 6Mc Mahan CS Self S Rennert L Kalbaugh C Kriebel D Graves D . COVID-19 wastewater epidemiology: a model to estimate infected populations. Lancet Planet Health. (2021) 5:e 874–81. doi: 10.1016/S 2542-5196(21)00230-8, 34895497 PMC 8654376 · doi ↗ · pubmed ↗
- 7WHO. Environmental surveillance for SARS-Co V-2 to complement other public health surveillance. Geneva: World Health Organization (2024).
- 8Kadonsky KF Naughton CC Susa M Olson R Singh GL Daza-Torres ML . Expansion of wastewater-based disease surveillance to improve health equity in California's Central Valley: sequential shifts in case-to-wastewater and hospitalization-to-wastewater ratios. Front Public Health. (2023) 11:1141097. doi: 10.3389/fpubh.2023.1141097, 37457240 PMC 10348812 · doi ↗ · pubmed ↗