Histogram analysis of diffusion-weighted imaging with a fractional order calculus model in breast cancer: diagnostic performance and associations with prognostic factors
Bo Hu, Caili Tang, Qilan Hu, Xu Yan, Tao Ai

TL;DR
This study shows that a new imaging model called FROC can help distinguish breast cancer from benign tumors and is linked to important cancer markers.
Contribution
The study introduces a fractional order calculus model for diffusion-weighted imaging, showing its diagnostic performance and associations with breast cancer biomarkers.
Findings
FROC histogram metrics showed diagnostic performance comparable to ADC in differentiating benign and malignant breast lesions.
FROC parameters were significantly associated with ER/PR status, proliferation, and nodal involvement in breast cancer.
FROC-based analysis captures microstructural heterogeneity not captured by traditional ADC metrics.
Abstract
This study aims to evaluate the diagnostic performance of diffusion-weighted imaging (DWI) with a fractional order calculus (FROC) model for differentiating breast lesions and to explore the associations between FROC/apparent diffusion coefficient (ADC)-derived diffusion metrics and prognostic biomarkers and molecular subtypes in breast cancer. This retrospective study included 147 patients with 159 histopathology-confirmed lesions who underwent multi-b DWI using simultaneous multi-slice (SMS) readout-segmented echo-planar imaging (rs-EPI) at 3.0 T. Whole-lesion histograms were computed for mono-exponential ADC and FROC parameters (D, β, μ). The Mann–Whitney U test was used to compare the histogram metrics of each diffusion parameter between the benign and malignant groups and between groups with different prognostic biomarkers and molecular subtypes. The Kruskal–Wallis test was used…
Genes, proteins, chemicals, diseases, species, mutations and cell lines named across the full text — each resolved to its canonical identifier and authoritative record.
Click any figure to enlarge with its caption.
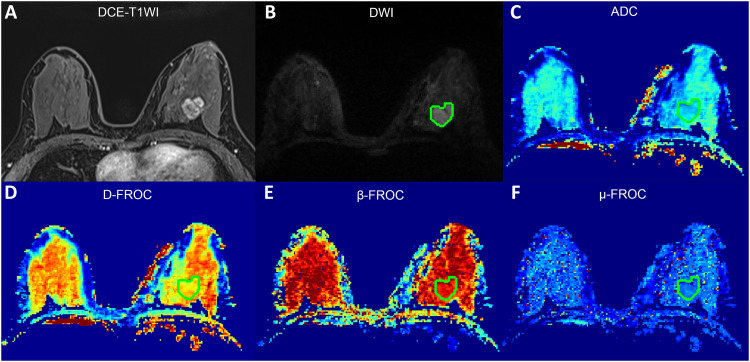 Figure 1
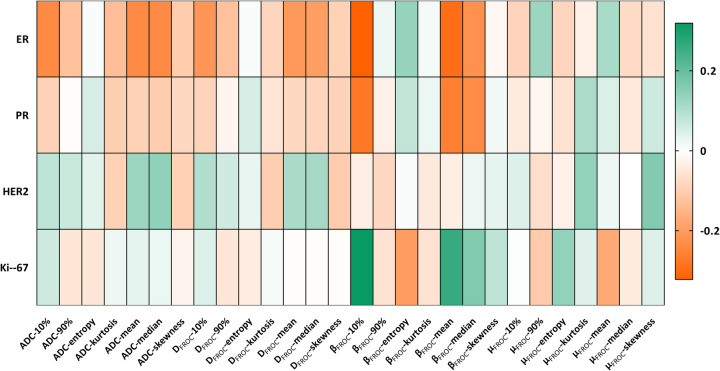 Figure 2
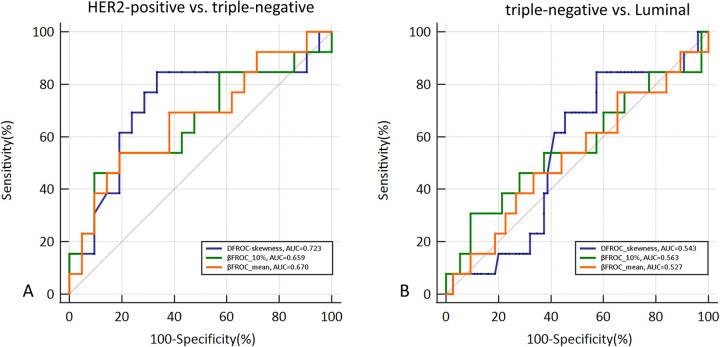 Figure 3
| Parameters | T2WI | SMS rs-EPI | DCE |
|---|---|---|---|
| TR (ms) | 3,700 | 2,350 | 5.24 |
| TE (ms) | 101 | 72 | 2.46 |
| Flip angle (°) | 137 | 180 | 10 |
| FOV (mm) | 320 × 320 | 280 × 182 | 320 × 320 |
| Slice thickness (mm) | 4.0 | 5.0 | 1.5 |
| Bandwidth (Hz/Px) | 347 | 887 | 780 |
| Acceleration of factor | – | 2 | – |
| Readout segments | – | 5 | – |
| Fat suppression | SPAIR | SPAIR | Dixon |
| – | 0, 50, 100, 200, 400, 800,1,200, 2,000 | – | |
| Averages | 1 | 1 for all | 1 |
| Time acquisition | 2:06 | 4:39 | 5:57 |
| Categories | Pathological types | Number (percentage) |
|---|---|---|
| Benign ( | Fibroadenomas | 39 (78.0) |
| Adenoses | 8 (16.0) | |
| Papillomas | 2 (4.0) | |
| Benign phyllodes tumor | 1 (2.0) | |
| Malignant ( | Invasive ductal carcinomas | 100 (91.7) |
| Mixed ductal carcinomas | 7 (6.4) | |
| Ductal carcinoma in situ | 1 (0.9) | |
| Encapsulated papillary carcinomas | 1 (0.9) | |
| ER | Positive | 66 (60.6) |
| Negative | 43 (39.4) | |
| PR | Positive | 69 (63.3) |
| Negative | 40 (36.7) | |
| HER2 | Positive | 32 (29.4) |
| Negative | 77 (70.6) | |
| Ki-67 | Positive | 88 (80.7) |
| Negative | 21 (19.3) | |
| Axillary lymph node | Positive | 38 (34.9) |
| Negative | 71 (65.19) | |
| Molecular subtype | Luminal subtype | 75 (68.8) |
| HER2-positive subtype | 13 (11.9) | |
| Triple-negative subtype | 21 (19.3) |
| Histogram parameters | Benign | Malignant |
| AUC | Sensitivity (%) | Specificity (%) | Cutoff point |
|---|---|---|---|---|---|---|---|
| ADC metrics | |||||||
| ADC-10% | 1,182.070 ± 336.607 | 656.414 ± 126.826 | <0.01 | 0.940 | 95.41 | 86.00 | 848.500 |
| ADC-90% | 1,668.982 ± 297.146 | 1,068.590 ± 171.082 | <0.01 | 0.959 | 96.33 | 92.00 | 1,361.000 |
| ADC-entropy | 4.165 ± 0.585 | 4.376 ± 0.491 | 0.019 | 0.616 | 67.89 | 58.00 | 4.200 |
| ADC-kurtosis | 3.560 ± 2.483 | 4.667 ± 2.433 | <0.01 | 0.702 | 81.65 | 52.00 | 2.880 |
| ADC-mean | 1,431.755 ± 272.719 | 843.832 ± 122.565 | <0.01 | 0.979 | 96.33 | 94.00 | 1,028.440 |
| ADC-median | 1,439.880 ± 285.282 | 816.936 ± 121.969 | <0.01 | 0.981 | 96.33 | 94.00 | 1,001.000 |
| ADC-skewness | 0.114 ± 0.818 | 0.880 ± 0.704 | <0.01 | 0.791 | 75.23 | 72.00 | 0.330 |
| DFROC metrics | |||||||
| DFROC-10% | 1,255.080 ± 333.550 | 712.878 ± 148.349 | <0.01 | 0.943 | 96.33 | 88.00 | 933.000 |
| DFROC-90% | 1,747.994 ± 282.887 | 1,181.537 ± 180.711 | <0.01 | 0.954 | 96.33 | 88.00 | 1,484.000 |
| DFROC-entropy | 4.189 ± 0.562 | 4.540 ± 0.489 | <0.01 | 0.685 | 70.64 | 64.00 | 4.250 |
| DFROC-kurtosis | 3.538 ± 2.341 | 4.330 ± 1.960 | <0.01 | 0.686 | 77.06 | 58.00 | 3.030 |
| DFROC-mean | 1,508.486 ± 256.272 | 927.381 ± 132.942 | <0.01 | 0.979 | 96.33 | 94.00 | 1,104.52 |
| DFROC-median | 1,516.810 ± 269.924 | 901.665 ± 133.399 | <0.01 | 0.979 | 97.25 | 92.00 | 1,098.000 |
| DFROC-skewness | 0.117 ± 0.794 | 0.785 ± 0.669 | <0.01 | 0.770 | 73.39 | 76.00 | 0.400 |
| βFROC metrics | |||||||
| βFROC-10% | 719.868 ± 176.372 | 657.139 ± 116.150 | <0.01 | 0.775 | 96.33 | 62.00 | 742.000 |
| βFROC-90% | 960.416 ± 37.259 | 895.620 ± 57.903 | <0.01 | 0.811 | 71.56 | 92.00 | 920.500 |
| βFROC-entropy | 3.275 ± 0.473 | 3.592 ± 0.433 | <0.01 | 0.697 | 50.46 | 90.00 | 3.650 |
| βFROC-kurtosis | 17.212 ± 24.568 | 14.520 ± 13.469 | 0.037 | 0.603 | 88.99 | 46.00 | 3.060 |
| βFROC-mean | 849.692 ± 54.255 | 772.093 ± 35.107 | <0.01 | 0.880 | 97.25 | 72.00 | 824.500 |
| βFROC-median | 868.740 ± 54.812 | 783.211 ± 38.641 | <0.01 | 0.908 | 84.40 | 86.00 | 812.500 |
| βFROC-skewness | −2.153 ± 2.345 | −1.929 ± 1.675 | 0.801 | 0.512 | 90.83% | 28% | −3.790 |
| μFROC metrics | |||||||
| μFROC-10% | 6,035.350 ± 1,591.250 | 5,435.192 ± 1,191.744 | <0.01 | 0.765 | 96.33 | 66.00 | 6,317.600 |
| μFROC-90% | 9,333.234 ± 1,662.342 | 8,187.907 ± 1,491.670 | <0.01 | 0.774 | 66.06 | 84.00 | 8,176.00 |
| μFROC-entropy | 5.525 ± 0.851 | 6.066 ± 0.533 | <0.01 | 0.723 | 88.99 | 54.00 | 5.470 |
| μFROC-kurtosis | 26.555 ± 22.290 | 57.157 ± 67.352 | <0.01 | 0.692 | 66.97 | 70.00 | 24.930 |
| μFROC-mean | 7,866.594 ± 782.448 | 6,996.922 ± 702.785 | <0.01 | 0.812 | 77.98 | 78.00 | 7,373.340 |
| μFROC-median | 7,329.720 ± 433.453 | 6,507.206 ± 353.028 | <0.01 | 0.939 | 88.99 | 90.00 | 6,879.000 |
| μFROC-skewness | 3.052 ± 3.051 | 5.236 ± 3.801 | <0.01 | 0.673 | 66.97 | 62.00 | 3.810 |
| Prognostic factors | 10% | 90% | Mean | Median | Entropy | Kurtosis | Skewness | |
|---|---|---|---|---|---|---|---|---|
| ER | ||||||||
| Negative | 43 (39.45) | 692.232 ± 115.856 | 1,094.291 ± 171.935 | 874.645 ± 114.089 | 4.360 ± 0.524 | 4.360 ± 0.524 | 4.706 ± 1.949 | 0.945 ± 0.666 |
| Positive | 66 (60.55) | 633.079 ± 129.038 | 1,051.846 ± 169.731 | 822.549 ± 124.347 | 4.385 ± 0.472 | 4.385 ± 0.472 | 4.640 ± 2.717 | 0.838 ± 0.730 |
|
| 0.130 | 0.194 |
|
| 0.913 | 0.171 | 0.486 | |
| PR | ||||||||
| Negative | 40 (36.70) | 672.273 ± 124.138 | 1,072.750 ± 180.534 | 855.694 ± 122.232 | 830.000 ± 116.290 | 4.340 ± 0.533 | 4.683 ± 1.975 | 0.944 ± 0.633 |
| Positive | 69 (63.30) | 647.222 ± 128.353 | 1,066.178 ± 166.665 | 835.802 ± 123.054 | 809.362 ± 125.350 | 4.396 ± 0.467 | 4.656 ± 2.677 | 0.844 ± 0.744 |
|
| 0.338 | 0.942 | 0.333 | 0.297 | 0.593 | 0.305 | 0.414 | |
| HER2 | ||||||||
| Negative | 77 (70.64) | 649.246 ± 121.498 | 1,056.961 ± 163.148 | 832.499 ± 113.321 | 804.266 ± 111.673 | 4.352 ± 0.515 | 4.838 ± 2.608 | 0.922 ± 0.753 |
| Positive | 32 (29.36) | 673.666 ± 139.327 | 1,096.572 ± 188.600 | 868.615 ± 141.072 | 847.422 ± 141.046 | 4.433 ± 0.429 | 4.252 ± 1.922 | 0.779 ± 0.568 |
|
| 0.383 | 0.466 | 0.183 | 0.138 | 0.700 | 0.331 | 0.328 | |
| Ki-67 | ||||||||
| Low expression | 21 (19.27) | 648.886 ± 136.257 | 1,090.067 ± 206.968 | 847.449 ± 160.716 | 821.571 ± 166.395 | 4.399 ± 0.463 | 4.343 ± 1.902 | 0.878 ± 0.689 |
| High expression | 88 (80.73) | 658.211 ± 125.229 | 1,063.465 ± 162.323 | 842.065 ± 112.715 | 815.830 ± 109.981 | 4.370 ± 0.499 | 4.743 ± 2.547 | 0.881 ± 0.711 |
|
| 0.526 | 0.601 | 0.741 | 0.797 | 0.607 | 0.812 | 0.812 | |
| Axillary lymph node | ||||||||
| Non-metastasis | 71 (65.14) | 674.254 ± 128.457 | 1,070.525 ± 187.255 | 852.618 ± 133.526 | 824.972 ± 133.634 | 4.297 ± 0.513 | 4.852 ± 2.522 | 0.983 ± 0.748 |
| Metastasis | 38 (34.86) | 623.084 ± 118. 236 | 1,064.974 ± 138.113 | 825.322 ± 98.076 | 801.921 ± 96.345 | 4.523 ± 0.413 | 4.318 ± 2.249 | 0.690 ± 0.576 |
|
| 0.074 | 0.821 | 0.285 | 0.421 |
| 0.255 | 0.062 | |
| Subtype | ||||||||
| HER2-positive | 21 (19.27) | 704.519 ± 111.962 | 1,084.771 ± 191.975 | 871.343 ± 123.412 | 835.310 ± 117.778 | 4.245 ± 0.591 | 5.019 ± 1.779 | 1.173 ± 0.571 |
| Luminal | 75 (68.81) | 642.305 ± 127.978 | 1,061.095 ± 165.499 | 832.614 ± 121.971 | 807.960 ± 124.195 | 4.402 ± 0.472 | 4.601 ± 2.619 | 0.814 ± 0.731 |
| Triple-negative | 13 (11.93) | 660.108 ± 132.520 | 1,085.692 ± 178.790 | 857.986 ± 125.503 | 839.039 ± 118.441 | 4.433 ± 0.421 | 4.473 ± 2.330 | 0.792 ± 0.659 |
|
| 0.143 | 0.880 | 0.347 | 0.415 | 0.676 | 0.097 | 0.070 | |
| Prognostic factors | 10% | 90% | Mean | Median | Entropy | Kurtosis | Skewness | |
|---|---|---|---|---|---|---|---|---|
| ER | ||||||||
| Negative | 43 (39.45) | 747.947 ± 128.957 | 1,204.351 ± 181.084 | 955.875 ± 122.054 | 926.802 ± 116.089 | 4.531 ± 0.513 | 4.306 ± 1.598 | 0.855 ± 0.631 |
| Positive | 66 (60.55) | 690.030 ± 156.451 | 1,166.673 ± 180.286 | 908.818 ± 137.301 | 885.288 ± 142.019 | 4.545 ± 0.477 | 4.346 ± 2.172 | 0.739 ± 0.693 |
|
|
| 0.193 |
|
| 0.931 | 0.385 | 0.330 | |
| PR | ||||||||
| Negative | 40 (36.70) | 728.695 ± 139.975 | 1,184.433 ± 192.486 | 937.634 ± 130.273 | 910.238 ± 123.777 | 4.506 ± 0.527 | 4.290 ± 1.662 | 0.872 ± 0.587 |
| Positive | 69 (63.30) | 703.709 ± 153.242 | 1,179.858 ± 174.954 | 921.437 ± 135.051 | 896.696 ± 139.313 | 4.559 ± 0.469 | 4.353 ± 2.122 | 0.734 ± 0.711 |
|
| 0.362 | 0.819 | 0.414 | 0.384 | 0.589 | 0.580 | 0.346 | |
| HER2 | ||||||||
| Negative | 77 (70.64) | 705.634 ± 140.335 | 1,172.082 ± 177.898 | 917.568 ± 124.668 | 889.779 ± 123.270 | 4.527 ± 0.519 | 4.460 ± 2.077 | 0.821 ± 0.709 |
| Positive | 32 (29.36) | 730.309 ± 167.168 | 1,204.288 ± 188.221 | 950.994 ± 150.514 | 930.266 ± 153.453 | 4.571 ± 0.415 | 4.018 ± 1.619 | 0.697 ± 0.560 |
|
| 0.295 | 0.523 | 0.250 | 0.228 | 0.765 | 0.293 | 0.278 | |
| Ki-67 | ||||||||
| Low expression | 21 (19.27) | 716.581 ± 153.665 | 1,208.105 ± 216.110 | 942.365 ± 175.389 | 918.810 ± 187.222 | 4.556 ± 0.457 | 4.129 ± 1.704 | 0.770 ± 0.684 |
| High expression | 88 (80.73) | 711.994 ± 147.943 | 1,175.197 ± 172.022 | 923.806 ± 121.659 | 897.574 ± 118.088 | 4.536 ± 0.499 | 4.378 ± 2.020 | 0.788 ± 0.669 |
|
| 0.645 | 0.604 | 0.945 | 0.936 | 0.690 | 0.902 | 0.957 | |
| Axillary lymph node | ||||||||
| Non-metastasis | 71 (65.14) | 734.458 ± 143.195 | 1,181.355 ± 196.012 | 937.101 ± 143.577 | 908.430 ± 145.117 | 4.458 ± 0.508 | 4.510 ± 2.044 | 0.898 ± 0.689 |
| Metastasis | 38 (34.86) | 672.558 ± 151.266 | 1,181.876 ± 150.445 | 909.220 ± 109.853 | 889.026 ± 108.857 | 4.693 ± 0.416 | 3.993 ± 1.762 | 0.572 ± 0.579 |
|
| 0.107 | 0.881 | 0.405 | 0.668 |
| 0.176 |
| |
| Subtype | ||||||||
| HER2-positive | 21 (19.27) | 762.586 ± 118.614 | 1,198.433 ± 213.653 | 952.067 ± 135.027 | 912.214 ± 126.094 | 4.415 ± 0.577 | 4.568 ± 1.473 | 1.099 ± 0.521 |
| Luminal | 75 (68.81) | 699.208 ± 152.596 | 1,173.916 ± 174.456 | 917.747 ± 133.491 | 894.680 ± 137.621 | 4.561 ± 0.473 | 4.315 ± 2.091 | 0.717 ± 0.696 |
| Triple-negative | 13 (11.93) | 711.446 ± 159.778 | 1,198.208 ± 170.246 | 943.084 ± 129.894 | 924.923 ± 125.611 | 4.618 ± 0.429 | 4.032 ± 1.929 | 0.669 ± 0.607 |
|
| 0.234 | 0.768 | 0.410 | 0.509 | 0.547 | 0.159 |
| |
| Prognostic factors | 10% | 90% | Mean | Median | Entropy | Kurtosis | Skewness | |
|---|---|---|---|---|---|---|---|---|
| ER | ||||||||
| Negative | 43 (39.45) | 679.472 ± 96.225 | 892.574 ± 54.868 | 779.515 ± 39.228 | 788.058 ± 41.756 | 3.519 ± 0.422 | 15.078 ± 13.898 | −1.871 ± 1.796 |
| Positive | 66 (60.55) | 642.588 ± 126.047 | 897.605 ± 60.128 | 767.258 ± 31.517 | 780.053 ± 36.451 | 3.639 ± 0.436 | 14.155 ± 13.277 | −1.968 ± 1.605 |
|
|
| 0.814 |
|
| 0.159 | 0.892 | 0.862 | |
| PR | ||||||||
| Negative | 40 (36.70) | 676.808 ± 99.630 | 895.298 ± 54.699 | 779.004 ± 41.206 | 788.713 ± 43.184 | 3.541 ± 0.434 | 15.273 ± 14.254 | −1.926 ± 1.818 |
| Positive | 69 (63.30) | 645.736 ± 123.993 | 895.807 ± 60.075 | 768.087 ± 30.649 | 780.022 ± 35.691 | 3.620 ± 0.433 | 14.082 ± 13.079 | −1.931 ± 1.600 |
|
|
| 0.751 |
|
| 0.414 | 0.792 | 0.870 | |
| HER2 | ||||||||
| Negative | 77 (70.64) | 664.861 ± 96.157 | 898.878 ± 59.243 | 774.052 ± 31.907 | 783.942 ± 37.852 | 3.588 ± 0.432 | 15.068 ± 14.315 | −1.985 ± 1.681 |
| Positive | 32 (29.36) | 638.556 ± 154.364 | 887.781 ± 54.648 | 767.380 ± 42.019 | 781.453 ± 41.047 | 3.601 ± 0.441 | 13.197 ± 11.273 | −1.795 ± 1.680 |
| p | 0.709 | 0.709 | 0.714 | 0.803 | 0.931 | 0.637 | 0.754 | |
| Ki-67 | ||||||||
| Low expression | 21 (19.27) | 635.762 ± 61.153 | 902.495 ± 62.770 | 760.157 ± 22.914 | 773.429 ± 23.300 | 3.773 ± 0.382 | 15.082 ± 12.453 | −2.250 ± 1.402 |
| High expression | 88 (80.73) | 662.240 ± 125.503 | 893.980 ± 56.940 | 774.943 ± 36.969 | 785.546 ± 41.234 | 3.548 ± 0.435 | 14.385 ± 13.764 | −1.853 ± 1.733 |
|
|
| 0.539 |
| 0.088 |
| 0.544 | 0.381 | |
| Axillary lymph node | ||||||||
| Non-metastasis | 71 (65.14) | 669.996 ± 81.360 | 893.765 ± 59.492 | 774.636 ± 32.305 | 784.859 ± 34.308 | 3.549 ± 0.425 | 14.136 ± 12.543 | −1.900 ± 1.689 |
| Metastasis | 38 (34.86) | 633.116 ± 161.077 | 899.087 ± 55.423 | 767.342 ± 39.845 | 780.132 ± 46.006 | 3.670 ± 0.443 | 15.235 ± 15.201 | −1.985 ± 1.672 |
|
| 0.133 | 0.472 | 0.484 | 0.593 | 0.133 | 0.746 | 0.849 | |
| Subtype | ||||||||
| HER2-positive | 21 (19.27) | 701.643 ± 54.864 | 890.071 ± 48.497 | 784.957 ± 38.297 | 789.833 ± 42.171 | 3.508 ± 0.359 | 18.937 ± 15.471 | −2.278 ± 1.829 |
| Luminal | 75 (68.81) | 647.845 ± 120.125 | 897.868 ± 59.006 | 769.526 ± 30.806 | 781.427 ± 35.192 | 3.632 ± 0.435 | 13.766 ± 12.768 | −1.909 ± 1.585 |
| Triple-negative | 13 (11.93) | 638.862 ± 151.820 | 883.536 ± 67.781 | 766.124 ± 49.259 | 782.808 ± 52.350 | 3.489 ± 0.520 | 11.724 ± 13.505 | −1.485 ± 1.942 |
|
|
| 0.690 |
| 0.127 | 0.368 | 0.199 | 0.338 | |
| Prognostic factors | 10% | 90% | Mean | Median | Entropy | Kurtosis | Skewness | |
|---|---|---|---|---|---|---|---|---|
| ER | ||||||||
| Negative | 43 (39.45) | 5,549.998 ± 1,083.598 | 8,033.509 ± 1,428.431 | 6,943.614 ± 686.883 | 6,538.012 ± 324.404 | 6.115 ± 0.451 | 62.524 ± 67.644 | 5.568 ± 3.862 |
| Positive | 66 (60.55) | 5,360.394 ± 1,259.643 | 8,288.500 ± 1,533.815 | 7,031.652 ± 716.017 | 6,487.136 ± 371.535 | 6.035 ± 0.582 | 53.660 ± 67.448 | 5.019 ± 3.775 |
|
| 0.359 | 0.183 | 0.244 | 0.438 | 0.382 | 0.757 | 0.535 | |
| PR | ||||||||
| Negative | 40 (36.70) | 5,496.735 ± 1,130.546 | 1,072.750 ± 180.534 | 855.694 ± 122.232 | 6,629.700 ± 339.738 | 6.098 ± 0.453 | 4.683 ± 1.975 | 0.944 ± 0.633 |
| Positive | 69 (63.30) | 647.222 ± 128.353 | 1,066.178 ± 166.665 | 835.802 ± 123.054 | 6,494.167 ± 362.316 | 6.048 ± 0.577 | 4.656 ± 2.677 | 0.843 ± 0.744 |
|
| 0.660 | 0.845 | 0.615 | 0.635 | 0.542 | 0.263 | 0.501 | |
| HER2 | ||||||||
| Negative | 77 (70.64) | 5,417.703 ± 1,143.764 | 8,239.366 ± 1,554.594 | 7,004.596 ± 733.138 | 6,510.955 ± 350.751 | 6.072 ± 0.554 | 54.346 ± 71.264 | 4.889 ± 3.890 |
| Positive | 32 (29.36) | 5,477.275 ± 1,318.408 | 8,064.109 ± 1,343.330 | 6,978.454 ± 634.421 | 6,498.1875 ± 363.947 | 6.054 ± 0.486 | 63.918 ± 57.330 | 6.069 ± 3.480 |
|
| 0.644 | 0.497 | 0.821 | 0.997 | 0.765 | 0.147 | 0.096 | |
| Ki-67 | ||||||||
| Low expression | 21 (19.27) | 5,519.600 ± 869.690 | 8,432.948 ± 1,456.971 | 7,157.264 ± 530.628 | 6,542.429 ± 322.524 | 5.909 ± 0.596 | 41.091 ± 31.222 | 4.699 ± 2.722 |
| High expression | 88 (80.73) | 5,415.049 ± 1,259.788 | 8,129.432 ± 1,502.073 | 6,958.658 ± 735.331 | 6,498.801 ± 361.147 | 6.104 ± 0.514 | 60.990 ± 73.007 | 5.364 ± 4.019 |
|
| 0.975 | 0.272 | 0.072 | 0.664 | 0.142 | 0.684 | 0.656 | |
| Axillary lymph node | ||||||||
| Non-metastasis | 71 (65.14) | 5,501.828 ± 990.275 | 8,122.024 ± 1,341.590 | 7,001.556 ± 684.535 | 6,615.782 ± 323.240 | 5.993 ± 0.566 | 53.388 ± 58.118 | 4.962 ± 3.822 |
| Metastasis | 38 (34.86) | 5,310.687 ± 1,505.286 | 8,311.005 ± 1,750.939 | 6,988.263 ± 745.010 | 6,491.184 ± 407.067 | 6.203 ± 0.440 | 64.197 ± 82.297 | 5.748 ± 3.760 |
|
| 0.670 | 0.480 | 0.643 | 0.770 |
| 0.347 | 0.387 | |
| Subtype | ||||||||
| HER2-positive | 21 (19.27) | 5,581.229 ± 1,158.545 | 8,103.095 ± 1,368.475 | 6,987.416 ± 787.937 | 6,541.167 ± 358.494 | 6.132 ± 0.417 | 59.969 ± 73.611 | 5.261 ± 3.995 |
| Luminal | 75 (68.81) | 5,394.547 ± 1,202.006 | 8,202.879 ± 1,464.157 | 7,006.409 ± 679.006 | 6,490.820 ± 358.376 | 6.070 ± 0.572 | 57.399 ± 67.695 | 5.318 ± 3.777 |
| Triple-negative | 13 (11.93) | 5,433.777 ± 1,260.108 | 8,238.538 ± 1,915.182 | 6,957.543 ± 751.588 | 6,546.885 ± 331.743 | 5.939 ± 0.475 | 51.217 ± 59.026 | 4.723 ± 3.893 |
|
| 0.647 | 0.668 | 0.750 | 0.662 | 0.478 | 0.583 | 0.774 | |
Peer Reviews
No public reviews on file for this paper yet. If you reviewed it on a platform where reviews are public (OpenReview, ICLR, NeurIPS, ICML), you can paste yours below so the community can read it here.
Videos
No videos yet. Explain this paper in a talk, walkthrough, or lecture? Add one.
Taxonomy
TopicsMRI in cancer diagnosis · Advanced Neuroimaging Techniques and Applications · Mathematical Biology Tumor Growth
Introduction
Breast cancer is the most commonly diagnosed malignancy and a leading cause of cancer-related mortality worldwide (1). Magnetic resonance imaging (MRI) plays an essential role in the detection, characterization, therapy response monitoring, and outcome prediction of breast cancer. However, dynamic contrast-enhanced MRI (DCE-MRI) continues to exhibit a high false-positive rate and low specificity (37%–97%) in identifying breast lesions due to background parenchymal enhancement and overlap of the time-intensity curves between the benign and malignant lesions (2). Previous studies have shown that diffusion-weighted imaging (DWI), as a non-invasive tool, can be an important adjunct imaging sequence to DCE-MRI, improving the diagnostic specificity compared with DCE-MRI alone (3, 4). DWI provides microstructure-sensitive contrast without contrast media with the measurements of the apparent diffusion coefficient (ADC), which can be used in differentiating breast lesions and predicting and monitoring treatment outcomes (5–7).
Breast cancer is a heterogeneous disease comprising multiple biological subtypes with different treatment responses and clinical outcomes (8–11). Therefore, preoperative phenotyping of breast cancer is necessary for optimizing patient-tailored therapy and predicting treatment response. Previous studies have explored the relationship between ADC values and prognostic factors of breast cancer (4, 6, 7, 12). Jeh et al. (13) reported that low ADC-mean values were related to the positive expression of estrogen receptor (ER) and negative expression of human epidermal growth factor receptor 2 (HER2). On the contrary, Kim et al. (5) reported no significant relationship between ADC values and breast cancer prognosis. This disagreement could be explained from the aspect of the basic principles of the different DWI models. The conventional DWI with a mono-exponential model assumes that water motion is homogeneous and follows Gaussian behavior (14, 15). As a matter of fact, the diffusion behavior of water molecules in vivo tissue is much more complicated (non-Gaussian distribution) due to the complex tissue microenvironment of tumors, which is not well characterized by the conventional DWI model (16, 17).
In this context, different non-Gaussian diffusion models with new imaging biomarkers, such as intravoxel incoherent motion (IVIM), diffusional kurtosis imaging (DKI), and fractional order calculus (FROC) model, have been proposed to presumably reflect the microstructural heterogeneity and irregularity of tumor cells in vivo and the amount of interfaces within cellular tissues (18–22). Different from the IVIM and DKI models, the FROC model is a three-parameter formulation designed to capture complex, scale-dependent diffusion processes: diffusion coefficient D_FROC_ (in square millimeters/second), intravoxel diffusion spatial heterogeneity β_FROC_, and a spatial constant parameter μ_FROC_ (in micrometers) (23). Its parameters potentially reflect tissue organization and heterogeneity beyond ADC. Recently, the FROC model has been proven valuable in differentiating brain tumors, gastrointestinal stromal tumors, bladder urothelial carcinoma, and salivary gland tumors and evaluating therapy responses (23–26). However, the application of the FROC model was not well investigated in breast DWI, particularly for the correlation between the FROC-derived parameters and prognostic biomarkers of breast cancer (27).
The study aims to assess the differential diagnostic performance of FROC-derived histogram features for breast lesions and further evaluate the potential associations between FROC-derived histogram metrics and established prognostic factors [ER, progesterone receptor (PR), HER2, Ki-67] and molecular subtypes, as compared with the conventional mono-exponential DWI model.
Materials and methods
Patients
The institutional review board approval was obtained for this retrospective study, and the requirement for informed consent was waived. This study cohort comprised 147 patients who underwent breast MRI for evaluation of suspicious breast lesions between December 2020 and October 2021. The inclusion criteria were as follows: (1) 18 years or older; (2) mass-type lesions with the largest diameter ≥ 1 cm; (3) no history of surgery, chemotherapy, or radiation therapy; and (4) complete clinical data and histopathologic results within 2 weeks after the breast MRI. The exclusion criteria were as follows: (1) non-mass enhancement lesions; (2) lesions with extensive cystic necrosis, making it unable to draw a region of interest (ROI); and (3) poor DWI image quality precluding reliable ROI placement.
MR imaging protocol
All breast MRI examinations were performed on a 3.0 T scanner (MAGNETOM Skyra, Siemens Healthcare, Erlangen, Germany) with a dedicated 16-channel phased-array bilateral breast coil. The imaging protocol mainly included the following sequences: (1) an axial fast spin-echo T2-weighted imaging (T2WI) sequence with Dixon fat suppression; (2) an axial DWI with simultaneous multi-slice readout-segmented echo-planar imaging (SMS rs-EPI DWI). For the sake of completeness, the diffusion gradient pulse width (δ = 19.3 ms) and gradient separation (Δ = 40.0 ms) were used in the sequence; and (3) an axial T1-weighted DCE-MRI with time-resolved angiography with stochastic trajectories volume-interpolated breath-hold examination sequence (TWIST-VIBE) technique. The protocol details are shown in Table 1.
Imaging analysis
The original image data of SMS rs-EPI DWI were post-processed using a non-commercial software (Body Diffusion Laboratory) based on a computing language and interactive environment (BoDiLab, Siemens Healthcare, Erlangen, Germany) (2, 20, 28, 29). Two radiologists with 17 and 5 years of experience in breast MRI interpretation who were blinded to the pathology of each subject independently measured the quantitative ADC and FROC-derived parameters.
The brief post-processing procedures were described as follows: Firstly, a two-dimensional ROI (2D-ROI) was manually drawn on DWI images (b-value = 800 s/mm^2^) by selecting the largest cross-sectional slice of each lesion. The cystic components, hemorrhages, calcifications, and vascular structures were avoided. Secondly, a three-dimensional ROI (3D-ROI) of the whole lesion was automatically segmented using the fuzzy C-means (FCM) algorithm built in the software. Thirdly, the voxel-based parametric maps were automatically generated by setting different ranges of b-values (0–800 s/mm^2^ for the mono-ADC model; 0–2,000 s/mm^2^ for the FROC model). Lastly, the 3D-ROI was automatically copied onto the parametric maps, and the histogram results of each quantitative parameter were computed and saved for further analysis, including the 10th and 90th percentiles, mean, median, entropy, kurtosis, and skewness. In addition, the signal-to-noise ratio (SNR) was measured on DWI images with b = 2,000 s/mm^2^ from randomly selected 30 patients (10 and 20 with benign and malignant lesions, respectively) for the image quality assessment.
According to the FROC model, the voxel intensity within a diffusion-weighted image is given by equation (20):
where S0 is the signal intensity without diffusion-weighting; Gd is the diffusion gradient amplitude; δ is the diffusion gradient pulse width; Δ is the gradient lobe separation (20, 21). D, β, and μ were defined as previously mentioned.
Histopathologic results
The histopathologic results were retrieved from the electronic medical records of hospital information systems (HIS). The following biomarkers were recorded for each tumor: ER, PR, HER2, Ki-67 labeling index, and axillary lymph node (ALN) status. ER and/or PR expression was considered positive when nuclear immunostaining was ≥1%. HER2 status was scored by immunohistochemistry (IHC) on a 0–3+ scale; tumors with IHC 3+ or 2+ accompanied by gene amplification on fluorescence in situ hybridization (FISH) were classified as HER2-positive. High proliferation activity was defined as Ki-67 > 14%.
Breast cancer was subcategorized into four subtypes based on the expression of molecular markers: Luminal A (ER- and/or PR-positive, HER2-negative, Ki-67 < 14%), Luminal B (ER- and/or PR-positive with either HER2 overexpression/amplification or Ki-67 > 14%), triple-negative (ER- and PR-negative, HER2-negative), and HER2-positive type (ER- and PR-negative, HER2-positive) (30, 31). The Luminal A and Luminal B groups were combined into one group (luminal group) for further analysis.
Statistical analysis
All statistical analyses were performed using IBM SPSS Statistics (version 26.0; IBM Corp., Armonk, NY, USA) and MedCalc statistical software (version 12.0; MedCalc Software Ltd., Ostend, Belgium). Continuous variables were presented as means ± standard deviations (SD), and categorical variables were presented as counts and percentages. The normality of quantitative measurements was evaluated by the Shapiro–Wilk test. An intra-class correlation coefficient (ICC; two-way random-effects model) was applied to assess the inter-reader agreement of the quantitative measurements between two readers. ICCs were interpreted as follows: ≤0.40, poor; 0.40–0.59, fair; 0.60–0.74, good; 0.75–1.00, excellent (32). The Mann–Whitney U test was used to compare the histogram results of each diffusion parameter between the benign and malignant groups and the groups with different prognostic factor statuses. The Kruskal–Wallis non-parametric test was used to compare the histogram results of each DWI-derived parameter among the different molecular subtypes. Bonferroni correction was applied to adjust p-values for the multiple pairwise comparisons. The Spearman rank correlation analysis was employed to characterize the correlations between diffusion metrics and prognostic factors. The strength of correlation ranged from 0.75 to 1.00 for good, 0.50–0.74 for moderate, 0.25–0.49 for mild, and 0.00–0.24 for poor correlation. Receiver operating characteristic (ROC) analysis with area under the curve (AUC) was applied to assess the diagnostic performance of ADC- and FROC-derived parameters in distinguishing different breast lesions and different molecular subtypes. DeLong's test was used to compare AUCs between parameters. A p-value of <0.05 was considered statistically significant.
Results
Clinical and histopathologic characteristics
This study included 147 patients (mean age, 48.0 ± 13.6 years; range, 22–68 years) presenting with 159 lesions (50 benign and 109 malignant). Of these patients, 12 have bilateral benign lesions. The lesion size measured on DCE-MRI was 21.4 ± 6.2 mm (14.7–34.3 mm) and 22.1 ± 5.3 mm (14.5–29.0 mm) for the benign and malignant breast lesions, respectively. For the image quality of DWI, the mean SNRs of DWI images with b = 2,000 were 22.53 ± 2.90, 56.53 ± 6.56, and 119.56 ± 14.10 for FGT, benign, and malignant lesions, respectively.
Among the benign lesions (n = 50), 39 were fibroadenomas (78.0%), 8 adenoses (16.0%), 2 intraductal papillomas (4.0%), and 1 benign phyllodes tumor (2.0%). Among the malignant lesions (n = 109), 100 were invasive ductal carcinomas (IDC; 91.7%), 7 mixed ductal carcinomas in situ (DCIS) and invasive ductal carcinomas (DCIS/IDC; 6.4%), 1 pure DCIS (0.9%), and 1 encapsulated papillary carcinoma (0.9%).
For cancers (n = 109), biomarker profiles were as follows: ER-positive in 66 (60.6%), PR-positive in 69 (63.3%), HER2-positive in 32 (29.4%), and high Ki-67 index in 88 (80.7%). Axillary lymph node metastasis was present in 38 (34.9%). Given the limited number of Luminal B tumors, Luminal A and B tumors were combined into a single luminal category for subtype analyses. Subtype distribution was luminal in 75 (68.8%), HER2-positive in 13 (11.9%), and triple-negative in 21 (19.3%). The details are shown in Table 2.
Diagnostic performance of mono-exponential ADC and FROC-derived parameters
The ICCs for interobserver variability were 0.917 (95% CI, 0.885–0.940), 0.928 (95% CI, 0.900–0.948), 0.833 (95% CI, 0.773–0.878), and 0.827 (95% CI, 0.766–0.874) for ADC, D_FROC_, β_FROC_, and μ_FROC_, respectively, indicating excellent inter-rater agreement. The histogram analysis demonstrated that the differences in ADC, D_FROC_, β_FROC,_ and μ_FROC_ values were statistically different between benign and malignant breast lesions (all p < 0.05; Table 3), except for β_FROC_-skewness. The 10% and 90% percentiles, mean, and median values of ADC, D_FROC_, β_FROC_, and μ_FROC_ were significantly higher in benign than those in malignant lesions. Conversely, skewness values of ADC, D_FROC_, β_FROC_, and μ_FROC_ were significantly lower in benign than those in malignant lesions. The entropy and kurtosis values of ADC, D_FROC_, and μ_FROC_ were significantly lower in benign than in malignant lesions. Group-wise distributions for key metrics are illustrated by violin plots (Supplementary Figure S1). The examples of malignant and benign lesions in DCE-MRI, DWI, and diffusion-derived parameter maps are shown in Figure 1 and Supplementary Figure S2.
Examples of images for a 27-year-old woman with infiltrating ductal carcinoma in the left breast. Contrast-enhanced T1-weighted image (A), mono-exponential DWI (b = 800 s/mm2) image (B), ADC image (C), DFROC image (D), βFROC image (E), and μFROC image (F). The ADC-mean, DFROC-mean, βFROC-mean, and μFROC values were 0.994 × 10⁻³ mm2/s, 1.088 × 10⁻³ mm2/s, 0.787, and 7.075, respectively.
The ROC analysis showed that ADC-median had the highest discriminative performance (AUC = 0.981; 95% CI, 0.946–0.996). Within the FROC model, the D_FROC_-median and D_FROC_-mean yielded similar AUC values (0.979; 95% CI, 0.943–0.995, and 0.979; 95% CI, 0.942–0.995, respectively). The AUC of ADC-median was not significantly different from those with D_FROC_-mean and D_FROC_-median (Delong p = 0.477 and 0.343). In multivariable models that combined all histogram metrics reaching statistical significance within each framework, overall discrimination was excellent for both ADC and FROC (AUCs 0.981 and 0.992, respectively), with no statistically significant difference between the two (DeLong test, p = 0.182).
Correlation analysis of mono-exponential ADC and FROC-derived parameters and prognostic factors and molecular subtypes
ER-negative tumors exhibited significantly higher ADC-mean values and lower ADC-median values than the ER-positive tumors (both p < 0.05; Table 4). The patients with ALN metastasis had higher ADC-entropy than node-negative patients (p = 0.019). No significant differences in the histogram metrics were observed across PR status, HER2 status, and Ki-67 categories, and no subtype-level differences were detected (all p > 0.05).
ER-negative tumors showed significantly higher D_FROC_-10%, D_FROC_-mean, and D_FROC_-median values than those in ER-positive tumors (p = 0.027, 0.031, 0.041, respectively; Table 5). Patients with ALN metastasis had significantly higher D_FROC_-entropy values and lower D_FROC_-skewness values than those of patients without ALN metastasis (p = 0.014 and 0.021). No significant differences were found by PR, HER2, and Ki-67 groups. Across molecular subtypes, D_FROC_-skewness differed overall (Kruskal–Wallis p = 0.032); in pairwise comparisons, D_FROC_-skewness differed significantly between the luminal and the triple-negative subtypes (p = 0.044) (Supplementary Figure S3). The HER2-positive subtype tended to show higher D_FROC_-skewness values than both luminal and triple-negative subtypes.
ER-negative and PR-negative tumors demonstrated significantly higher β_FROC_-10%, β_FROC_-mean, and β_FROC_-median than those in ER-positive tumors (all p < 0.05; Table 6). High Ki-67 tumors showed significantly higher β_FROC_-10% and β_FROC_-mean and lower β_FROC_-entropy values than those in low Ki-67 tumors (p = 0.001, 0.007, and 0.038). β_FROC_-10% and β_FROC_-mean differed across molecular subtypes (p = 0.002 and 0.016); pairwise comparisons showed both β_FROC_-10% and β_FROC_-mean were significantly higher in triple-negative than those in luminal tumors (p = 0.001 and 0.012). β_FROC_-10% and β_FROC_-mean also tended to be higher in HER2-positive than those in the other groups.
Among the histogram μ_FROC_ values, only μ_FROC_-entropy differed by Ki-67 status (p = 0.047; Table 7). No significant differences were observed among molecular subtypes (all p > 0.05).
Spearman correlation analysis
Correlation analyses showed predominantly weak-to-moderate negative associations between receptor expression and diffusion metrics (Figure 2). ER expression correlated negatively with ADC-10% (r = −0.238, p = 0.013), ADC-mean (r = −0.237, p = 0.013), and ADC-median (r = −0.237, p = −0.123). ER was also negatively correlated with D_FROC_-10% (r = −0.213, p = 0.026), D_FROC_-mean (r = −0.208, p = 0.030), D_FROC_-median (r = −0.197, p = 0.040), β_FROC_-10% (r = −0.322, p = 0.001), β_FROC_-mean (r = −0.295, p = 0.002), and β_FROC_-median (r = −0.224, p = 0.019).
Spearman correlations between DWI parameters and prognostic factors are charted in a heat map. Colored entries indicate Spearman correlation with positive (orange) or negative (green).
PR expression correlated negatively with β_FROC_-10% (r = −0.273, p = 0.004), β_FROC_-mean (r = −0.258, p = 0.007), and β_FROC_-median (r = −0.236, p = 0.014). Ki-67 was negatively correlated with β_FROC_-entropy (r = −0.200, p = 0.037) and β_FROC_-mean (r = 0.261, p = 0.006) and positively correlated with β_FROC_-10% (r = 0.319, p = 0.001). No μ_FROC_ metric correlated significantly with prognostic factors, and no diffusion metric showed a significant correlation with HER2 status.
Diagnostic performance for molecular subtype discrimination
Figure 3 shows the ROC curves for D_FROC_-skewness, β_FROC_-10%, and β_FROC_-mean in two pairwise classification tasks: HER2-positive vs. triple-negative and triple-negative vs. luminal. The AUC, sensitivity, and specificity were 0.723, 84.62%, and 66.67% for D_FROC_-skewness; 0.659, 46.15%, and 90.48% for β_FROC_-10%; and 0.670, 53.85%, and 80.95% for β_FROC_-mean in distinguishing HER2-positive and triple-negative. The AUC, sensitivity, and specificity were 0.543, 84.62%, and 42.67% for D_FROC_-skewness; 0.563, 30.77%, and 90.67% for β_FROC_-10%; 0.586, 30.77%, and 95.24% for β_FROC_-mean in distinguishing triple-negative and luminal.
ROC curves of DFROC-skewness, βFROC-10% and βFROC-mean in distinguishing HER2-positive and triple-negative (A), triple-negative and Luminal (B).
Discussion
In this study, whole-lesion histogram analysis of quantitative DWI with mono-exponential and FROC models was performed to differentiate breast lesions and to explore associations between diffusion metrics and prognostic biomarkers in breast cancer. The results demonstrated that the diagnostic performance of D_FROC_ was comparable to that of ADC for benign–malignant discrimination. However, the histogram features derived from FROC models showed broader and stronger associations with prognostic biomarkers and molecular subtypes than did ADC metrics, features of breast cancer compared with the mono-ADC values, suggesting that non-Gaussian parameters capture complementary aspects of tumor microstructure and heterogeneity beyond conventional diffusion (21). These findings may help guide therapy decisions and predict breast cancer prognosis.
The FROC model is a non-Gaussian model proposed for better characterization of the complexity of biological tissue with three diffusion parameters (D_FROC_, β_FROC_, μ_FROC_). It is important to note that when data are acquired by varying the diffusion gradient strength at a fixed diffusion time, the signal decay fitted by the FROC model reflects a pseudo-superdiffusion mechanism. This contrast arises from the interplay between water diffusion multi-compartmentalization and local magnetic field inhomogeneities generated by magnetic susceptibility differences (Δχ) at the interfaces between different tissue compartments (33, 34). D_FROC_ was higher in benign than that in malignant breast lesions, which was aligned with a previous study (27). In our study, D_FROC_ had similar diagnostic performance compared with mono-ADC values. Beyond averaged estimates, the distributional shape of voxel-wise metrics carried clinically relevant information. In our cohort, 10th/90th percentiles, mean, and median of ADC and FROC parameters were consistently higher in benign than those in malignant lesions, whereas skewness (all models) and entropy/kurtosis (ADC, D_FROC_, μ_FROC_) were lower in benign. This pattern suggests that benign lesions tend to have more homogeneous diffusivity, with fewer extreme voxels. In contrast, malignant lesions exhibit heavier tails and greater disorder, consistent with intermixed regions of high cellularity, stromal remodeling, edema, and necrosis.
Recent clinical applications of SMS rs-EPI with advanced non-Gaussian modeling, including FROC, further support its diagnostic feasibility in the breast (35). Our study was based on the SMS rs-EPI, which produced superior image quality and lesion characterization than ss-EPI (28). Differences between our results and earlier ss-EPI–based FROC studies likely reflect these acquisition advantages and cohort size/mixture effects, both of which influence histogram-based AUCs. Moreover, the pathological composition was relatively simple in our study. The malignant lesions were mostly invasive ductal carcinomas (n = 100, 62.89%), and the benign lesions were fibroadenomas (n = 39, 24.53%).
In addition, both β_FROC_ and μ_FROC_ are spatial parameters that reflect the underlying tissue structural complexity. β_FROC_ represents the fractional order derivative in space, and μ_FROC_ is considered a measure of diffusion mean free length. In the context of pseudo-superdiffusion, the β_FROC_ parameter has been shown to be particularly sensitive to local magnetic susceptibility differences (Δχ) (33, 34). Several studies reported that β_FROC_ values and μ_FROC_ values were inversely associated with intravoxel tissue heterogeneity (20, 21, 23). In our cohort, the mean values of β_FROC_ and μ_FROC_ were higher in benign lesions than those in malignant lesions, indicating that malignant tumors harbor broader voxel-wise heterogeneity and heavier-tailed distributions, consistent with admixtures of densely cellular regions, edema/necrosis, and stromal remodeling.
A critical consideration when applying the FROC model in the breast is the potential confounding effect of magnetic susceptibility. Breast tissue is characterized by a significant Δχ at the interfaces between adipose tissue and water-rich glandular or tumor tissue. The internal magnetic fields (G_int) generated by this Δχ can couple with the applied diffusion gradients, contributing to the signal decay in a way that mimics a superdiffusion process, thereby influencing the estimated β_FROC_. Therefore, while our results show strong correlations between β_FROC_ and prognostic factors, the biological interpretation is complex. The observed associations might not solely reflect tissue microstructure (heterogeneity) but could also be modulated by susceptibility-related effects linked to angiogenesis, inflammatory infiltration, or other pathological features that alter the local magnetic landscape (33).
We observed consistent (generally mild-to-moderate) negative correlations between receptor expression and non-Gaussian metrics, with β_FROC_ features showing the broadest associations across ER, PR, and Ki-67. The biological directionality is nuanced. ER-/PR-negative cancers typically show higher microvessel density and more aggressive phenotypes than hormone receptor–positive tumors, which may alter extracellular water mobility and the balance between restricted and hindered components (36, 37). The ER- and PR–PR-negative groups showed significantly higher β_FROC_-mean values, indicating the low heterogeneity in the group. Meanwhile, Ki-67 reflects proliferative activity and tumor aggressiveness; meta-analyses and multicenter data indicate that ADC-Ki-67 correlations are weak or inconsistent, underscoring the value of models sensitive to heterogeneity beyond mean diffusivity (38, 39). The low expression Ki-67 group showed higher ADC- and D_FROC_-mean values, demonstrating the low cell density in the low expression group. Moreover, the β_FROC_-mean was higher in the high Ki-67 expression group, which was inconsistent with the high heterogeneity in the group. In this context, the stronger and more pervasive associations of β_FROC_ with ER/PR/Ki-67 suggest that anomalous diffusion metrics may better index voxel-scale disorder and microarchitectural dispersion than ADC alone.
HER2 expression induced angiogenesis and aggressiveness (36). The HER2 overexpression group had higher ADC- and D_FROC_-mean values, which could be explained by higher blood flow in the tumor tissue (40). In the correlation analysis, the ADC and D_FROC_ histogram metrics showed a significant negative correlation with ER expression. The β_FROC_ histogram metrics were significantly correlated with ER, PR, and Ki-67 status. However, we did not detect robust correlations between diffusion metrics and HER2 status in this cohort, indicating that perfusion/vascular effects may be less directly captured by diffusion-weighted metrics than by DCE-MRI or perfusion imaging.
Regarding molecular subtypes, the luminal subtype was typically associated with a more favorable prognosis compared with the triple-negative and HER2-positive subtypes. The triple-negative tumors lacking expression of ER, PR, and HER2 were characterized by more invasive characteristics, a high recurrence rate, and poor prognosis (41). The luminal subtypes have relatively higher cellularity and vascular density compared with the triple-negative subtype. In our study, D_FROC_-skewness showed the highest AUC value in distinguishing between HER2-positive and triple-negative tumors, and β_FROC_-mean produced the highest AUC value in distinguishing between triple-negative and luminal tumors. Although the resulting AUCs were modest (approximately 0.527–0.723) and therefore insufficient for standalone subtype classification, these orthogonal signals—with percentiles indexing the burden of abnormal voxels and shape metrics capturing distributional asymmetry/disorder—are suited for multivariable integration (e.g., radiomic features) and decision curve–oriented model building, where complementary contributions may yield clinically meaningful net benefit.
There were several limitations in this study. First, this study was conducted in a single institution, although the data were reliable. We need to validate the results in multicenter research in the future. Second, a fundamental limitation of our study is the inherent coupling between microstructural and magnetic susceptibility effects in the FROC parameters derived from our acquisition scheme. We could not disentangle the contribution of genuine water diffusion heterogeneity from that induced by Δχ. Future studies employing bipolar diffusion gradients or acquisitions at multiple magnetic field strengths could help separate these effects. Third, we did not obtain many studies on the FROC model in breast cancer. This might influence the explanation of the derived parameters. Fourth, the 2D-ROI was manually drawn on DWI maps (b = 800 s/mm2) and used to produce a 3D-ROI automatically. The 3D-ROI was then copied to the derived parameter maps. Careful comparison of the DWI maps and derived parameter maps of the FROC model is necessary when setting an ROI for each lesion in the future study.
Conclusions
Whole-lesion histogram analysis of FROC-modeled DWI provides diagnostic performance comparable to ADC for distinguishing benign from malignant breast lesions, while yielding richer associations with ER/PR status and proliferative activity that likely reflect microstructural heterogeneity not captured by mono-exponential decay. These non-Gaussian metrics, particularly β_FROC_ features, represent promising adjunct biomarkers that can potentially provide additional imaging biomarkers to guide therapy decisions and predict breast cancer prognosis.
The reference list from the paper itself. Each links out to its DOI / PubMed record.
- 1The L. GLOBOCAN 2018: counting the toll of cancer. Lancet. (2018) 392(10152):985. 10.1016/S 0140-6736(18)32252-930264708 · doi ↗ · pubmed ↗
- 2Sun K Chen X Chai W Fei X Fu C Yan X Breast cancer: diffusion kurtosis MR imaging-diagnostic accuracy and correlation with clinical-pathologic factors. Radiology. (2015) 277(1):46–55. 10.1148/radiol.1514162525938679 · doi ↗ · pubmed ↗
- 3Zhang L Tang M Min Z Lu J Lei X Zhang X. Accuracy of combined dynamic contrast-enhanced magnetic resonance imaging and diffusion-weighted imaging for breast cancer detection: a meta-analysis. Acta Radiol. (2016) 57(6):651–60. 10.1177/028418511559726526275624 · doi ↗ · pubmed ↗
- 4Ei Khouli RH Jacobs MA Mezban SD Huang P Kamel IR Macura KJ Diffusion-weighted imaging improves the diagnostic accuracy of conventional 3.0-T breast MR imaging. Radiology. (2010) 256(1):64–73. 10.1148/radiol.1009136720574085 PMC 2897691 · doi ↗ · pubmed ↗
- 5Kim SH Cha ES Kim HS Kang BJ Choi JJ Jung JH Diffusion-weighted imaging of breast cancer: correlation of the apparent diffusion coefficient value with prognostic factors. J Magn Reson Imaging. (2009) 30(3):615–20. 10.1002/jmri.2188419711411 · doi ↗ · pubmed ↗
- 6Hatakenaka M Soeda H Yabuuchi H Matsuo Y Kamitani T Oda Y Apparent diffusion coefficients of breast tumors: clinical application. Magn Reson Med Sci. (2008) 7(1):23–9. 10.2463/mrms.7.2318460845 · doi ↗ · pubmed ↗
- 7Lee SH Cho N Kim SJ Cha JH Cho KS Ko ES Correlation between high resolution dynamic MR features and prognostic factors in breast cancer. Korean J Radiol. (2008) 9(1):10–8. 10.3348/kjr.2008.9.1.1018253071 PMC 2627175 · doi ↗ · pubmed ↗
- 8Kawashima H Miyati T Ohno N Ohno M Inokuchi M Ikeda H Differentiation between luminal-A and luminal-B breast cancer using intravoxel incoherent motion and dynamic contrast-enhanced magnetic resonance imaging. Acad Radiol. (2017) 24(12):1575–81. 10.1016/j.acra.2017.06.01628778511 · doi ↗ · pubmed ↗