TUG1: a potential endogenous reference gene for long noncoding RNA quantification in blood-based studies
Carlos Rodríguez-Muñoz, Anna Vila, Sally Santisteve, Anna Sánchez-Cucó, Iván D. Benítez, María C. García-Hidalgo, Marta Molinero, Manel Perez-Pons, Anna Moncusí-Moix, Ferran Barbé, Jessica González, David de Gonzalo-Calvo

TL;DR
This study identifies TUG1 as a reliable reference gene for measuring long noncoding RNAs in blood samples, improving accuracy and cost-effectiveness.
Contribution
TUG1 is shown to be the most stable endogenous control for lncRNA quantification in whole-blood studies.
Findings
TUG1 consistently ranked as the most stable lncRNA across multiple algorithms in 182 individuals.
TUG1 normalization reduced expression variability as effectively as mean-centering and better than other strategies.
TUG1 showed minimal association with clinical variables and high consistency in external RNA-seq datasets.
Abstract
Long noncoding RNAs (lncRNAs) are promising biomarkers, but their accurate quantification by qPCR requires stable endogenous controls. In the present study, we aimed to identify suitable reference lncRNAs for normalization in whole-blood samples. We profiled the expression of 84 lncRNAs and eight commonly used mRNA reference genes by RT-qPCR in samples from 182 individuals. Transcript stability was assessed using three widely applied algorithms: geNorm, NormFinder and BestKeeper. Twenty-nine lncRNAs met predefined expression criteria: consistent detection across all samples, a maximum quantification cycle (Cq) below 33 and a median Cq below 30. Among these, TUG1 consistently ranked as the most stable candidate across all algorithms. FGD5–AS1 and ZFAS1 were also selected based on high stability rankings. We next evaluated the effectiveness of different normalization strategies, comparing…
Genes, proteins, chemicals, diseases, species, mutations and cell lines named across the full text — each resolved to its canonical identifier and authoritative record.
Click any figure to enlarge with its caption.
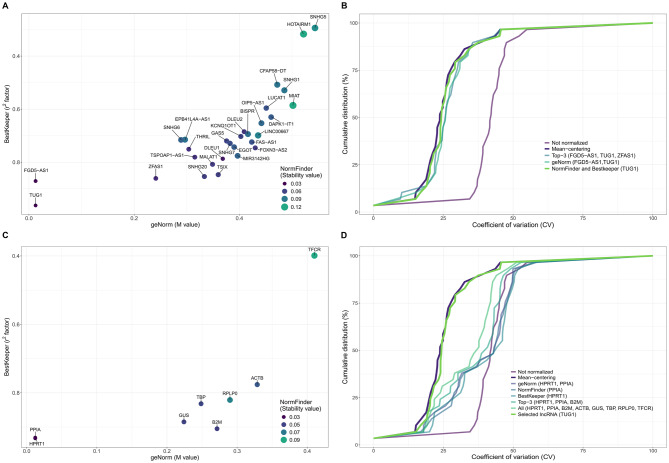 Figure 1
Peer Reviews
No public reviews on file for this paper yet. If you reviewed it on a platform where reviews are public (OpenReview, ICLR, NeurIPS, ICML), you can paste yours below so the community can read it here.
Videos
No videos yet. Explain this paper in a talk, walkthrough, or lecture? Add one.
Taxonomy
TopicsCancer-related molecular mechanisms research · Molecular Biology Techniques and Applications · RNA regulation and disease
To the editor,
Long noncoding RNAs (lncRNAs) have emerged as promising biomarkers for clinical use [1]. Their regulatory role and disease specificity, combined with their detectability through non-invasive sampling, make them attractive candidates for clinical applications [2]. Furthermore, lncRNAs could be reliably measured in blood-based samples, providing a minimally invasive platform for biomarker discovery and routine implementation [3].
Quantitative real-time polymerase chain reaction (qPCR) is the preferred method for lncRNA quantification [4]. However, technical variability inherent to RNA workflows may arise at multiple stages, including sample collection, isolation, freeze–thaw cycles, RNA extraction, input amount and enzymatic efficiencies [5]. Proper data normalization is therefore essential to minimize technical noise and reveal true biological variation [6]. Traditionally, messenger RNAs (mRNAs) have been commonly used as reference controls for normalization. However, this approach warrants reconsideration, as mRNAs differ from lncRNAs in both biochemical properties and expression dynamics. The use of endogenous controls from the same RNA class is more appropriate. In this context, we conducted a study to identify robust reference lncRNAs for normalization in whole-blood samples using a clinically homogeneous population. This targeted approach provides a controlled framework for evaluating candidate lncRNAs and generates findings that may inform future studies in broader settings.
To accomplish this, we profiled 84 lncRNAs (Supplemental Table S1) using RT-qPCR in a cohort of 182 survivors of COVID-19–induced acute respiratory distress syndrome (ARDS). Of these, 180 samples had complete quantification data and were included in the subsequent analysis (Supplemental Table S2). Details of experimental procedures and data analysis are provided in the Supplemental Material.
Twenty-nine lncRNAs met predefined expression criteria [detected in all samples, with a maximum quantification cycle (Cq) < 33 and a median Cq < 30] and were included in the stability analysis. The remaining 55 were excluded (Supplemental Table S3). Stability was assessed with the three most commonly used algorithms for reference gene validation [7]: geNorm, NormFinder and BestKeeper [8–10]. Table 1 summarizes stability values and rankings. The top candidates were the TUG1/FGD5–AS1 pair (geNorm) and TUG1 (NormFinder and BestKeeper) (Fig. 1A). Since multiple reference genes are generally recommended for accurate normalization [11], we applied a “top-three-in-at-least-two-algorithms” criterion, which resulted in the inclusion of ZFAS1. Thus, TUG1, FGD5–AS1 and ZFAS1 were selected as the final candidate set.Fig. 1. Stability and suitability of candidate endogenous reference long noncoding RNA (lncRNA) and messenger RNAs (mRNAs). A) Stability values for each candidate lncRNA calculated using geNorm, NormFinder and BestKeeper. B) Cumulative distribution plot of coefficient of variation (CV) values for lncRNA expression data under various conditions: not normalized, mean-centering, best-ranked lncRNA from each algorithm and the top three lncRnas ranked in at least two algorithms. C) Stability values for each candidate mRNA calculated using geNorm, NormFinder and BestKeeper. D) Cumulative distribution plot of CV values under different conditions: not normalized, mean-centering, best-ranked mRNA from each algorithm, top three mRNAs ranked in at least two algorithms, all eight mRNAs combined and the selected lncRNA (TUG1)Table 1. Expression levels, stability values, and rankings from independent stability analyses for candidate endogenous long noncoding RNAs (lncRNAs) and messenger RNAs (mRNAs)TypeGeneMaximum CqMedian Cq% expressionBestKeeper r factorBestKeeper r^2^factorBestKeeper RankingNormFinder Stability valueNormFinder RankinggeNorm M valuegeNorm RankinglncRNAsBISPR31.428.7100.00.8330.694200.084220.41618CFAP58-DT32.628.6100.00.7120.508270.088240.47225DAPK1–IT132.629.5100.00.7940.630230.074180.46024DLEU131.127.5100.00.8870.78770.04030.36811DLEU229.526.3100.00.8270.685210.05470.40917EGOT32.629.5100.00.8620.743120.073170.39014EPB41L4A-AS130.027.4100.00.8460.715170.086230.2975FAS-AS131.927.9100.00.8510.724140.068150.42319FGD5–AS129.025.6100.00.9330.87120.03220.0132FOXN3–AS231.427.7100.00.8640.746110.05680.43020GAS528.024.9100.00.8480.720150.061130.37612HOTAIRM131.128.2100.00.5630.317280.126290.52228KCNQ1OT132.228.9100.00.8390.703180.060120.40316LINC0066732.328.5100.00.8360.699190.096260.43621LUCAT128.525.0100.00.7720.596240.068160.45123MALAT131.628.0100.00.8990.80860.05790.3499MIAT31.427.1100.00.7650.586250.123280.50227MIR3142HG32.628.8100.00.8810.77690.079200.39715OIP5–AS129.426.1100.00.8080.653220.081210.44222SNHG132.128.9100.00.7270.529260.089250.48526SNHG2032.828.8100.00.9240.85440.058100.3338SNHG527.525.0100.00.5430.294290.104270.54429SNHG626.924.7100.00.8460.716160.077190.2894SNHG731.327.3100.00.8540.729130.066140.38213THRIL29.627.0100.00.8670.751100.05150.3046TSIX32.328.7100.00.9200.84750.059110.36010TSPOAP1–AS128.025.9100.00.8840.78180.05260.3157TUG128.525.2100.00.9810.96310.02610.0132ZFAS127.124.2100.00.9280.86130.04940.241****3mRNAsACTB23.5320.65100.00.8810.77670.05860.3297B2M19.8317.33100.00.9510.90530.04930.2715GUS31.1827.56100.00.9410.88540.05040.2243HPRT131.4728.13100.00.9660.93310.02920.0122PPIA25.8822.94100.00.9650.93120.02710.012****2RPLP025.3422.44100.00.9060.82160.07470.2906TBP31.7628.89100.00.9120.83250.05250.2494TFCR28.1425.25100.00.6320.39980.09380.4108Independent stability rankings of candidate lncRNA and mRNA reference genes according to three algorithms commonly used for reference gene validation. geNorm provides an M value based on the average pairwise variation between genes; NormFinder estimates a stability value by modeling both intra- and inter-group variation; and BestKeeper calculates a correlation coefficient (r) with the BestKeeper index, based on pairwise correlations and the standard deviation of Cq values. Lower values indicate higher stability for geNorm and NormFinder, whereas higher correlation coefficients indicate greater stability for BestKeeper
To assess their suitability, we normalized the lncRNA dataset using several strategies and compared the residual variability to that of the not normalized data (Fig. 1B). Mean-centering produced the greatest reduction, consistent with the observations of Mestdagh et al. [12] in microRNA profiling, where the geometric mean of selected candidates closely approximated the mean of the entire dataset. Strikingly, TUG1 alone outperformed multiple reference combinations in reducing variability, achieving a variability reduction nearly equivalent to that of mean-centering. We also tested eight widely used mRNA reference genes included in the assay (Supplemental Table S1). Applying the same selection criteria, the leading candidates were HPRT1/PPIA (geNorm), HPRT1 (NormFinder) and PPIA (BestKeeper), with B2M added as a third candidate (Fig. 1C and Table 1). None of the mRNA-based normalization approaches, whether single or combined, matched the performance of mean-centering and all were clearly outperformed by TUG1 (Fig. 1D). A direct comparison of stability, including both lncRNA and classical mRNA reference genes, further confirmed that TUG1 remained among the most stable candidates (Supplemental Figure S1A and Table S4) and achieved the greatest reduction in variability (Supplemental Figure S1B). Moreover, we assessed whether TUG1 expression varied with clinical characteristics of the cohort. No meaningful associations were detected (Supplemental Table S5), supporting its stability across patient subgroups. Finally, TUG1 consistently ranked among the most highly expressed and stable lncRNAs across four external RNA-seq datasets, including samples from healthy individuals and patients with amyotrophic lateral sclerosis, acute myocardial infarction and Long COVID (Supplemental Figure S2).
In summary, TUG1 is a potential endogenous reference gene for lncRNA quantification in blood-based studies. Its outstanding performance positions it as a promising and cost-effective candidate to ensure accurate and reproducible results in translational research settings, being faster, simpler and less computationally demanding than mean-centering, thus facilitating its direct implementation in routine clinical workflows.
The strengths of this study include a well-characterized cohort, large sample size and broad lncRNA panel enabling robust and unbiased candidate evaluation. Limitations include the focus on a single, highly specific patient population (COVID-ARDS survivors) and the use of a restricted lncRNA panel. Therefore, validation of TUG1 as a reference gene in independent cohorts and samples collected in different centers, is required to confirm its robustness and general applicability. Moreover, the consideration of reference lncRNAs from diverse functional categories would help minimize co-regulation risk.
Electronic supplementary material
Below is the link to the electronic supplementary material.
Supplementary Material 1
The reference list from the paper itself. Each links out to its DOI / PubMed record.
- 1Biswas S, Nagarajan N, Hewlett I, Devadas K. Identification of a circulating long non-coding RNA signature panel in plasma as a novel biomarker for the detection of acute/early-stage HIV-1 infection. Biomark Res. 2024;12:61.10.1186/s 40364-024-00597-7PMC 1116790238867244 · doi ↗ · pubmed ↗
- 2Li Y, Jiang T, Zhou W, Li J, Li X, Wang Q, et al. Pan-cancer characterization of immune-related lnc RN As identifies potential oncogenic biomarkers. Nat Commun. 2020;11:1000.10.1038/s 41467-020-14802-2PMC 703532732081859 · doi ↗ · pubmed ↗
- 3Badowski C, He B, Garmire LX. Blood-derived lnc RN As as biomarkers for cancer diagnosis: the good, the bad and the beauty. NPJ Precis Oncol. 2022;6:40.10.1038/s 41698-022-00283-7PMC 921343235729321 · doi ↗ · pubmed ↗
- 4de Gonzalo-Calvo D, Sopić M, Devaux Y. Methodological considerations for circulating long noncoding RNA quantification. Trends Mol Med. 2022;28(8):616–18.10.1016/j.molmed.2022.05.01135701316 · doi ↗ · pubmed ↗
- 5Lakkisto P, Dalgaard LT, Belmonte T, Pinto-Sietsma SJ, Devaux Y, de Gonzalo-Calvo D. Development of circulating micro RNA-based biomarkers for medical decision-making: a friendly reminder of what should NOT be done. Crit Rev Clin Lab Sci. 2023;60(2):141–52.10.1080/10408363.2022.212803036325621 · doi ↗ · pubmed ↗
- 6Burdiel M, Jiménez J, Rodríguez-Antolín C, García-Guede Á, Pernía O, Sastre-Perona A, et al. Mi R-151a: a robust endogenous control for normalizing small extracellular vesicle cargo in human cancer. Biomark Res. 2023;11:94.10.1186/s 40364-023-00526-0PMC 1058997937864266 · doi ↗ · pubmed ↗
- 7Djari A, Madignier G, Chervin C, van der Rest B, Giovannoni JJ, Bouzayen M, et al. A stable combination of non-stable genes outperforms standard reference genes for RT-q PCR data normalization. Sci Rep. 2024;14:31278.10.1038/s 41598-024-82651-w PMC 1168213839733017 · doi ↗ · pubmed ↗
- 8Vandesompele J, De Preter K, Pattyn F, Poppe B, Van Roy N, De Paepe A, et al. Accurate normalization of real-time quantitative RT-PCR data by geometric averaging of multiple internal control genes. Genome Biol. 2002;3(7):research 0034.1.10.1186/gb-2002-3-7-research 0034 PMC 12623912184808 · doi ↗ · pubmed ↗