Variations in Estimated Glomerular Filtration Rate Across Countries in Patients With Metabolic Dysfunction‐Associated Steatotic Liver Disease and Their Association With Liver Fibrosis: A Multicenter Study
Jing Zhao, Ferenc E. Mózes, Xin‐Yu Xu, Dong Ji, Huiqing Liang, Xiaoling Chi, Jinjun Chen, Takeshi Okanoue, Toshihide Shima, Yongfen Zhu, Christian Labenz, Bihui Zhong, Masato Yoneda, Atsushi Nakajima, Junping Shi, Jing Zhang, Sanjiv Mahadeva, Wah‐Kheong Chan, Fangping He

TL;DR
This study finds that kidney function, measured by eGFR, varies across countries in people with liver disease, and is linked to liver fibrosis severity in Asians but not Europeans.
Contribution
The study reveals ethnic and regional differences in eGFR and liver fibrosis associations among MASLD patients.
Findings
European participants had lower eGFR and higher liver fibrosis compared to Asians.
eGFR levels were inversely associated with liver fibrosis in Asians but not in Europeans.
Chinese participants had the highest eGFR, while Romanian participants had the lowest.
Abstract
Metabolic dysfunction‐associated steatotic liver disease (MASLD) has become the most prevalent chronic liver disease globally. Previous studies have shown that MASLD is an independent risk factor for chronic kidney disease (CKD), but the variations in estimated glomerular filtration rate (eGFR) levels across countries with different ethnic backgrounds have not been extensively reported. We enrolled 3308 participants with biopsy‐proven MASLD from 34 centers in this multinational study and analyzed the associations between eGFR and histological severity of liver fibrosis in different countries. European participants had lower eGFR levels (92.2 ± 20.7 vs. 104.7 ± 17.3 mL/min/1.73 m2) and significant liver fibrosis (61.4 vs. 32.4%) than Asian individuals. In Asia, Chinese participants had the highest mean eGFR level at 105.8 mL/min/1.73 m2, while Malaysian participants had the lowest at…
Genes, proteins, chemicals, diseases, species, mutations and cell lines named across the full text — each resolved to its canonical identifier and authoritative record.
Click any figure to enlarge with its caption.
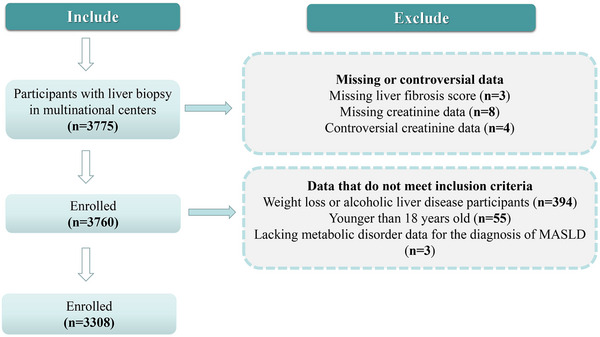 FIGURE 1
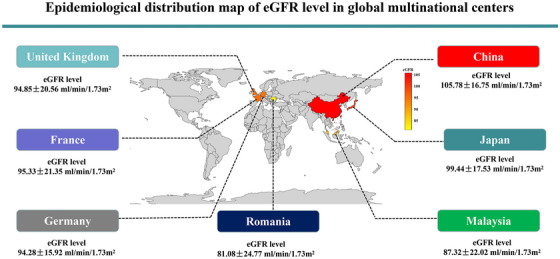 FIGURE 2
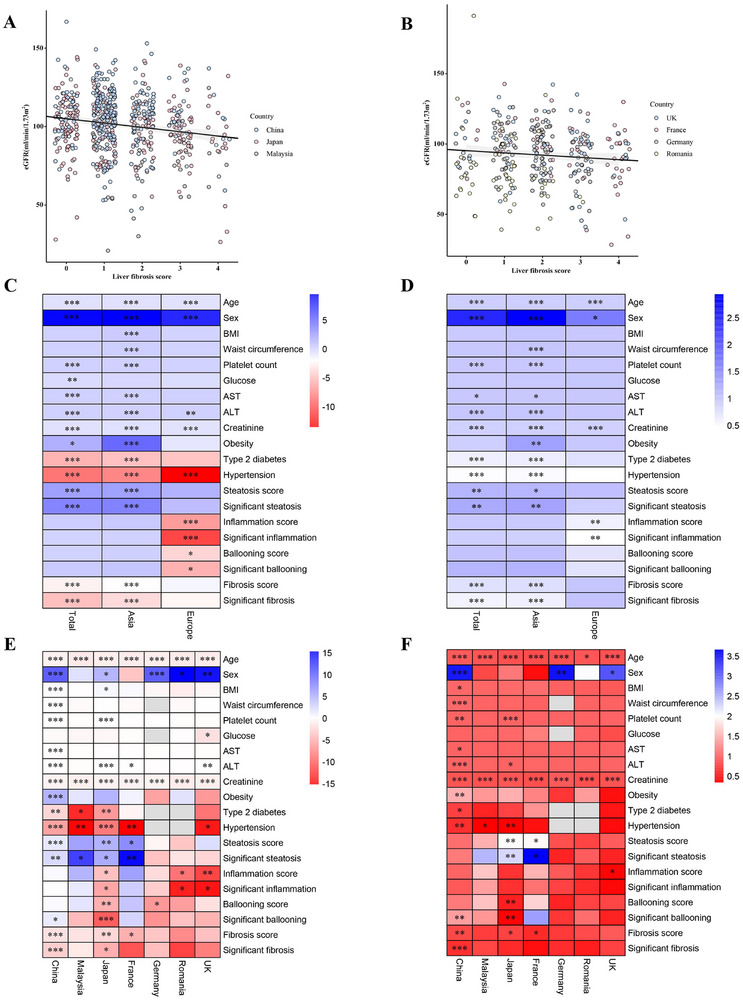 FIGURE 3
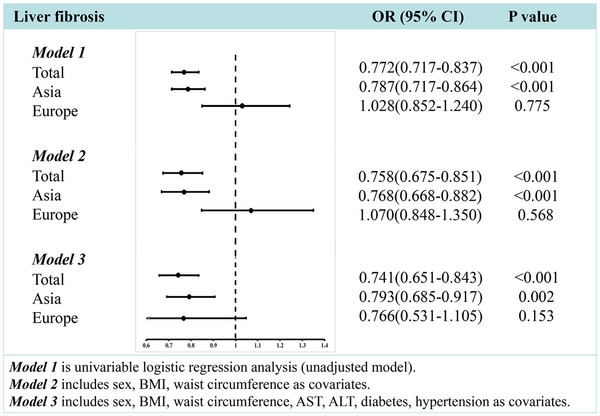 FIGURE 4
| Asia | Europe | |||||||||
|---|---|---|---|---|---|---|---|---|---|---|
| Characteristics | Total ( |
Total ( |
China ( |
Malaysia ( |
Japan ( |
Total ( |
France ( |
Germany ( |
Romania ( |
UK ( |
|
| ||||||||||
| Age (years) | 43 ± 14 | 42 ± 14 | 41 ± 13 | 52 ± 12 | 56 ± 14 | 50 ± 14 | 57 ± 13 | 48 ± 13 | 42 ± 11 | 52 ± 13 |
| Male sex ( | 1950 (59.0) | 1751 (58.7) | 1585 (60.3) | 35 (44.3) | 131 (47.6) | 199 (61.0) | 41 (60.3) | 68 (56.7) | 43 (71.7) | 47 (60.3) |
| BMI (kg/m2) | 27.6 ± 4.6 | 27.1 ± 4.3 | 27.1 ± 4.3 | 28.7 ± 4.8 | 26.9 ± 3.9 | 31.5 ± 5.5 | 30.4 ± 5.4 | 31.6 ± 5.4 | 29.7 ± 4.1 | 33.6 ± 6.0 |
| Waist circumference (cm) | 95.3 ± 12.3 | 93.9 ± 11.3 | 93.8 ± 11.5 | 93.3 ± 11.1 | 95.1 ± 9.2 | 106.5 ± 13.8 | 104.7 ± 14.6 | NA | 102.2 ± 13.0 | 110.8 ± 12.3 |
| Platelet count (×109/L) | 230.5 ± 66.0 | 231.5 ± 65.8 | 231.9 ± 64.5 | 269.4 ± 70.5 | 216.4 ± 71.7 | 221.6 ± 67.1 | 185.4 ± 68.9 | 237.7 ± 62.6 | 245.1 ± 49.6 | 210.5 ± 69.2 |
| Glucose (mmol/L) | 6.0 ± 2.1 | 5.9 ± 2.0 | 5.9 ± 2.1 | 6.4 ± 1.9 | 6.1 ± 1.7 | 6.7 ± 2.7 | 6.9 ± 2.9 | NA | 6.2 ± 1.9 | 7.0 ± 3.0 |
| AST (U/L) | 52.8 ± 36.4 | 52.6 ± 36.7 | 52.6 ± 36.9 | 43.2 ± 33.6 | 55.1 ± 34.6 | 54.8 ± 33.9 | 62.4 ± 38.2 | 59.3 ± 34.4 | 48.5 ± 35.6 | 46.0 ± 24.2 |
| ALT (U/L) | 85.8 ± 65.9 | 86.2 ± 66.4 | 87.5 ± 67.6 | 71.0 ± 50.2 | 79.4 ± 57.5 | 81.7 ± 61.4 | 75.4 ± 52.6 | 90.9 ± 78.2 | 93.6 ± 52.4 | 63.8 ± 37.2 |
| Creatinine (µmol/L) | 70.5 ± 17.3 | 69.7 ± 16.6 | 69.9 ± 15.6 | 80.4 ± 25.8 | 64.2 ± 19.8 | 78.3 ± 21.4 | 70.9 ± 26.5 | 76.4 ± 13.2 | 96.6 ± 22.3 | 73.6 ± 18.1 |
| eGFR (mL/min/1.73 m2) | 103.5 ± 18.1 | 104.7 ± 17.3 | 105.8 ± 16.8 | 87.3 ± 22.0 | 99.4 ± 17.5 | 92.2 ± 20.7 | 95.3 ± 21.4 | 94.3 ± 15.9 | 81.1 ± 24.8 | 94.9 ± 20.6 |
| Declined eGFR (%) | 681 (20.6) | 536 (18.0) | 429 (16.3) | 43 (54.4) | 64 (23.3) | 145 (44.5) | 22 (32.4) | 51 (42.5) | 44 (73.3) | 28 (35.9) |
|
| ||||||||||
| Obesity (%) | 1262 (38.2) | 1082 (36.3) | 934 (35.5) | 41 (51.9) | 107 (38.9) | 180 (55.2) | 33 (48.5) | 67 (55.8) | 23 (38.3) | 57 (73.1) |
| Type 2 diabetes (%) | 778 (23.5) | 700 (23.5) | 513 (19.5) | 45 (57.0) | 142 (51.6) | 78 (53.8) | 37 (54.4) | NA | NA | 41 (52.6) |
| Hypertension (%) | 793 (24.0) | 735 (24.7) | 547 (20.8) | 46 (58.2) | 142 (51.6) | 58 (49.2) | 38 (55.9) | NA | NA | 20 (25.6) |
|
| ||||||||||
| Steatosis score | ||||||||||
| 0 | 45 (1.4) | 36 (1.2) | 35 (1.3) | 0 (0.0) | 1 (0.4) | 9 (2.8) | 4 (5.9) | 5 (4.2) | 0 (0.0) | 0 (0.0) |
| 1 | 1103 (33.3) | 988 (33.1) | 795 (30.3) | 31 (39.2) | 162 (58.9) | 115 (35.2) | 22 (32.3) | 46 (38.3) | 22 (36.7) | 25 (32.0) |
| 2 | 1269 (38.4) | 1142 (38.3) | 1033 (39.3) | 26 (33.0) | 83 (30.2) | 127 (39.0) | 20 (29.4) | 62 (51.7) | 21 (35.0) | 24 (30.8) |
| 3 | 891 (26.9) | 816 (27.4) | 765 (29.1) | 22 (27.8) | 29 (10.5) | 75 (23.0) | 22 (32.4) | 7 (5.8) | 17 (28.3) | 29 (37.2) |
| Significant steatosis ( | 2160 (65.3) | 1958 (65.7) | 1798 (68.4) | 48 (60.8) | 112 (40.7) | 202 (62.0) | 42 (61.8) | 69 (57.5) | 38 (63.3) | 53 (68.0) |
| Inflammation score | ||||||||||
| 0 | 174 (5.3) | 118 (4.0) | 77 (2.9) | 2 (2.5) | 39 (14.2) | 56 (17.2) | 10 (14.7) | 29 (24.2) | 1 (1.7) | 16 (20.5) |
| 1 | 1783 (53.9) | 1600 (53.6) | 1407 (53.6) | 41 (51.9) | 152 (55.3) | 184 (56.4) | 45 (66.2) | 70 (58.3) | 24 (40.0) | 45 (57.7) |
| 2 | 1203 (36.4) | 1133 (38.0) | 1025 (39.0) | 35 (44.3) | 73 (26.5) | 70 (21.5) | 12 (17.6) | 20 (16.7) | 22 (36.7) | 16 (20.5) |
| 3 | 147 (4.4) | 131 (4.4) | 119 (4.5) | 1 (1.3) | 11 (4.0) | 16 (4.9) | 1 (1.5) | 1 (0.8) | 13 (21.6) | 1 (1.3) |
| Significant inflammation ( | 1350 (40.8) | 1264 (42.4) | 1144 (43.5) | 36 (45.6) | 84 (30.5) | 86 (26.4) | 13 (19.1) | 21 (17.5) | 35 (58.3) | 17 (21.8) |
| Ballooning score | ||||||||||
| 0 | 513 (15.5) | 440 (14.8) | 334 (12.7) | 7 (8.9) | 99 (36.0) | 73 (22.4) | 19 (27.9) | 35 (29.2) | 3 (5.0) | 16 (20.5) |
| 1 | 1617 (48.9) | 1459 (48.9) | 1314 (50.0) | 42 (53.1) | 103 (37.4) | 158 (48.5) | 28 (41.2) | 71 (59.2) | 24 (50.0) | 35 (44.9) |
| 2 | 1178 (35.6) | 1083 (36.3) | 980 (37.3) | 30 (38.0) | 73 (26.6) | 95 (29.1) | 21 (30.9) | 14 (11.6) | 33 (55.0) | 27 (34.6) |
| Significant ballooning ( | 1178 (35.6) | 1083 (36.3) | 980 (37.3) | 30 (38.0) | 73 (26.6) | 95 (29.1) | 21 (30.9) | 14 (11.6) | 33 (55.0) | 27 (34.6) |
| Fibrosis score | ||||||||||
| 0 | 535 (16.2) | 497 (16.7) | 405 (15.4) | 2 (2.5) | 90 (32.7) | 38 (11.6) | 6 (8.8) | 7 (5.8) | 18 (30.0) | 7 (9.0) |
| 1 | 1605 (48.5) | 1517 (50.9) | 1415 (53.8) | 31 (39.3) | 71 (25.8) | 88 (27.0) | 9 (13.2) | 35 (29.2) | 26 (43.3) | 18 (23.1) |
| 2 | 714 (21.6) | 617 (20.7) | 544 (20.7) | 27 (34.2) | 46 (16.7) | 97 (29.8) | 13 (19.1) | 57 (47.5) | 12 (20.0) | 15 (19.2) |
| 3 | 315 (9.5) | 246 (8.2) | 180 (6.9) | 14 (17.7) | 52 (19.0) | 69 (21.2) | 15 (22.1) | 21 (17.5) | 4 (6.7) | 29 (37.2) |
| 4 | 139 (4.2) | 105 (3.5) | 84 (3.2) | 5 (6.3) | 16 (5.8) | 34 (10.4) | 25 (36.8) | 0 (0.0) | 0 (0.0) | 9 (11.6) |
| Significant fibrosis ( | 1168 (35.3) | 968 (32.4) | 808 (30.8) | 46 (58.2) | 114 (41.5) | 200 (61.4) | 53 (78.0) | 78 (65.0) | 16 (26.7) | 53 (68.0) |
| Asian ( | European ( | |||||
|---|---|---|---|---|---|---|
| Characteristics |
eGFR < 90 mL/min/1.73 m2 ( |
eGFR ≥ 90 mL/min/1.73 m2 ( |
| eGFR < 90 mL/min/1.73 m2 ( |
eGFR ≥ 90 mL/min/1.73 m2 ( |
|
|
| ||||||
| Age (years) | 51.0 ± 14.2 | 40.4 ± 13.3 | <0.001 | 54.9 ± 12.5 | 45.1 ± 13.0 | <0.001 |
| Male sex ( | 199 (37.1) | 1552 (63.5) | <0.001 | 78 (53.8) | 121 (66.9) | 0.016 |
| BMI (kg/m2) | 26.8 ± 4.0 | 27.2 ± 4.3 | 0.059 | 31.5 ± 5.5 | 31.5 ± 5.5 | 0.998 |
| Waist circumference (cm) | 91.5 ± 10.9 | 94.4 ± 11.4 | <0.001 | 106.3 ± 12.8 | 106.5 ± 14.5 | 0.928 |
| Platelet count (×109/L) | 221.8 ± 67.3 | 233.6 ± 65.3 | <0.001 | 226.1 ± 66.1 | 218.0 ± 67.9 | 0.280 |
| Glucose (mmol/L) | 6.0 ± 1.8 | 5.9 ± 2.1 | 0.733 | 6.7 ± 2.4 | 6.8 ± 3.0 | 0.818 |
| AST (U/L) | 49.3 ± 35.0 | 53.3 ± 37.0 | 0.021 | 52.1 ± 32.0 | 56.9 ± 35.2 | 0.198 |
| ALT (U/L) | 71.6 ± 58.4 | 89.5 ± 67.6 | <0.001 | 77.0 ± 48.9 | 85.4 ± 69.8 | 0.218 |
| Creatinine (µmol/L) | 85.5 ± 17.9 | 66.2 ± 14.0 | <0.001 | 91.7 ± 22.0 | 67.5 ± 13.2 | <0.001 |
| eGFR (mL/min/1.73m2) | 78.1 ± 11.1 | 110.5 ± 12.2 | <0.001 | 72.8 ± 14.2 | 105.8 ± 12.3 | 0.000 |
|
| ||||||
| Obesity (%) | 165 (30.8) | 917 (37.5) | 0.003 | 80 (55.2) | 100 (55.3) | 0.989 |
| Type 2 diabetes (%) | 162 (30.2) | 538 (22.0) | <0.001 | 29 (20.0) | 49 (27.1) | 0.461 |
| Hypertension (%) | 191 (35.6) | 544 (22.2) | <0.001 | 25 (17.2) | 33 (18.2) | 0.061 |
|
| ||||||
| Steatosis score | ||||||
| 0 | 6 (1.1) | 30 (1.2) | 0.837 | 5 (3.4) | 4 (2.2) | 0.498 |
| 1 | 209 (39.0) | 779 (31.8) | 0.001 | 49 (33.8) | 66 (35.5) | 0.616 |
| 2 | 187 (34.9) | 955 (39.0) | 0.073 | 62 (42.8) | 65 (35.9) | 0.208 |
| 3 | 134 (25.0) | 682 (27.9) | 0.175 | 29 (20.0) | 46 (25.4) | 0.248 |
| Significant steatosis ( | 321 (59.9) | 1637 (66.9) | 0.002 | 91 (62.8) | 111 (61.3) | 0.791 |
| Inflammation score | ||||||
| 0 | 28 (5.2) | 90 (3.7) | 0.097 | 19 (13.1) | 37 (20.4) | 0.081 |
| 1 | 273 (50.9) | 1327 (54.3) | 0.163 | 76 (52.4) | 108 (59.7) | 0.189 |
| 2 | 210 (39.2) | 923 (37.8) | 0.533 | 39 (26.9) | 31 (17.1) | 0.033 |
| 3 | 25 (4.6) | 106 (4.3) | 0.735 | 11 (7.6) | 5 (2.8) | 0.045 |
| Significant inflammation ( | 235 (43.8) | 1029 (42.1) | 0.451 | 50 (34.5) | 36 (19.9) | 0.003 |
| Ballooning score | ||||||
| 0 | 73 (13.6) | 367 (15.0) | 0.413 | 25 (17.3) | 48 (26.5) | 0.046 |
| 1 | 287 (53.6) | 1172 (47.9) | 0.018 | 73 (50.3) | 85 (47.0) | 0.544 |
| 2 | 176 (32.8) | 907 (37.1) | 0.064 | 47 (32.4) | 48 (26.5) | 0.244 |
| Significant ballooning ( | 176 (32.8) | 907 (37.1) | 0.064 | 47 (32.4) | 48 (26.5) | 0.244 |
| Fibrosis score | ||||||
| 0 | 75 (14.0) | 422 (17.3) | 0.067 | 21 (14.5) | 17 (9.4) | 0.155 |
| 1 | 240 (44.8) | 1277 (52.2) | 0.002 | 36 (24.8) | 52 (28.7) | 0.430 |
| 2 | 130 (24.2) | 487 (19.9) | 0.025 | 41 (28.3) | 56 (30.9) | 0.601 |
| 3 | 59 (11.0) | 187 (7.6) | 0.010 | 31 (21.4) | 38 (21.0) | 0.933 |
| 4 | 32 (6.0) | 73 (3.0) | 0.001 | 16 (11.0) | 18 (10.0) | 0.749 |
| Significant fibrosis ( | 221 (41.2) | 747 (30.5) | <0.001 | 88 (60.7) | 112 (61.9) | 0.827 |
| Model 1 | Model 2 | Model 3 | ||||
|---|---|---|---|---|---|---|
| OR (95% CI) |
| OR (95% CI) |
| OR (95% CI) |
| |
| Non‐type 2 diabetes | 0.734 (0.657–0.819) | <0.001 | 0.706 (0.597–0.836) | <0.001 | 0.712 (0.598–0.849) | <0.001 |
| Type 2 diabetes | 0.881 (0.766–1.013) | 0.076 | 0.774 (0.646–0.927) | 0.005 | 0.743 (0.609–0.908) | 0.004 |
| Non‐hypertension | 0.735 (0.658–0.822) | <0.001 | 0.708 (0.598–0.839) | <0.001 | 0.693 (0.579–0.831) | <0.001 |
| Hypertension | 0.874 (0.761–1.002) | 0.054 | 0.780 (0.653–0.932) | 0.006 | 0.795 (0.659–0.960) | 0.017 |
| Non‐obesity | 0.775 (0.705–0.851) | <0.001 | 0.756 (0.660–0.866) | <0.001 | 0.754 (0.649–0.876) | <0.001 |
| Obesity | 0.762 (0.645–0.899) | 0.001 | 0.754 (0.598–0.950) | 0.017 | 0.698 (0.534–0.912) | 0.008 |
- —National Natural Science Foundation of China10.13039/501100001809
- —China Postdoctoral Science Foundation10.13039/501100002858
- —Top Talent Support Program for young and middle‐aged people of Wuxi Health Committee
- —Scientific technological innovation and venture capital fund in Wuxi
- —the Southampton NIHR Biomedical Research Centre
Peer Reviews
No public reviews on file for this paper yet. If you reviewed it on a platform where reviews are public (OpenReview, ICLR, NeurIPS, ICML), you can paste yours below so the community can read it here.
Videos
No videos yet. Explain this paper in a talk, walkthrough, or lecture? Add one.
Taxonomy
TopicsLiver Disease Diagnosis and Treatment · Chronic Kidney Disease and Diabetes · Liver Diseases and Immunity
Introduction
1
Metabolic dysfunction‐associated steatotic liver disease (MASLD) has become a significant public health problem with the increasing global epidemic of obesity, resulting in substantial social and economic burdens in many global regions [1, 2, 3]. Similar to the metabolic dysfunction‐associated fatty liver disease (MAFLD) definition, this newly proposed nomenclature better emphasizes the pathogenic role of metabolic dysfunction in this common steatotic liver disease [4, 5, 6, 7]. It has also been reported that MASLD may contribute to the development of extra‐hepatic complications, such as cardiovascular disease and chronic kidney disease (CKD) [8, 9, 10, 11, 12].
CKD is a major public health problem worldwide, with a global prevalence of more than 10% that is increasing year by year [13, 14]. Previous studies have shown that the prevalence of CKD is greater in individuals with MASLD and liver fibrosis compared with their counterparts with no liver fibrosis [15, 16, 17, 18], and that the incidence of CKD with or without proteinuria is independently associated with liver fibrosis, even after adjusting for traditional renal risk factors [15]. We have systematically described the potential mechanisms involved in the link between MASLD and CKD [9]. In addition, international experts from 26 countries contributed to a consensus on the relationship between MASLD and CKD through a Delphi investigation, guiding the prevention and treatment of both MASLD and CKD [19].
Estimated glomerular filtration rate (eGFR) is a key indicator for assessing renal function, which is crucial for early detection and assessment of CKD, guiding medication use and predicting prognosis [20]. eGFR decline may suggest severe kidney damage and is closely associated with the risk of end‐stage renal disease and mortality [21]. eGFR decline is also closely related to the progression of various extra‐renal diseases, including cardiovascular disease and certain cancers [22, 23]. Moreover, our previous study analyzed and predicted the relationship between liver fibrosis and eGFR using artificial intelligence in MASLD [24]. However, this relationship needs to be further verified in multicenter cohort studies and the geographical variations of eGFR across countries among patients with MASLD need to be further explored.
In this multinational cohort study, we combined data from 34 centers across European and Asian countries to illustrate the epidemiological distribution of eGFR levels among individuals with biopsy‐confirmed MASLD. We examined the association between eGFR level and the histological severity of liver fibrosis, aiming to provide new insights into the prevention of CKD in people with MASLD.
Results
2
Clinical Characteristics of MASLD Population
2.1
As shown in Figure 1, in this multinational study, we enrolled 3308 adult participants with biopsy‐confirmed MASLD. Table 1 shows the main clinical and biochemical characteristics, as well as the liver biopsy features of MASLD participants. The average age of participants was 43 ± 14 years, and the proportion of men was 59.0%.
The flow chart of MASLD population enrollment. MASLD, metabolic dysfunction‐associated steatotic liver disease.
The prevalence of type 2 diabetes and hypertension was 23.5 and 24.0%, respectively. The prevalence of obesity was 38.2%, and the mean body mass index (BMI) was 27.6 ± 4.6 kg/m^2^. The mean eGFR level (as estimated by the CKD‐EPI equation) of the total population was 103.5 ± 18.1 mL/min/1.73 m^2^, and 20.6% had a decreased eGFR (defined as eGFR < 90 mL/min/1.73 m^2^). For liver biopsy data, the proportion of significant steatosis, inflammation, ballooning, and fibrosis were 65.3, 40.8, 35.6, and 35.3%, respectively.
Clinical Characteristics of MASLD in Different Regions
2.2
As shown in Table 1, European participants (n = 326) were more likely to be older, and had significantly higher fasting glucose levels and a greater prevalence of type 2 diabetes and hypertension than Asian participants (n = 2982). European participants also had a significantly higher serum creatinine (78.3 ± 21.4 vs. 69.7 ± 16.6 µmol/L), lower eGFR (92.2 ± 20.7 vs. 104.7 ± 17.3 mL/min/1.73 m^2^) and a greater prevalence of significant fibrosis (61.4 vs. 32.4%) than Asian participants. As shown in Table 2, in Asia and Europe, participants with declined eGFR were older than those with normal eGFR. In Asian participants with declined eGFR, there was a higher prevalence of diabetes and hypertension and lower levels of platelets and alanine aminotransferase (ALT) concentration; this difference was not observed in the European population. Furthermore, Asian participants with declined eGFR had significantly higher proportion of significant liver fibrosis, while European participants with declined eGFR had more significant inflammation.
Clinical Characteristics of MASLD Population in Different Countries
2.3
MASLD data in each country were analyzed individually. In Table 1 and Figure 2, data show that Malaysia had the highest prevalence of diabetes and hypertension, 57.0 and 58.2%, respectively. The UK had the highest prevalence of obesity at 73.1% with a mean (SD) eGFR level of 94.9 ± 20.6 mL/min/1.73 m^2^. In Europe, France had the highest mean eGFR level at 95.3 mL/min/1.73 m^2^ and Romania had the lowest at 81.1 mL/min/1.73 m^2^. In Asia, China had the highest mean eGFR level at 105.8 mL/min/1.73 m^2^ and Malaysia had the lowest at 87.3 mL/min/1.73 m^2^. Malaysia had the highest proportion of significant liver fibrosis at 58.2%, and China had the lowest at 30.8%. France had the highest proportion of significant liver fibrosis at 78.0% and Romania had the lowest at 26.7%.
Epidemiological distribution map of eGFR level in global multinational centers. The epidemiological distribution map was drawn according to the Standard map service of Ministry of Natural Resources of the People's Republic of China. Map approval number: GS(2016)1553. eGFR, estimated glomerular filtration rate.
Correlation Analysis Between eGFR and Liver Fibrosis in Asia and Europe
2.4
As reported in Figure 3A,B, eGFR levels decreased gradually with the increase in liver fibrosis scores both in Asia and Europe. In Figure 3C,D, the eGFR level was inversely associated with liver fibrosis score (β: −2.088, 95% confidence interval [CI]: −2.730, −1.445, p < 0.001) in Asia. However, this association was not significant in Europe. In univariable linear regression analyses, as shown in Figure 3E,F, eGFR level was inversely associated with liver fibrosis score in China (β: −1.679, 95% CI: −2.375, −0.984, p < 0.001), Japan (β: −2.214, 95% CI: −3.830, −0.596, p = 0.007) and France (β: −4.483, 95% CI: −8.253, −0.713, p = 0.021), but not in Malaysia, Germany, Romania, and the UK. In binary logistic regression analyses, there was a significant inverse association between eGFR and liver fibrosis score in China (odds ratio [OR] 0.827, 95% CI: 0.742–0.921), Japan (OR 0.793, 95% CI: 0.638–0.985), and France (OR 0.628, 95% CI: 0.402–0.982), but not in Malaysia, Germany, Romania, and the UK. In addition, there was a significant inverse association between eGFR and liver fibrosis score (OR: 0.787, 95% CI: 0.717–0.864) in the pooled Asian population. After adjusting for traditional renal risk factors, such as sex, adiposity measures (BMI, waist circumference), hypertension, diabetes, and serum transaminases, eGFR remained significantly associated with liver fibrosis in the Asian population (adjusted OR 0.793, 95% CI: 0.685–0.917) (see Figure 4 and Table 3) but not in the European population. These results suggest that the histological severity of liver fibrosis in MASLD increased significantly with decreasing eGFR levels in Asian but not European participants.
*Trend chart and association between eGFR and liver fibrosis score in different regions. In the scatter plot, each point represents the liver fibrosis score and eGFR values for a specific individual. To reduce data redundancy and improve visualization, a random sample of 300 data points was taken for China, which had a larger sample size. Jitter was added to the plot to alleviate point overlap and enhance clarity. Additionally, a linear curve and its corresponding 95% confidence interval were included to illustrate the overall trend between liver fibrosis score and eGFR. (A) Trend chart between eGFR and liver fibrosis score in Asia. (B) Trend chart between eGFR and liver fibrosis score in Europe. (C) Heat map of linear regression analysis between eGFR and liver fibrosis score in different regions, where different colors indicated the β value. ***p < 0.001, **p < 0.01, *p < 0.05. (D) Heat map of binary logistic regression analysis between eGFR and liver fibrosis score in different regions, where different colors indicated the OR value. ***p < 0.001, **p < 0.01, *p < 0.05. (E) Heat map of linear regression analysis between eGFR and liver fibrosis score in different countries, where different colors indicated the β value. ***p < 0.001, **p < 0.01, *p < 0.05. (F) Heat map of binary logistic regression analysis between eGFR and liver fibrosis score in different countries, where different colors indicated the OR value. ***p < 0.001, **p < 0.01, p < 0.05. AST, aspartate aminotransferase; ALT, alanine aminotransferase; BMI, body mass index; eGFR, estimated glomerular filtration rate.
Association between eGFR and liver fibrosis score in different regions after adjusting for traditional metabolic factors. AST, aspartate aminotransferase; ALT, alanine aminotransferase; BMI, body mass index; eGFR, estimated glomerular filtration rate.
Discussion
3
To our knowledge, this multinational cohort study is the first to systematically describe the geographical variations of eGFR levels in adult individuals with biopsy‐confirmed MASLD across different countries and to analyze the associations between eGFR levels and the histological severity of liver fibrosis. Our results serve as a call to physicians to pay more attention to assessing the risk of CKD in individuals with MASLD. Importantly, our data show that there are significant differences between countries and regions in the association between eGFR levels and liver fibrosis severity, with an independent inverse association observed only in Asian countries and not in European countries.
A large meta‐analysis of more than 10 million individuals reported that the global prevalence of MASLD was 38.8% (95% CI 32.9–44.9%) [25], reaching 50.7% (95% CI 46.9–54.4%) in the overweight and obesity populations [26], thus further highlighting that MASLD has become a serious public health problem worldwide. Growing evidence showed that individuals with MASLD are at high risk of developing CKD [14, 15, 27].
Currently, there are a lack of large epidemiological studies describing the geographical distribution of eGFR levels among adult individuals with MASLD in different countries worldwide. After pooling individual data of 3308 individuals with biopsy‐proven MASLD from 34 centers in seven countries, we compared the clinical data between Asian and European participants and found that European people had significantly higher adiposity measures and a greater prevalence of metabolic syndrome traits involved in the diagnosis of MASLD, than Asian individuals. Europeans with MASLD also had lower eGFR levels than Asians. Further analysis in each country showed that China had the highest eGFR levels and Malaysia had the lowest amongst Asian countries, whilst France had the highest eGFR levels and Romania had the lowest eGFR levels in Europe. This is partly consistent with the results from a previous study showing that although the overall prevalence of CKD in China was lower than in Japan and Malaysia, China is becoming the country with the largest number of individuals with CKD because of its large overall population [13]. We also found that amongst the European countries, the eGFR level was lower in Romania than in France, Germany, and UK, but no relevant research exists to explain this difference. Brück et al. [28] reported that the eGFR level in Europe varied from 80.7 mL/min/1.73 m^2^ in Ireland to 100.4 mL/min/1.73 m^2^ in Italy, but this study did not include data from Germany and UK. Therefore, this finding requires further exploration.
When we stratified our participants with MASLD into those with a normal eGFR level (i.e., ≥90 mL/min/1.73 m^2^, which is the most commonly used cutoff value for defining normal renal function [29, 30]) and those with a declined eGFR level (<90 mL/min/1.73 m^2^), we found that both in Asia and Europe, participants with a declined eGFR were older and more likely to be female, suggesting that we should pay more attention to the risk of developing CKD in the elderly female MASLD population. Moreover, European participants with a decreased eGFR also had a higher prevalence of type 2 diabetes and hypertension and lower platelet counts than their counterparts with a normal eGFR. Although obesity has commonly been recognized as a risk factor for CKD [31, 32], in our study, the proportion of obese population with eGFR below 90 mL/min/1.73 m^2^ was significantly decreased. A possible explanation for this finding might be due to the abnormal hemodynamics in obese individuals during early stages of renal dysfunction, thereby leading to an increase in glomerular perfusion and filtration pressure and a subsequent eGFR reduction [33].
Liver biopsy remains the reference standard for diagnosing MASLD, and liver histology scores play an important role in assessing the severity of liver disease [34]. Among these liver histology scores, the severity of liver fibrosis has been reported to be closely related to renal function [15, 19, 35]. Notably, our multinational cohort study found that participants with decreased eGFR had higher liver fibrosis scores and a greater proportion of significant liver fibrosis (score F2 or greater), especially in the Asian population, consistent with previous studies [7, 15, 19]. However, this phenomenon seems to be different in the European population since we found that participants with declined eGFR had higher liver inflammation than those with a normal eGFR, whilst there was no significant difference in mean liver fibrosis score between these two groups. We also found that in both Asian and European countries, as the liver fibrosis score gradually increased, the eGFR level gradually decreased, which was consistent with our previous study [15]. Furthermore, our regression analyses also showed that eGFR level was inversely associated with liver fibrosis severity only in the Asian MASLD population (but not in the European countries), after adjusting for common renal risk factors. This is consistent with a previous study, which revealed a geographical difference in the correlation between MASLD and risk of CKD that might be weakened in a high socio‐demographic index region [36]. A possible explanation is that Europeans generally have greater muscle mass than Asian individuals [37, 38, 39], which may result in higher serum creatinine concentrations and consequently lower eGFR levels. Additionally, the older age of our European participants when compared with Asian participants could also contribute to this finding. Our analyses found that China, Japan, and France showed consistent results, supporting a significant inverse association between eGFR and the severity of liver fibrosis. In contrast, we did not observe any association in Malaysia, Germany, Romania, and the UK. This latter finding is not consistent with previous reports [15, 19]. There are no relevant studies to support or explain our conclusion, but we suspect that this might be partly due to an insufficient sample size in some countries. We will repeat the analysis when we expand the population in future follow‐up studies.
The major strength of our multinational study is that this is the first large study to systematically describe the geographical variations of eGFR in patients with biopsy‐proven MASLD in different countries and regions worldwide. Thus, the data provide a substantial contribution to global research on eGFR in MASLD in different ethnic groups. However, the current study also has some important limitations. First, the retrospective cross‐sectional design of the study does not allow us to draw any conclusion about causality of the observed associations. A long‐term follow‐up of these participants is ongoing in a larger subsequent study to validate our findings. Second, there may have been a selection bias since we enrolled only participants with MASLD who had metabolic risk factors, but other factors, such as alcoholic liver disease, were excluded. In addition, there is a potential sample mismatch and lack of uniform inclusion and exclusion criteria across different centers and countries, which might also have introduced a bias. Third, this study did not have detailed information about albumin excretion rate, serum cystatin C concentrations, medication use or lifestyle variables. Therefore, we only calculated eGFR by using the serum creatinine‐based CKD‐EPI equation and could not accurately refine the stages of CKD for further analysis. Fourth, due to geographical and resource constraints, it was not feasible to implement central liver biopsy readings, which may have introduced some degree of reading variability or bias. We are planning to achieve a unified pathology center for the review of liver biopsy samples in future studies, thereby strengthening the validity of research outcomes. Finally, although we included data from seven countries, the sample sizes in some of these countries could be too small to accurately reflect the actual data in these groups (particularly in European countries). This disparity might lead to altered conclusions and we will continue to increase the sample size for a subsequent study.
In conclusion, our multinational study is the first to describe the geographical variations of eGFR levels in a large cohort of adults with biopsy‐confirmed MASLD. In this large multinational study, we found that the European population with MASLD had lower eGFR levels and more severe liver fibrosis than the Asian population. China had the highest mean eGFR levels, while Romania had the lowest eGFR levels. eGFR levels were closely associated with the histological severity of liver fibrosis, especially in the Asian population with MASLD. Our findings provide the basis for further investigation of the burden of MASLD on CKD risk in different countries.
Materials and Methods
4
Study Design
4.1
We performed a retrospective multinational cohort study by collecting data from 3775 participants from 34 centers in seven countries who underwent liver biopsy examination due to persistently elevated serum liver enzyme levels or imaging findings of hepatic steatosis. To better elucidate the role of metabolism in the association between MASLD and eGFR, we included only participants with biopsy‐proven MASLD and who did not have any acute kidney injury. As shown in Figure 1, 467 subjects were excluded from the analysis due to the following reasons: (1) alcohol‐related liver disease (n = 394), (2) age < 18 years old (n = 55), (3) missing data on liver fibrosis score (n = 3), (4) missing serum creatinine data (n = 8), (5) unfeasible creatinine results (n = 4), and (6) missing data on metabolic risk factors for the diagnosis of MASLD (n = 3). As a result, 3308 adult participants with biopsy‐confirmed MASLD were included in the final analysis.
Data Collection
4.2
In all participants, we collected clinical data on age, sex, height, body weight, waist circumference, hypertension, diabetes, platelet counts, blood glucose, creatinine, aspartate aminotransferase (AST) and ALT. BMI was calculated by dividing weight by height squared. Obesity was defined as BMI ≥ 30 kg/m^2^ in Europeans, BMI ≥ 28 kg/m^2^ in Asians [40]. eGFR was calculated using the CKD‐epidemiology collaboration (CKD‐EPI) equation, which is as follows: eGFR = 141 × min (Scr/κ,1)^α^ × max (Scr/κ,1)^−1.209^ × 0.993^Age^ × 1.018 [if female], where Scr is serum creatinine, κ is 0.7 for females and 0.9 for males, α is −0.329 for females and −0.411 for males, min indicates the minimum of Scr/κ or 1, and max indicates the maximum of Scr/κ or 1 [41, 42]. Next, we stratified our participants into two groups according to their eGFR levels, i.e., subjects with normal eGFR (≥90 mL/min/1.73 m^2^) and those with declined eGFR (<90 mL/min/1.73 m^2^).
Liver Biopsy Examination
4.3
The NASH Clinical Research Network (NASH CRN) scoring system and the Brunt system were used to assess the histopathological lesions [43, 44]. MASLD was defined by evidence of hepatic steatosis on liver biopsy affecting at least 5% of hepatocytes in combination with at least one of overweight or obesity, T2DM, or evidence of metabolic dysregulation for women who consume <140 g/week of alcohol and for men who consume <210 g/week and have no other known causes of hepatic steatosis. The presence of metabolic dysregulation among lean/normal weight individuals with hepatic steatosis who did not have T2DM was defined by previous study [15]. Significant steatosis, inflammation, ballooning, and fibrosis were histologically defined using a uniform standard with a pathological score ≥2 [15].
Statistical Analysis
4.4
Continuous variables were expressed as means ± standard deviation (SD), and categorical variables were expressed as counts or percentages (%). The one‐way analysis of variance was used for continuous variables, and the chi‐square test was used for categorical variables. Linear and binary logistic regression analyses were used to test the association between eGFR level and liver fibrosis scores on histology after adjusting for confounding variables, such as sex, BMI, waist circumference, serum transaminases, diabetes, and hypertension. The regression coefficients beta (β) and ORs were calculated with 95% CI. When a variable with missing values was included, cases with missing data on that variable were automatically excluded from the analysis. All tests were two‐sided, a p value ≤ 0.05 was considered statistically significant. All statistical analyses were performed using SPSS 22.0 (SPSS, Chicago, IL).
Author Contributions
MHZ, DQS, and JZ were involved in study design and data interpretation and verification. JZ performed data analysis and wrote the manuscript. Data collection was done by FEM, XYX, DJ, HL, XC, JC, TO, TS, YZ, CL, BZ, MY, AN, JS, JZ, SM, WKC, FH, CYY, SL, AD, VdL, MLP, JG, ZL, HT, JJ, PJE, LX, YL, YN, HD, JN, XY, QY, QLZ, YZ, JFLC, CL, JL, LL, JW, FJ, JC, YX, GT, CDB, YF, JHZ, GO, MP, DQS, MHZ. GT, CDB, and MP conducted critical revision and writing of the manuscript. All authors reviewed and commented on the manuscript and approved the final version.
Funding
This work was supported by grants from the National Natural Science Foundation of China (82570853, 82500873, 82370577, 82070588) and supported by China Postdoctoral Science Foundation (2023M732681). Dan‐Qin Sun is supported in part by grants from Top Talent Support Program for young and middle‐aged people of Wuxi Health Committee (BJ2023023) and scientific technological innovation and venture capital fund in Wuxi (Y20232011). GT is supported in part by grants from the School of Medicine, University of Verona, Verona, Italy. CDB is supported in part by the Southampton NIHR Biomedical Research Centre (NIHR203319), UK.
Ethics Statement
This study adhered to the principles of the Helsinki Declaration and the need for informed written consent was waived due to the retrospective nature of the study. This study was approved by the guidelines of the ethics committee of the the First Affiliated Hospital of Wenzhou Medical University (No. 2016‐246).
Conflicts of Interest
WKC has served as a consultant or advisory board member for Roche, Abbvie, Boehringer Ingelheim, and Novo Nordisk; and a speaker for Echosens, Viatris, and Hisky Medical. Victor de Lédinghen has served as a consultant or advisory committee member for Gilead Sciences, Intercept, Alfasigma, Orphalan, and Mindray; and a speaker for AbbVie, Echosens, Gilead Sciences, Hologic, Tillotts, Orphalan, and Janssen. Fanpu Ji reports lecture fees from Gilead Sciences, MSD, and Ascletis and he is a consultant for Gilead and MSD. Others have no conflict of interest. CDB has received grant support from Echosens.
The reference list from the paper itself. Each links out to its DOI / PubMed record.
- 1G. Feng , L. Valenti , V. W. Wong , et al., “Recompensation in Cirrhosis: Unravelling the Evolving Natural History of Nonalcoholic Fatty Liver Disease,” Nature Reviews Gastroenterology & Hepatology 21, no. 1 (2024): 46–56.37798441 10.1038/s 41575-023-00846-4 · doi ↗ · pubmed ↗
- 2G. E. H. Lim , A. Tang , C. H. Ng , et al., “An Observational Data Meta‐analysis on the Differences in Prevalence and Risk Factors between MAFLD vs NAFLD,” Clinical Gastroenterology and Hepatology: the Official Clinical Practice Journal of the American Gastroenterological Association 21, no. 3 (2023): 619–629. e 617.34871813 10.1016/j.cgh.2021.11.038 · doi ↗ · pubmed ↗
- 3L. Miao , G. Targher , C. D. Byrne , Y. Y. Cao , and M. H. Zheng , “Current Status and Future Trends of the Global Burden of MASLD,” Trends in Endocrinology and Metabolism: TEM 35, no. 8 (2024): 697–707.38429161 10.1016/j.tem.2024.02.007 · doi ↗ · pubmed ↗
- 4M. Eslam , A. J. Sanyal , and J. George , “MAFLD: A Consensus‐Driven Proposed Nomenclature for Metabolic Associated Fatty Liver Disease,” Gastroenterology 158, no. 7 (2020): 1999–2014. e 1991.32044314 10.1053/j.gastro.2019.11.312 · doi ↗ · pubmed ↗
- 5A. De , N. Bhagat , M. Mehta , S. Taneja , and A. Duseja , “Metabolic Dysfunction‐associated Steatotic Liver Disease (MASLD) Definition Is Better Than MAFLD Criteria for Lean Patients With NAFLD,” Journal of Hepatology 80, no. 2 (2024): e 61–e 62.37558135 10.1016/j.jhep.2023.07.031 · doi ↗ · pubmed ↗
- 6K. I. Zheng , D. Q. Sun , Y. Jin , P. W. Zhu , and M. H. Zheng , “Clinical Utility of the MAFLD Definition,” Journal of Hepatology 74, no. 4 (2021): 989–991.33347953 10.1016/j.jhep.2020.12.016 · doi ↗ · pubmed ↗
- 7J. Zhou , D.‐Q. Sun , G. Targher , et al., “Metabolic Dysfunction‐associated Fatty Liver Disease Increases Risk of Chronic Kidney Disease: A Systematic Review and Meta‐analysis,” Egastroenterology 1, no. 1 (2023): e 100005.39944252 10.1136/egastro-2023-100005 PMC 11770460 · doi ↗ · pubmed ↗
- 8V. H. Nguyen , M. H. Le , R. C. Cheung , and M. H. Nguyen , “Differential Clinical Characteristics and Mortality Outcomes in Persons with NAFLD and/or MAFLD,” Clinical Gastroenterology and Hepatology: the Official Clinical Practice Journal of the American Gastroenterological Association 19, no. 10 (2021): 2172–2181. e 2176.34033923 10.1016/j.cgh.2021.05.029 · doi ↗ · pubmed ↗