Quality Evaluation of Decoction Pieces of Fagopyri Dibotryis Rhizoma Based on HPLC Fingerprint, Q-TOF-MS/MS, and Chemical Pattern Recognition Qualitative Analysis Combined With Multicomponent Quantitative Analysis
Yi Cao, Meng He, Yaru Feng, Yujia Li, Nan Qin, Zhihua Dou

TL;DR
This study evaluates the quality of Fagopyri Dibotryis Rhizoma decoction pieces from different Chinese provinces using advanced chemical analysis techniques.
Contribution
A comprehensive quality evaluation framework combining HPLC, Q-TOF-MS/MS, and chemical pattern recognition for FDR decoction pieces.
Findings
Decoction pieces from Yunnan and Guizhou show significantly better quality than those from six other provinces.
47 common peaks were identified, with 80 components including tannins, phenols, and flavonoids.
Chemical pattern recognition methods confirmed quality differences between regions.
Abstract
Fagopyri Dibotryis Rhizoma (FDR), the dried rhizome of Fagopyrum dibotrys (D. Don) Hara (F. dibotrys), is a famous herbal drug with a long application history in China. Recently, FDR and its preparations have attracted wide attention due to their therapeutic values for coronavirus disease 2019 (COVID-19) and COVID-19-related acute lung injury. There is a significant difference in quality among FDRs from different habitats, which can seriously affect the clinical efficacy. The original medicinal materials can only be used in the clinic after being processed into decoction pieces, but there is currently a lack of comprehensive quality evaluation of FDR decoction pieces prepared using FDRs from different origins. In this study, the HPLC fingerprints of 23 batches of FDR decoction pieces prepared using FDRs from 8 provinces such as Yunnan and Guizhou in China were established; 47 common…
Genes, proteins, chemicals, diseases, species, mutations and cell lines named across the full text — each resolved to its canonical identifier and authoritative record.
Click any figure to enlarge with its caption.
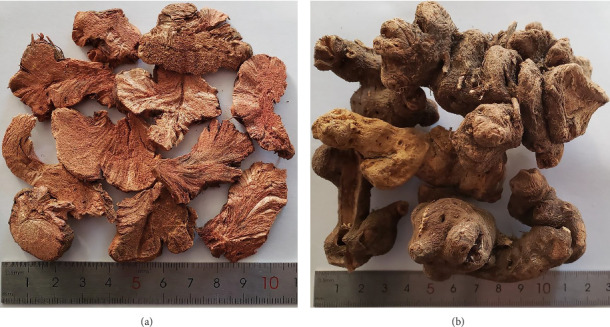 Figure 1
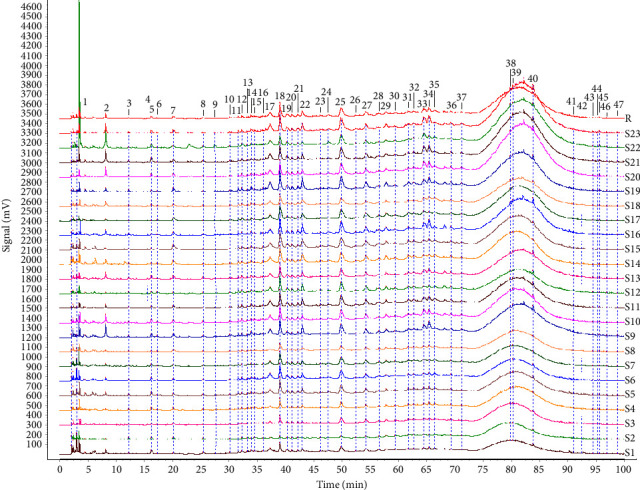 Figure 2
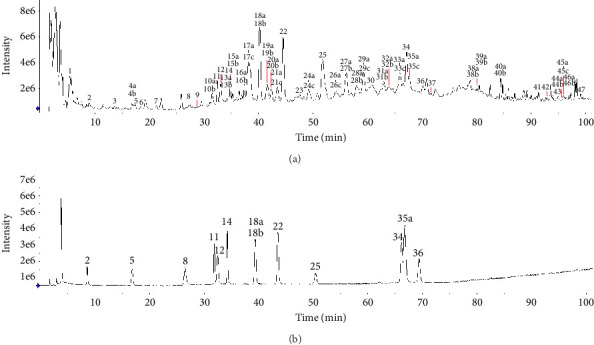 Figure 3
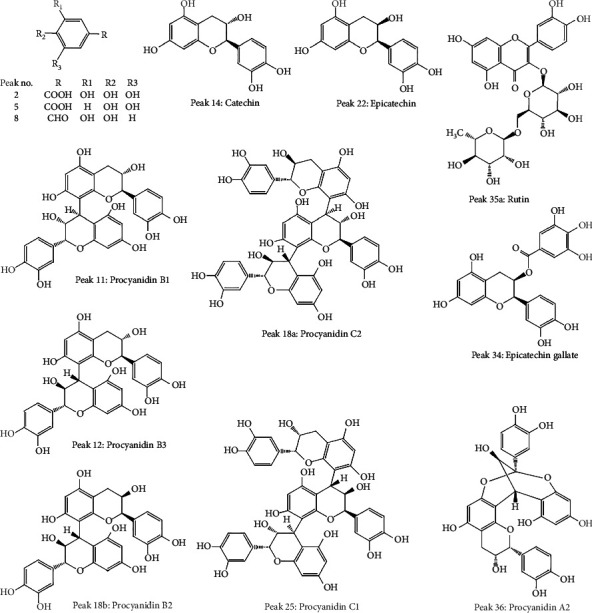 Figure 4
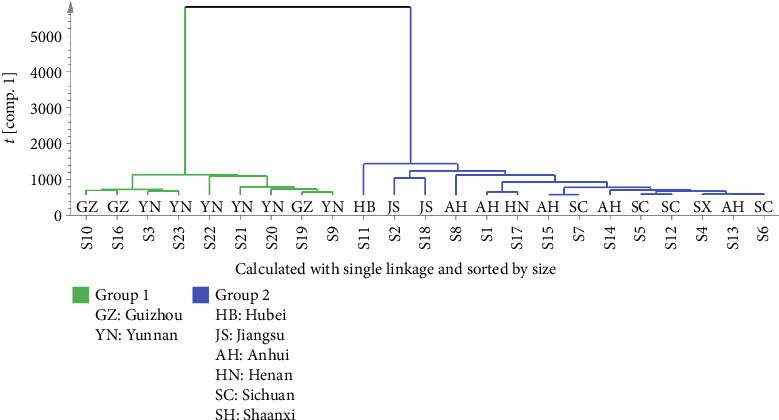 Figure 5
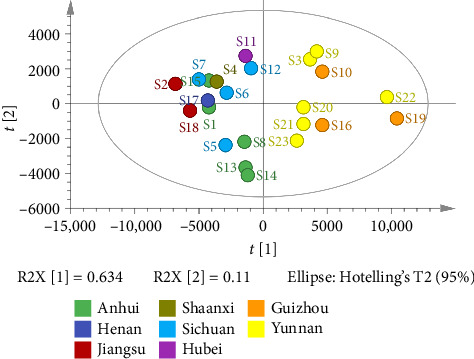 Figure 6
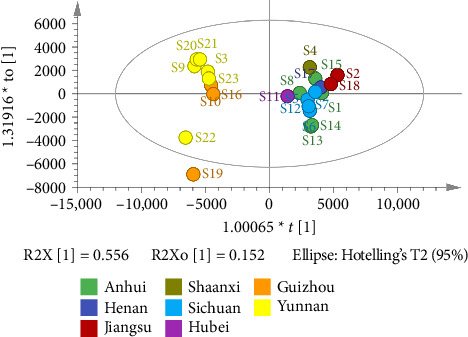 Figure 7
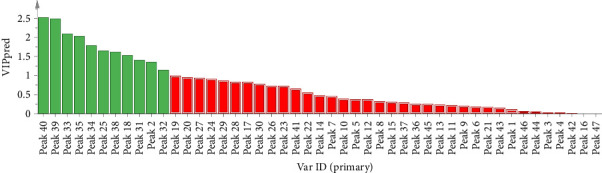 Figure 8
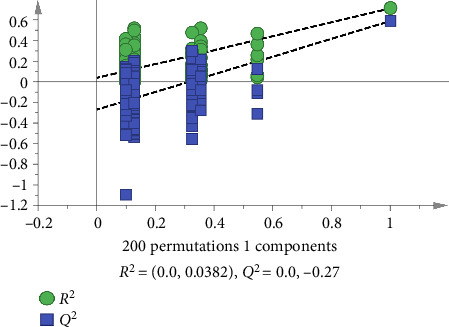 Figure 9
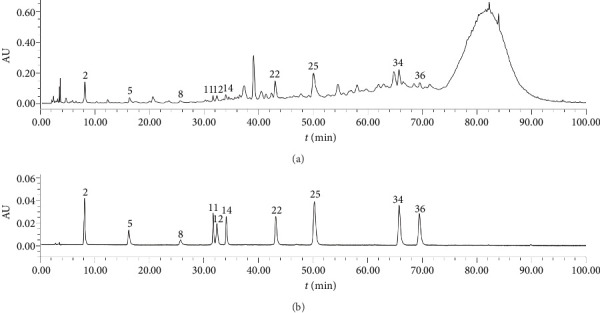 Figure 10
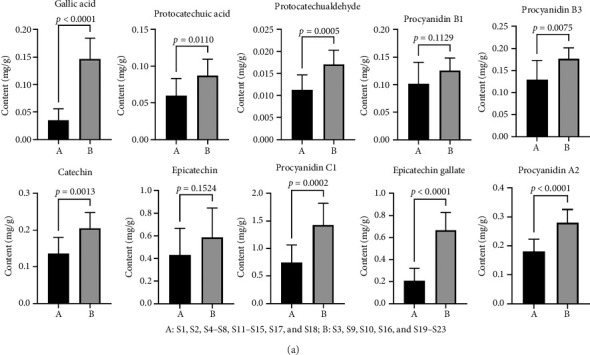 Figure 11
- —Key Science and Technology Plan Projects for Society and Livelihood of Nantong, Jiangsu Province, China
- —Jiangsu Pharmaceutical Association
- —Research Project of Nantong Municipal Health Commission, Jiangsu Province, China
Peer Reviews
No public reviews on file for this paper yet. If you reviewed it on a platform where reviews are public (OpenReview, ICLR, NeurIPS, ICML), you can paste yours below so the community can read it here.
Videos
No videos yet. Explain this paper in a talk, walkthrough, or lecture? Add one.
Taxonomy
TopicsSeed and Plant Biochemistry · Biochemical and Structural Characterization · Medicinal Plants and Neuroprotection
1. Introduction
Fagopyri Dibotryis Rhizoma (FDR), the dried rhizome of Fagopyrum dibotrys (D. Don) Hara (F. dibotrys) belonging to the family Polygonaceae and genus Fagopyrum [1, 2], is a famous herbal drug with a long application history in China [3, 4]. Some experimental results indicate that FDR has a variety of pharmacological activities, such as antioxidant, anti-inflammatory, antibacterial, antiviral, anticancer, antidiabetes, and immunoregulation activities [3, 4]. In clinical practice, FDR and its preparations, namely, FDR capsules, FDR tablets, and Wei Mai Ning capsules have been used to treat many lung diseases such as lung abscess and lung cancer and intestinal diseases such as ulcerative colitis [3–5]. Recently, FDR and its preparations have attracted wide attention due to their therapeutic values for coronavirus disease 2019 (COVID-19) and COVID-19-related acute lung injury [6–8]. Zhang et al. used the computer model to screen 26 Chinese herbal medicines with the most components that can directly inhibit COVID-19 virus, and FDR is one of these medicines [9].
F. dibotrys is native to southwest China and is mainly distributed in the southern region of the Yellow River (97°–121° E; 21°–32° N), including Yunnan, Guizhou, Sichuan, Anhui, Jiangsu, Hubei, Henan, and Shaanxi [10]. The components contained in FDR include tannins, phenolics, flavonoids, phenylpropanoid glycosides (PGs), organic acids, terpenoids, and amino acids [3–6, 11, 12], of which, the tannins, flavonoids, and phenolics are considered to be the main active components of FDR [3, 4]. The contents of the components in F. dibotrys grown in different ecological environments vary greatly, resulting in the uneven quality of FDRs from different origins in the market, which seriously affect the clinical efficacy [10]. Wu et al. determined the contents of 24 components in FDRs from Yunnan, Guizhou, Sichuan, Hubei, and Jiangsu provinces in China and conducted chemical pattern recognition analysis using the contents of these 24 components as variables. The results showed that there is a significant difference in quality among FDRs from different habitats, and the quality of FDR from Yunnan is most superior [13]. However, the original medicinal materials can only be used in clinical practice after being processed into decoction pieces [14]. Decoction pieces of FDR (Figure 1(a)) are the products of the original medicinal materials of FDRs (Figure 1(b)) after being washed, moistened, cut into thick pieces, and dried [1]. To the best of our knowledge, there is currently no literature on the comprehensive quality evaluation of FDR decoction pieces prepared using FDRs from different origins. Our research team has previously established a method for comprehensively evaluating the quality of herbal drugs based on HPLC fingerprint, Q-TOF-MS/MS, and chemical pattern recognition qualitative analysis combined with multicomponent quantitative analysis [15]. In this study, we used this method to evaluate the qualities of 23 batches of FDR decoction pieces prepared using FDRs from Yunnan, Guizhou, Sichuan, Jiangsu, Anhui, Hubei, Henan, and Shaanxi provinces in China, aiming to provide a reference for rational drug use in clinical practice.
2. Experimental
2.1. Chemicals and Reagents
Reference substances gallic acid (purity ≥ 91.5%), protocatechuic acid (purity ≥ 97.5%), protocatechualdehyde (purity ≥ 99.9%), epicatechin gallate (purity ≥ 98.1%), and rutin (purity ≥ 91.6%) were purchased from the National Institutes for Food and Drug Control (Beijing, China). Procyanidin B1 (purity 98.0%), procyanidin B3 (purity 98.0%), catechin (purity 98.0%), procyanidin B2 (purity 98.0%), epicatechin (purity 98.0%), procyanidin C1 (purity 98.0%), and procyanidin A2 (purity 98.0%) were purchased from Nanjing Guangrun Biological Products Co., Ltd. (Nanjing, China). Procyanidin C2 (purity ≥ 98.9%) was purchased from Sichuan Weikeqi Biotechnology Co., Ltd. (Chengdu, China). LC/MS-grade acetonitrile and HPLC-grade methanol were provided by Fisher Scientific (Fair Lawn, NJ, USA). HPLC-grade formic acid was purchased from Sinopharm Chemical Reagent Co., Ltd. (Shanghai, China). Purified water was provided by Wahaha Group Co., Ltd. (Hangzhou, China).
2.2. Samples and Sample Solutions Preparation
A total of 23 batches of FDR decoction pieces were purchased from the production enterprises of herbal pieces, and the information of 23 samples is shown in Table 1.
FDR decoction pieces were pulverized before use. Two g of sample powder was weighted and put into a 50 mL volumetric flask, 50 mL of 50% (v/v) ethanol was added to the mark of the volumetric flask, and the mixture was extracted (53 kHz, 200 W) in ultrasonic cleaner for 30 min and finally ultrasonicated (53 kHz, 200 W) for 30 min. After being cooled, the extracts were filtered and the filtrates were concentrated under reduced pressure at 50–70°C until near dryness. The residues were washed with 10% (v/v) acetonitrile in batches. The washing solution was then put into a 10-mL volumetric flask and diluted to the mark with 10% (v/v) acetonitrile. The mixture was centrifuged at 3000 rpm for 5 min after being shaken well. The supernatant was collected, filtered with a 0.22-μm microporous membrane, and the resulting filtrate was used as the sample solution.
2.3. Reference Substance Solutions Preparation
An appropriate dose of each reference substance mentioned in Section 2.1 was weighed precisely and put into the same volumetric flask, dissolved, and diluted with 50% (v/v) ethanol, and the mixed reference substance solution containing 13 components with a concentration of about 40 μg/mL was prepared for identifying the common peaks.
Appropriate doses of 10 reference substances were weighed precisely, dissolved, and diluted with 50% (v/v) ethanol to make 10 stock solutions of gallic acid, protocatechuic acid, protocatechualdehyde, procyanidin B1, procyanidin B3, catechin, epicatechin, procyanidin C1, epicatechin gallate, and procyanidin A2, respectively.
Appropriate volumes of the stock solutions of 10 reference substances were precisely taken and mixed, and then diluted with 50% (v/v) ethanol to make the working solution A for content determination; the concentrations of above 10 reference substances were 102.025, 86.275, 12.525, 300.4, 315.6, 277.48, 397.28, 1047, 427.92, and 618 μg/mL, respectively. 50% (v/v) ethanol was used to dilute the working solution A by 2, 5, 10, 20, and 50 times to make the working solutions B–F, respectively.
2.4. Detection of HPLC Fingerprint and the Contents of 10 Components
The HPLC fingerprints of 23 batches of FDR decoction pieces and the contents of 10 components, including 4 tannins such as procyanidin B1, procyanidin B3, procyanidin C1, and procyanidin A2, 3 phenolics such as gallic acid, protocatechuic acid, and protocatechualdehyde, and 3 flavonoids such as catechin, epicatechin, and epicatechin gallate, were detected in 23 samples using a Waters Alliance HPLC system (consisting of an e2695 separation unit, a 2998 PDA detector, and an Empower 3 data processing system, Waters Corp., USA) and a Symmetry C_18_ column (4.6× 250 mm, 5 μm, Waters Corp., USA). The injection volume was 30 μL. The mobile phase consisted of acetonitrile (A) and 0.1% (v/v) formic acid (B), and the gradient program was as follows: 0–10 min, 2%–4% A; 10–20 min, 4% A; 20–30 min, 4%–10% A; 30–50 min, 10%–12% A; 50–60 min, 12%–15% A; 60–70 min, 15%–16% A; 70–100 min, and 16%–50% A. The flow rate was set at 1.0 mL/min, the column temperature was maintained at 30°C, and the detection wavelength was 280 nm.
2.5. Validating the HPLC Method for Fingerprint Analysis
The precision, stability, and repeatability tests were performed to validate the HPLC method for detecting fingerprints, in which, peak 25 (procyanidin C1) was taken as the reference peak, and the relative standard deviation (RSD) of relative peak area (RPA) and the mean relative retention time (RRT) of 21 common peaks were measured. Sample solution 20 was injected 6 times continuously within a day for precision assessment and was then injected, respectively, at 0, 6, 9, 12, 18, and 36 h after being prepared for stability assessment. Six sample solutions were made from S20 in parallel for repeatability assessment.
2.6. Establishing HPLC Fingerprints and Identifying Common Peaks
The chromatographic data of 23 batches of FDR decoction pieces were imported into the Similarity Evaluation System for Chromatographic Fingerprint of TCM (2012 edition, Chinese Pharmacopoeia Commission, China). The chromatogram of S23 was taken as a reference chromatogram, and common peaks in this reference chromatogram were marked.
The components of common peaks were identified using an UFLC-Q-TOF-MS/MS (consisting of an SIL-20AC XR autosampler, a LC-20AD XR quaternary pump, and an SPD-M20A DAD detector, Shimadzu, Japan) system. The same chromatographic column, mobile phases, and gradient conditions as described in Section 2.4 were used to separate the components and then a Triple TOF 4600 system (AB Sciex, USA) was used for obtaining mass spectra in negative ion mode with the DuoSpray Ion source. The mass spectrometric parameters were set as follows: ion spray voltage floating (ISVF) 4500 V, source temperature (TEM) 500°C, curtain gas (CUR) 35 psi, nebulizer gas (Gas 1) 60 psi, and heater gas (Gas 2) 60 psi. The mass spectrometry data were obtained using the TOFMS-IDA-10MS/MS method based on the following relevant parameters: collision energy (CE) −10 eV; decluster potential (DP) −80 V, accumulation time 250 ms, mass range for detecting TOF-MS 115–1500 Da, CE −35 eV, collision energy spread (CES) 15 eV, DP −80 eV, accumulation time 100 ms, and mass range for detecting TOF-MS/MS 50–1500 Da. PeakView 1.6 mass spectrometry analysis software (AB Sciex, USA) was used for analyzing the LC–MS/MS data.
2.7. Chemical Pattern Recognition Analysis
The precise amounts of samples in the injected solution were used to quantify the peak areas of 47 common peaks in HPLC fingerprints and then the quantified peak areas were taken as variables to perform hierarchical cluster analysis (HCA), principal component analysis (PCA), and orthogonal partial least squares discriminant analysis (OPLS-DA).
2.8. Validating the Method for Content Determination
The method for content determination was validated through detecting the linear relationship, limit of detection (LOD), limit of quantitation (LOQ), precision, stability, repeatability, and recovery of the 10 components mentioned in Section 2.4, respectively. Accurately 30-μL solution from each of working solutions A, B, C, D, E, and F was injected, respectively, into the HPLC system to calculate the calibration curves, correlation coefficients, and linear ranges of 10 components to detect linear relationship. Various concentrations of the reference substance solutions were prepared by successive dilutions of working solution F with 50% (v/v) ethanol. The signal-to-noise ratios of 3:1 and 10:1 were used, and 10-μL solution from each of various concentrations of reference substance solutions was injected, respectively, to determine the values of LOQ and LOD. The RSDs of the peak areas of the 10 components were measured to perform intraday and interday precision tests and sample stability test, respectively. The intraday precision was detected by 6 consecutive injections of 30-μL working solution C, and the interday precision was detected by injections of 30-μL working solution C twice daily for 3 consecutive days. The peak areas of 10 components detected in stability test in Section 2.5 were analyzed for stability assessment. The concentrations of 10 components were calculated based on the peak areas of these 10 components measured in repeatability test in Section 2.5, and the RSDs of the concentrations were detected for repeatability assessment. The recovery test involved precise weighing of 1 g of S20 powder and addition of 10 reference substance stock solutions prepared in Section 2.3 to the sample with a specific volume based on the approximate ratio of sample content to reference substance (1:1), and 6 sample solutions were prepared in parallel. These 6 sample solutions were injected into the HPLC system to calculate the mean recovery rates and RSDs of 10 components.
The methods employed in this study were in line with those proposed by the authors of reference literatures [14, 15].
3. Results and Discussion
3.1. Validating the Method for HPLC Fingerprint Analysis
The RSDs of RPA and RRT for precision were below 4.48% and 0.33%, respectively, those for stability were not greater than 4.97% and 0.44%, respectively, and those for repeatability were ≤ 4.96% and 0.72%, respectively. This finding conformed to national standards for TCM fingerprinting [14, 15].
3.2. Establishing the HPLC Fingerprints and Identifying the Common Peaks
The chromatograms in Figure 2 showed that 47 common peaks were marked in the HPLC fingerprint of 23 batches of FDR decoction pieces. The identification process of the components of the common peaks was as follows. First, the total ion chromatograms of the samples and mixed reference substances (Figure 3) were extracted by a mass spectrometry analysis software (PeakView 1.6). Second, the analysis of the mass spectral data of the reference substances and the summarization of the dissociative rules of the reference substances revealed that the quasimolecular ion [M-H]^−^ or [M+Cl]^−^ or 1/2[M-2H]^2−^ could be selected as the precursor ion to produce MS/MS product ions. Finally, the components of the 47 common peaks were identified by comparison of the retention time, m/z of [M-H]^−^ or [M+Cl]^−^ or 1/2[M-2H]^2−^, and MS/MS fragmentation patterns with those of the reference substances or previous literature reports, in combination with online retrieval of the compound database of PubChem (https://pubchem.ncbi.nlm.nih.gov). As shown in Table 2 and Figure 3, 80 components were identified in 47 common peaks of the HPLC fingerprints of FDR decoction pieces, including 32 tannins, 17 phenolics, 12 flavonoids, 11 PGs, 3 amino acids, 2 organic acids, 1 terpenoid, 1 alkaloid, and 1 other component. Among them, 13 components were confirmed by comparison of the mass spectrometry data of them with those of the reference substances, containing 6 tannins such as procyanidin B1, procyanidin B3, procyanidin C2, procyanidin B2, procyanidin C1, and procyanidin A2, 3 phenolics such as gallic acid, protocatechuic acid, and protocatechualdehyde, 4 flavonoids such as catechin, epicatechin, epicatechin gallate, and rutin, which were shown as Peaks 11, 12, 18a, 18b, 25, 36, 2, 5, 8, 14, 22, 34, and 35a, respectively. The structures of these 13 components were depicted in Figure 4.
3.3. Chemical Pattern Recognition Analysis
The quantified peak areas of 47 common peaks of 23 batches of samples were used as variables to perform HCA, PCA, and OPLS-DA.
HCA is an unsupervised pattern recognition method, which is commonly used to classify samples into different groups based on the characteristics of variables and determine the degree of similarity between the samples [15, 20]. In the present study, the quantified peak areas of 47 common peaks of 23 batches of FDR decoction pieces were introduced into SIMCA14.1 (Umetrics, Sweden) to perform HCA. The results (Figure 5) show that 23 batches of FDR decoction pieces were classified into two groups: S3, S9, S10, S16, and S19–S23 (FDRs from Yunnan and Guizhou province) were clustered into one group, S1, S2, S4–S8, S11–S15, S17, and S18 (FDRs from 6 other provinces) were clustered into another group; it was indicated that there was a significant difference in quality between FDR decoction pieces prepared using FDRs from Yunnan and Guizhou provinces and those prepared using FDRs from 6 other provinces.
The unsupervised pattern recognition PCA does not require prior knowledge of the datasets, which effectively amplifies the difference and facilitates the sorting of factors [15]. The PCA score plot was utilized for the purpose of detecting the difference among the samples [15, 21]. In this study, the quantified peak areas of 47 common peaks of 23 batches of FDR decoction pieces were introduced into SIMCA14.1 to generate the score plot in Figure 6. As presented in Figure 6, the first two principal components (PCs) explained 74.4% (PC1, 63.4% and PC2, 11.0%) of the total variation, and S3, S9, S10, S16, and S19–S23 (FDRs from Yunnan and Guizhou province) could be distinguished clearly from S1, S2, S4–S8, S11–S15, S17, and S18 (FDRs from 6 other provinces). This finding was consistent with that of HCA, suggesting that there was an obvious difference in quality between FDR decoction pieces prepared using FDRs from Yunnan and Guizhou provinces and those prepared using FDRs from 6 other provinces.
The OPLS-DA model for supervised chemical pattern recognition is designed to optimize classification and identify the potential markers of variation in samples [15]. In this study, the OPLS-DA model was established by SIMCA14.1 software using the quantified peak areas of 47 common peaks of 23 batches of FDR decoction pieces as variables. The values of RXcum^2^, RYcum^2^, and Qcum^2^ were 0.884, 0.376, and 0.191 accordingly, suggesting that the abovementioned model had good fitting and predictive ability [15]. The score plot in Figure 7 revealed that S3, S9, S10, S16, and S19–S23 (FDRs from Yunnan and Guizhou provinces) and S1, S2, S4–S8, S11–S15, S17, and S18 (FDRs from 6 other provinces) were located in two different regions; the findings were consistent with those of the HCA and PCA. The contribution of the variable to group classification was assessed using the variable importance in the projection (VIP). A higher VIP indicated that the variable had a greater effect on classification. Variables with VIP > 1 was mainly used for sample discrimination [15]. VIP plot in Figure 8 revealed that 11 common peaks with VIP > 1 were identified, including peak 40 (6-acetyl-3′,6′-di-p-coumaroylsucrose and N-trans-feruloyltramine), 39 (procyanidin B4-3′-O-gallate and taxifolin 3-O-β-D-xyloside), 33 (ellagic acid, 3,3′-digalloylprocyanidin B2, and arecatannin A1 3,3′-digallate), 35 (rutin, isocinnamtannin A2, and catechin-(4β ⟶ 8)-catechin-(4β ⟶ 8)-epicatechin), 34 (epicatechin gallate), 25 (procyanidin C1), 38 (tricin 4′-O-(erythro-β-guaiacylglyceryl) ether 7-O-glucoside and 1-p-coumaroyl-6-feruloyl-sucrose), 18 (procyanidin C2 and procyanidin B2), 31 (taxifolin-3-glucoside and isolariciresinol 9′-O-glucoside), 2 (gallic acid), and 32 (epicatechin 5-glucoside and taxifolin), indicating that these 21 components were the markers for discriminating between FDR decoction pieces prepared using FDRs from Yunnan and Guizhou provinces and those prepared using FDRs from 6 other provinces. A total of 200 permutation tests were conducted to determine the validity of the OPLS-DA model, and the vertical intercept values of R^2^ and Q^2^ were 0.0382 and −0.27, respectively (Figure 9); this indicated that the established model addressed the issue of overfitting and had a good predictive effect [15, 20].
3.4. Validating Method for Content Determination
Table 3 shows that a higher correlation coefficient value (R^2^ > 0.9998) exhibited excellent linearity over a broad range of injected amounts. Table 4 shows that all RSDs of the intraday and interday precision, stability, and repeatability were below 5%, the mean recovery rate ranged from 97.36% to 101.76%, and RSD ranged from 0.75% to 1.89%. The abovementioned findings satisfied the requirements of analytical method for drug quality standard specified in Chinese Pharmacopoeia [1].
3.5. Content Determination of 10 Components in 23 Batches of FDR Decoction Pieces
The chromatograms of the samples and mixed reference substances are shown in Figure 10, and the content determination results of 10 components in 23 batches of FDR decoction pieces are shown in Table 5. Table 5 revealed that there existed differences in the contents of 10 components among different samples. GraphPad Prism 9 (GraphPad Software Inc. USA) was applied to comparatively analyze the contents of 10 components between 9 batches of FDR decoction pieces (S3, S9, S10, S16, and S19–S23) and 14 batches of FDR decoction pieces (S1, S2, S4–S8, S11–S15, S17, and S18). Figure 11 shows that, except for procyanidin B1 and epicatechin, the average contents of other 8 components in S3, S9, S10, S16, and S19–S23 were significantly higher than those in S1, S2, S4–S8, S11–S15, S17, and S18 (p < 0.01 or p < 0.05), indicating that the qualities of FDR decoction pieces prepared using FDRs from Yunnan and Guizhou provinces are significantly better than those prepared using FDRs from 6 other provinces. The contents of components in F. dibotrys are different when the growing locations are different [13, 22]. F. dibotrys growing in the high-altitude area of the Yunnan–Guizhou Plateau accumulates more secondary metabolites such as flavonoids and tannins than those growing in the low altitude area, which may be due to the protection of plants from strong ultraviolet radiation and other environmental stresses [2, 23].
SPSS 25 statistical software was used to perform bivariate correlation analyses between the content of one component and the contents of the other 9 components in 23 batches of FDR decoction pieces one by one. The results, presented in Tables 6 and 7, indicate that the contents of procyanidin B3 and catechin exhibit strong correlations with the contents of the other 9 components (p < 0.01 or p < 0.05), respectively. This finding suggests that only the content of procyanidin B3 or catechin can be detected to estimate the contents of the other 9 components in the future. This approach simplifies the detection process and also saves reference substances.
4. Conclusion
In order to provide a reference for rational drug use in clinical practice, this study evaluates the quality of 23 batches of FDR decoction pieces prepared using FDR from Yunnan, Guizhou, Sichuan, Jiangsu, Anhui, Hubei, Henan, and Shaanxi provinces in China by using the method of HPLC fingerprint, Q-TOF-MS/MS and chemical pattern recognition (HCA, PCA, and OPLS-DA) qualitative analysis combined with 10 components (4 tannins such as procyanidin B1, procyanidin B3, procyanidin C1, and procyanidin A2, 3 phenolics such as gallic acid, protocatechuic acid, and protocatechualdehyde, and 3 flavonoids such as catechin, epicatechin, and epicatechin gallate) quantitative analysis. The results show that there are 47 common peaks in the HPLC fingerprints of 23 samples, and 80 components are identified in these 47 common peaks, including 32 tannins, 17 phenolics, 12 flavonoids, 11 PGs, 3 amino acids, 2 organic acids, 1 terpenoid, 1 alkaloid, and 1 other component. FDR decoction pieces prepared using FDRs from Yunnan and Guizhou provinces can be distinguished clearly from those prepared using FDRs from 6 other provinces by HCA, PCA, and OPLS-DA. Except for procyanidin B1 and epicatechin, the average contents of the other 8 components in the decoction pieces prepared using FDRs from Yunnan and Guizhou provinces are significantly higher than those prepared using FDRs from 6 other provinces (p < 0.01 or p < 0.05). In summary, the qualities of the decoction pieces prepared using FDRs from Yunnan and Guizhou provinces are significantly better than those prepared using FDRs from 6 other provinces.
The reference list from the paper itself. Each links out to its DOI / PubMed record.
- 1Chinese Pharmacopoeia Commission Chinese Pharmacopoeia 2020 China Medical Science Press
- 2Zheng S. H. Diao Y. C. Du J. Genomics and Resequencing of Fagopyrum Dibotrys from Different Geographic Regions Reveals Species Evolution and Genetic Diversity Frontiers in Plant Science 20241510.3389/fpls.2024.1380157 PMC 1119678638919820 · doi ↗ · pubmed ↗
- 3Zhang L. L. He Y. Sheng F. Y. Towards a Better Understanding of Fagopyrum Dibotrys: a Systematic Review Chinese Medicine 202116110.1186/s 13020-021-00498-z PMC 844752834530893 · doi ↗ · pubmed ↗
- 4Geng Q. Liu B. Cao Z. W. Ethnobotany, Phytochemistry and Pharmacological Properties of Fagopyri Dibotryis Rhizoma: A Review Frontiers in Pharmacology 20231410.3389/fphar.2023.1095554 PMC 1002531536950009 · doi ↗ · pubmed ↗
- 5Zhu J. H. Wang L. Xu H. T. Ma Z. X. Tao J. H. Fagopyrum cymosum Alleviates DSS-Induced Colitis via Ameliorating Intestinal Barrier Function and Remolding Gut Microbiota Journal of Functional Foods 202411210.1016/j.jff.2023.105996 · doi ↗
- 6Hu Y. F. Liu X. M. Song Y. Exploring the Anti-inflammatory Ingredients and Potential of Golden Buckwheat (Fagopyrum Dibotrys) on the TLR 4/NLRP 3 Pathway in Acute Lung Injury Food Science and Nutrition 20241285426544110.1002/fsn 3.419339139945 PMC 11317744 · doi ↗ · pubmed ↗
- 7Wang X. J. Jiao Y. K. Zhu H. Y. Lu Y. Chen D. F. Exploring the Anticomplement Components from Fagopyrum Dibotrys for the Treatment of H 1N 1-induced Acute Lung Injury by UPLC-Triple-TOF-MS/MS Journal of Pharmaceutical and Biomedical Analysis 202322310.1016/j.jpba.2022.11515836410130 · doi ↗ · pubmed ↗
- 8Zhang M. Zhang X. K. Pei J. Identification of Phytochemical Compounds of Fagopyrum Dibotrys and Their Targets by Metabolomics, Network Pharmacology and Molecular Docking Studies Heliyon 20239310.1016/j.heliyon.2023.e 14029 PMC 997710836911881 · doi ↗ · pubmed ↗