National Variation in the Use of Multiple Arterial Grafting in Isolated Coronary Artery Bypass Grafting in the United Kingdom
Jeremy Chan, Maria Comanici, Tim Dong, Pradeep Narayan, Daniel P Fudulu, Gianni D Angelini

TL;DR
This study shows that the use of multiple arterial grafts in heart surgery varies widely among surgeons and hospitals in the UK, with no clear link to patient outcomes.
Contribution
The study reveals significant surgeon- and hospital-level variation in MAG use, independent of patient risk profiles.
Findings
MAG use ranged from 0% to 43.79% across UK hospitals.
Younger, male patients with fewer comorbidities were more likely to receive MAG.
MAG did not increase early in-hospital complications compared to single grafts.
Abstract
The last 2 decades have seen a reduction in the use of multiple arterial grafting (MAG) worldwide. The increase in risk profile in patients undergoing coronary artery bypass grafting (CABG) has been suggested as a cause for this limited use. This study aims to evaluate national variation at the surgeon and hospital level in the use of MAG while considering patients’ risk profiles. All patients who underwent first-time, elective/urgent, isolated CABG in the United Kingdom from 2010 to 2019 were included from the national adult cardiac surgery database. MAG was defined as the use of 2 or more arterial grafts. A 3-level multilevel logistic regression models (level 1: patients, level 2: surgeons, and level 3: hospitals) were used to estimate the variation in the use of MAG at each level. Forty hospitals were identified, in which the MAG use ranged from 0% to 43.79%. A total of 135 978…
Genes, proteins, chemicals, diseases, species, mutations and cell lines named across the full text — each resolved to its canonical identifier and authoritative record.
Click any figure to enlarge with its caption.
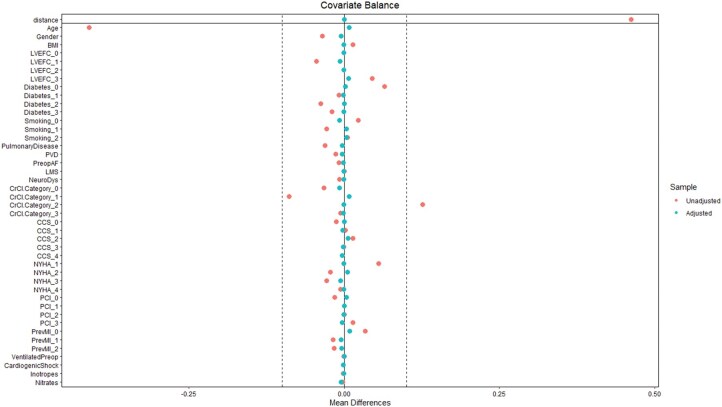 Figure 1
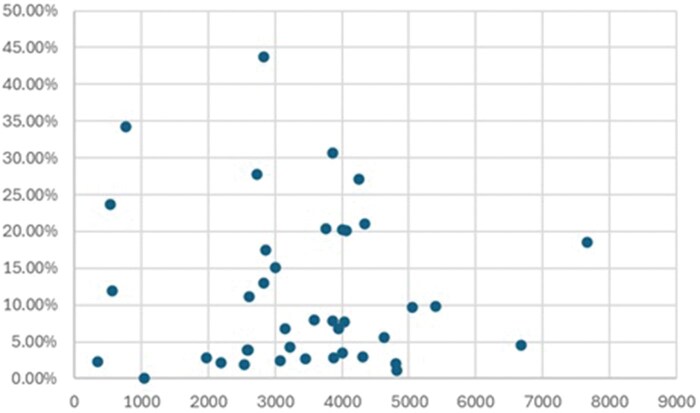 Figure 2
| Pre-operative characteristics | |||||||
|---|---|---|---|---|---|---|---|
| SAG ( | MAG ( |
| PSM—SAG ( | PSM—MAG ( | SMD |
| |
| Age (Year) | 68 (60.8, 74.4) | 63 (55.2, 70.7) | <.001 | 63 (55.2, 70.6) | 63.1 (55.3, 70.7) | 0.0079 | .54 |
| Gender (Male) | 99 249 (82%) | 13 128 (86%) | <.001 | 13 046 (85%) | 13 114 (86%) | 0.0127 | .27 |
| BMI | 28.5(25.7, 31.4) | 28.4 (25.7, 31.3) | .22 | 28.7 (25.8, 31) | 28.4 (25.7, 31.3) | −0.0007 | .24 |
| CCS grade | <.001 | .79 | |||||
| 0 | 12 032 (10%) | 1339 (8.7%) | 1336 (8.7%) | 1338 (8.7%) | 0.0005 | ||
| 1 | 10 779 (8.9%) | 1400 (9.1%) | 1425 (9.3%) | 1397 (9.1%) | −0.0064 | ||
| 2 | 46 001 (38%) | 6057 (40%) | 5952 (39%) | 6050 (40%) | 0.0131 | ||
| 3 | 36 343 (30%) | 4598 (30%) | 4622 (30%) | 4595 (30%) | −0.0039 | ||
| 4 | 15 513 (13%) | 1916 (13%) | 1957 (13%) | 1912 (13%) | −0.0089 | ||
| NYHA status | <.001 | .57 | |||||
| 1 | 33 163 (27%) | 5065 (33%) | 5052 (33%) | 5051 (33%) | −0.0001 | ||
| 2 | 60 099 (50%) | 7283 (48%) | 7191 (47%) | 7281 (48%) | 0.0118 | ||
| 3 | 24 352 (20%) | 2665 (17%) | 2752 (18%) | 2664 (17%) | −0.0152 | ||
| 4 | 3054 (2.5%) | 297 (1.9%) | 297 (1.9%) | 296 (1.9%) | −0.0005 | ||
| PreopAF | 4155 (3.4%) | 395 (2.6%) | <.001 | 417 (2.7%) | 395 (2.6%) | −0.0273 | .43 |
| Previous MI | .15 | ||||||
| No | 58 687 (49%) | 7968 (52%) | 7821 (51%) | 7959 (52%) | 0.5114 | ||
| 1 | 52 834 (44%) | 6427 (42%) | 6491 (42%) | 6418 (42%) | −0.4245 | ||
| 2 or more | 9147 (7.6%) | 915 (6%) | 980 (6.4%) | 915 (6%) | −0.0641 | ||
| Previous PCI | <.001 | .85 | |||||
| 0 | 102 823 (85%) | 12 819 (84%) | 12 755 (83%) | 12 807 (84%) | 0.8341 | ||
| 1 | 385 (0.3%) | 54 (0.4%) | 53 (0.3%) | 54 (0.4%) | 0.0035 | ||
| 2 | 1637 (1.4%) | 211 (1.4%) | 220 (1.4%) | 209 (1.4%) | −0.0144 | ||
| 3 or more | 15 823 (13%) | 2226 (15%) | 2264 (15%) | 2222 (15%) | −0.1481 | ||
| LVEF | <.001 | .52 | |||||
| Good (>50%) | 82 844 (69%) | 11 502 (75%) | 11 567 (76%) | 11 678 (76%) | 0.0006 | ||
| Moderate (31%-50%) | 22 414 (19%) | 2270 (15%) | 3158 (21%) | 2060 (13%) | −0.0365 | ||
| Poor (21%-30%) | 10 110 (8.4%) | 988 (6.5%) | 558 (3.6%) | 546 (3.6%) | −0.2065 | ||
| Very poor (≤20%) | 5300 (4.4%) | 550 (3.6%) | 9 (<0.001%) | 8 (<0.001%) | −0.7564 | ||
| Diabetes | <.001 | .89 | |||||
| No | 82 844 (69%) | 11 502 (75%) | 11 453 (75%) | 11 484 (75%) | 0.749 | ||
| Diet control | 5300 (4.4%) | 550 (3.6%) | 575 (3.8%) | 550 (3.6%) | −0.0376 | ||
| Drug control | 22 414 (19%) | 2270 (15%) | 2268 (15%) | 2270 (15%) | 0.1483 | ||
| Insulin | 10 110 (8.4%) | 988 (6.5%) | 996 (6.5%) | 988 (6.5%) | −0.0651 | ||
| Smoking | <.001 | .38 | |||||
| Non smoker | 42 251 (35%) | 5709 (37%) | 5806 (38%) | 5697 (37%) | −0.3797 | ||
| Ex-smoker | 63 072 (52%) | 7569 (49%) | 7509 (49%) | 7564 (49%) | 0.491 | ||
| Current smoker | 15 345 (13%) | 2032 (13%) | 1977 (13%) | 2031 (13%) | 0.1293 | ||
| Pulmonary disease | 14 458 (12%) | 1366 (8.9%) | 1416 (9.3%) | 1365 (8.9%) | −0.0926 | .31 | |
| NeuroDys | 3070 (2.5%) | 278 (1.8%) | <.001 | 279 (1.8%) | 278 (1.8%) | −0.0182 | .97 |
| Peripheral vascular disease | 14 795 (12%) | 1674 (11%) | <.001 | 1713 (11%) | 1672 (11%) | −0.112 | .45 |
| Renal function | <.001 | .2 | |||||
| Normal | 69 789 (58%) | 10 792 (70%) | 10 776 (70%) | 10 774 (70%) | −0.0704 | ||
| Mildly impaired | 41 774 (35%) | 3949 (26%) | 3823 (25%) | 3949 (26%) | 0.25 | ||
| Moderately impaired | 8104 (6.7%) | 533 (3.5%) | 641 (4.2%) | 533 (3.5%) | −0.0419 | ||
| Dialysis preoperatively | 1001 (0.8%) | 36 (0.2%) | 52 (0.3%) | 36 (0.2%) | −0.0034 |
| Characteristics | SAG ( | MAG ( |
| PSM-SAG ( | PSM—MAG ( |
|
|---|---|---|---|---|---|---|
| Use of CPB | 105 414 (90%) | 9275 (68%) | <.001 | 13 428 (91%) | 9260 (67%) | <.001 |
| CPB time (mins) (1st, 3rd Q) | 83 (64, 103) | 76 (49, 100) | <.001 | 83 (64, 103) | 76 (49, 100) | <.001 |
| XClamp time (mins) (1st, 3rd Q) | 49 (36,63) | 48 (30,65) | <.001 | 49 (36,63) | 48 (30,65) | <.001 |
| Number of grafts | <.001 | <.001 | ||||
| 2 | 27 912 (23%) | 4051 (26%) | 3588 (23%) | 4043 (26%) | ||
| 3 | 62 117 (51%) | 6874 (45%) | 7657 (50%) | 6869 (45%) | ||
| 4 | 27 000 (22%) | 3486 (23%) | 3522 (23%) | 3481 (23%) | ||
| 5 | 3354 (2.8%) | 769 (5%) | 479 (3.1%) | 769 (5%) | ||
| 6 | 285 (0.2%) | 130 (0.8%) | 46 (0.3%) | 130 (0.9%) | ||
| Mortality | 1405 (1.2%) | 146 (1%) | .03 | 122 (0.8%) | 146 (1.0%) | .11 |
| RTT | 4405 (4%) | 529 (3.6%) | .03 | 472 (3.3%) | 529 (3.6%) | .23 |
| Neurological events | <.001 | .08 | ||||
| TIA | 438 (0.4%) | 35 (0.3%) | 45 (0.3%) | 35 (0.3%) | ||
| CVA | 600 (0.6%) | 47 (0.3%) | 66 (0.5%) | 47 (0.3%) | ||
| Dialysis | 2038 (1.9%) | 220 (1.5%) | .007 | 172 (1.2%) | 220 (1.5%) | .03 |
| DSWI (in hospital) | 782 (1.1%) | 76 (0.8%) | .05 | 73 (0.8%) | 76 (0.8%) | .66 |
| Model 1 (null) | Model 2 | Model 3 | Model 4 | Model 5 | Model 6 | |
|---|---|---|---|---|---|---|
| Characteristics | OR (95% CI) | OR (95% CI) | OR (95% CI) | OR (95% CI) | OR (95% CI) | OR (95% CI) |
| Level 1: Patient | ||||||
| Age | 0.94 (0.94-0.94)*** | 0.94 (0.94-0.94)*** | 0.94 (0.93-0.94)*** | 0.94 (0.93-0.94)*** | 0.94 (0.93-0.94)*** | |
| Gender | ||||||
| Male | Reference | Reference | Reference | Reference | Reference | |
| Female | 0.86 (0.81-0.91)*** | 0.87 (0.82-0.92)*** | 0.88 (0.82-0.93)*** | 0.88 (0.82-0.93)*** | 0.88 (0.82-0.93)*** | |
| BMI | 0.99 (0.99-1.0)** | 0.99 (0.99-1.0)** | 0.99 (0.99-1.0)** | 0.99 (0.99-1.0)** | 0.99 (0.99-1.0)** | |
| LVEF | 1.09 (1.06-1.12)*** | 1.08 (1.06-1.12)*** | 1.07 (1.04-1.10)*** | 1.07 (1.04-1.10)*** | 1.07 (1.04-1.10)*** | |
| Urgency | ||||||
| Elective | Reference | Reference | Reference | Reference | Reference | |
| Urgent | 0.93 (0.89-0.97)** | 0.93 (0.89-0.97)** | 0.92 (0.88-0.97)** | 0.92 (0.88-0.97)** | 0.92 (0.88-0.97)** | |
| Diabetes | 0.83 (0.82-0.85)*** | 0.84 (0.82-0.86)*** | 0.83 (0.82-0.85)*** | 0.83 (0.82-0.85)*** | 0.83 (0.82-0.85)*** | |
| Smoking | 0.86 (0.84-0.89)*** | 0.87 (0.85-0.90)*** | 0.88 (0.85-0.91)*** | 0.88 (0.85-0.91)*** | 0.88 (0.85-0.91)*** | |
| Pulmonary disease | 0.82 (0.76-0.88)*** | 0.82 (0.77-0.89)*** | 0.80 (0.74-0.86)*** | 0.80 (0.74-0.86)*** | 0.80 (0.74-0.86)*** | |
| Peripheral vascular disease | 1.03 (0.96-1.11) | 1.04 (0.97-1.12) | 1.05 (0.98-1.13) | 1.05 (0.98-1.13) | 1.05 (0.98-1.13) | |
| Pre-operative AF | 1.04 (0.91-1.18) | 1.04 (0.91-1.18) | 1.07 (0.93-1.22) | 1.07 (0.93-1.22) | 1.07 (0.93-1.22) | |
| Neurological dysfunction | 0.88 (0.76-1.02) | 0.89 (0.76-1.04) | 0.84 (0.71-0.98)* | 0.84 (0.71-0.98)* | 0.84 (0.71-0.98)* | |
| Creatinine clearance | ||||||
| Normal | Reference | Reference | Reference | Reference | Reference | |
| Mild | 1.18 (1.05-1.32)** | 1.17 (1.05-1.31)** | 1.18 (1.05-1.32)** | 1.18 (1.05-1.33)** | 1.18 (1.05-1.33)** | |
| Moderate | 1.35 (1.20-1.51)*** | 1.33 (1.19-1.50)*** | 1.34 (1.18-1.51)*** | 1.34 (1.18-1.51)*** | 1.34 (1.18-1.51)*** | |
| Dialysis | 0.26 (0.17-0.38)*** | 0.26 (0.17-0.38)*** | 0.27 (0.18-0.41)*** | 0.27 (0.18-0.41)*** | 0.27 (0.18-0.41)*** | |
| Previous MI | 0.9 (0.87-0.94)*** | 0.9 (0.87-0.94)*** | 0.9 (0.86-0.93)*** | 0.9 (0.86-0.93)*** | 0.9 (0.86-0.93)*** | |
| Indices of deprivation | ||||||
| IMD 1 | Reference | Reference | Reference | Reference | ||
| IMD 2 | 1.12 (1.04-1.21)** | 1.13 (1.04-1.22)** | 1.13 (1.04-1.22)** | 1.13 (1.04-1.22)** | ||
| IMD 3 | 1.23 (1.14-1.32)*** | 1.25 (1.16-1.35)*** | 1.25 (1.16-1.35)*** | 1.25 (1.16-1.35)*** | ||
| IMD 4 | 1.27 (1.18-1.37)*** | 1.27 (1.18-1.38)*** | 1.27 (1.18-1.38)*** | 1.27 (1.18-1.38)*** | ||
| IMD 5 | 1.30 (1.20-1.40)*** | 1.30 (1.20-1.41)*** | 1.30 (1.20-1.41)*** | 1.30 (1.20-1.41)*** | ||
| Level 2: Surgeon | ||||||
| Use of cardiopulmonary bypass | 0.63 (0.58-0.69)*** | 0.64 (0.58-0.69)*** | 0.63 (0.58-0.69)*** | |||
| Surgeon volume | ||||||
| First Q | Reference | Reference | ||||
| Second Q | 1.25 (0.94-1.67) | 1.25 (0.95-1.65) | ||||
| Third Q | 1.10 (0.78-1.54) | 1.13 (0.82-1.57) | ||||
| Fourth Q | 1.27 (0.86-1.87) | 1.28 (0.88-1.87) | ||||
| Level 3: Hospital | ||||||
| Hospital volume | ||||||
| First Q | Reference | |||||
| Second Q | 0.79 (0.30-2.04) | |||||
| Third Q | 1.32 (0.48-3.64) | |||||
| Fourth Q | 0.47 (0.15-1.42) | |||||
| Intercept | 0.04 (0.03-0.06)*** | 2.89 (1.79-4.69)*** | 2.57 (1.59-4.17)*** | 4.18 (2.58-6.76)*** | 3.76 (2.28-6.21)*** | 4.27 (2.20-8.30)*** |
| Variance estimate | 0.52 | 0.54 | 0.54 | 0.52 | 0.52 | 0.52 |
| ICC | ||||||
| Surgeon | 0.3 | 0.32 | 0.32 | 0.31 | 0.31 | 0.31 |
| Hospital | 0.22 | 0.22 | 0.22 | 0.21 | 0.21 | 0.21 |
Peer Reviews
No public reviews on file for this paper yet. If you reviewed it on a platform where reviews are public (OpenReview, ICLR, NeurIPS, ICML), you can paste yours below so the community can read it here.
Videos
No videos yet. Explain this paper in a talk, walkthrough, or lecture? Add one.
Taxonomy
TopicsCardiac and Coronary Surgery Techniques · Peripheral Artery Disease Management · Infectious Aortic and Vascular Conditions
INTRODUCTION
Over the past 2 decades, the global use of multiple arterial grafting (MAG) has significantly decreased.1–3 Despite growing evidence and guideline recommendations endorsing the benefits of MAG,3–5 their adoption remains restricted to specific surgeon experience and institutional volume.6^,^7
Concurrently, the patient population undergoing coronary artery bypass grafting (CABG) has seen notable changes, with significant increases in comorbidities and risk profiles (EuroScore II).1 Therefore, it could be argued that variation in MAG adoption is due to differences in patients’ comorbidities and risk profiles across the nation.
To account for these factors when assessing variation in MAG use, we employed a multilevel modelling (MLM) approach. MLM, also known as hierarchical linear modelling, can facilitate the analysis of patient-, surgeon-, and hospital-level factors to evaluate their impacts when applied to specific procedures. MLM helps to separate the variation due to individual patient factors from that due to surgeons or hospitals, providing a clearer and fairer understanding of where true differences in MAG use arise. We aimed to utilize MLM on a national dataset to investigate the variation in MAG use across the United Kingdom.
METHODS
All patients who underwent elective or urgent isolated CABG from 2010 to April 2019 were extracted from the National Adult Cardiac Surgery Audit (NACSA) database. The NACSA database prospectively collects data on all primary heart operations carried out on National Health Service patients in the United Kingdom since April 1996. The definitions of database variables used and a description of the database were previously described.8 MAG was defined as the use of 2 or more arterial conduits.
The Index of Multiple Deprivation (IMD) decile values were recoded into quintiles, with quintile 1 indicating the most deprived and quintile 5 the least deprived. Missing IMD (<5%) values were imputed using the median value. Individual surgeons’ and hospitals’ volumes were categorized into 5 quartiles. Patients who underwent emergency or salvage CABG, previous cardiac surgery, received a single bypass graft, non-isolated CABG, and had missing data in the number and types of grafts, surgeons’ anonymized ID and hospital code (<2%) were excluded from the study.
Data are then input into the 6-model used in the MLM (see statistical analysis) to evaluate the variation of the use of MAG at patient-, surgeon-, and hospital-level. Intraclass correlation coefficient (ICC) was used to measure how much of the total variation in use of MAG is explained by clustering at a given level.
Ethical statement
The study is part of a research project approved by the Health Research Authority (HRA) and Health and Care Research Wales (HCRW). As the study included retrospective interrogation of the NACSA database, the need for individual patient consent was waived off (HCRW) (IRAS ID: 278 171) in accordance with the research guidance. The study was performed in accordance with the ethical standards as laid down in the 1964 Declaration of Helsinki and its later amendments. The General Data Protection Regulations were strictly followed for the use of all data.
Statistical analysis
Continuous variables were reported as median and interquartile range (IQR). Categorical variables were reported as frequencies and percentages. Pearson’s chi-squared test, Wilcoxon rank-sum test, and 1-way/multi-factor analysis of variance were used to compare 2 categorical variables, for comparison between means of 2 continuous, independent samples, and to compare between 3 continuous variables, respectively.
Propensity score matching (PSM) was performed to create a quasi-experimental design by balancing measured confounding factors between the 2 groups—single arterial grafting (SAG) and MAG. A 1:1 nearest neighbour matching without replacement with a calliper width of 0.2 standard deviation of the logit of the propensity scores was performed using the preoperative characteristics listed in Table 1. No formal adjustment for multiple comparisons was applied. Missing continuous variables data were imputed with the median value in the data after the application of exclusion criteria listed above. After matching, all standardized mean differences for the covariates were checked. An adequate balance was set to be below 0.1. The effectiveness of the PSM was visualized with a love plot showing the propensity score before and after the matching. This is shown in Figure 1.
The Love Plot Visualizing the Effectiveness Before and After Propensity Score Matching. Abbreviations: AF: atrial fibrillation; BMI: body mass index; CCS: Canadian Cardiovascular Society; LMS: left main stem disease; LVEFc: left ventricular ejection fraction category; MI: myocardial infraction; NYHA: New York Heart Association; PCI: percutaneous coronary intervention; PVD: Peripheral vascular disease.
A 3-level multilevel logistic regression model was fitted with patients at level 1, nested within surgeons (level 2), who were in turn nested within hospitals (level 3). The model included fixed effects for relevant patient-level covariates, including age, sex, diabetes, and other clinical characteristics. Random intercepts were specified for surgeons and hospitals to quantify variation in MAG use attributable to surgeons’ and institutions’ levels, respectively. The use of MLM in cardiac surgery using the national registry and its interpretation was previously discussed by Sanagou et al.9
To examine the factors influencing MAG use while accounting for clustering, a stepwise modelling approach was employed. Model 1 (null model) included only random intercepts for hospitals and surgeons to establish baseline variation in MAG use. Model 2 adjusted for baseline clinical risk using patients’ risk profile variables. Model 3 incorporated socioeconomic status via IMD quintiles. Model 4 further adjusted for procedural strategy (on-pump vs off-pump CABG). Model 5 included surgeon volume (quartiles of individual surgeon case volume over the study period). Model 6, the final model, added hospital volume (quartiles of institutional CABG volume). ICC was used to assess the degree of between-patients, surgeon and hospital variation in the use of MAG.
Model comparison was conducted using likelihood ratio tests to evaluate the incremental contribution of covariates at each stage. Fixed effects were reported as odds ratios (ORs) with 95% confidence intervals (CIs), and variance components were used to calculate ICCs to quantify between-surgeon and between-hospital variation.
R (Version 4.2.3, R Foundation for Statistical Computing, Vienna, Austria) and R Studio (Version 1.4.1103, RStudio, PBC) were used to perform statistical analysis. Graphs and tables were created using R (Version 4.2.3, R Foundation for Statistical Computing, Vienna, Austria) and Microsoft Office 365 (Version 16.0.14026, Microsoft Corporation, Washington, USA).
RESULTS
Forty hospitals were identified, in which the MAG use ranged from 0% to 43.79% (Figure 2). The 3 highest volume centres performed 7662, 6680, and 5393 procedures and had a MAG rate of 18.6%, 4.54%, and 9.83%, respectively.
The Total Number of Isolated Coronary Artery Bypass Grafting Performed in Each Centre (x-Axis) and the Proportion of Multiple Arterial Grafting Performed (y-Axis). Each dot represents a single centre
A total of 135 978 patients were included in the study, with the median age of 67.5 (first and third quartile: 60.1, 74.1) years and 83% were male. The median EuroScore II was 1.19 (first and third quartile: 0.82, 1.92). The use of MAG rates was 11.3% (n = 15 310) during the study period.
After PSM, there was no differences between patients who received single or MAG in in-hospital survival (0.8% vs 1.1%, P = .11), return to theatre for bleeding (3.3% vs 3.6%, P = .23), post-operative stroke (0.5% vs 0.3%, P = .08), and deep sternal wound infection prior to discharge from the index operation (0.8% vs 0.8%, P = .66). Tables 1 and 2 shows the pre-operative, intraoperative, and post-operative characteristics before and after PSM.
Multilevel modelling
Younger (OR: 1.06, 95% CI: 1.06-1.07, P < .001), male patients (OR: 1.12, 95% CI: 1.07-1.18, P < .001), and patients with fewer comorbidities and a higher socioeconomic status were more likely to receive MAG. Surgeons and hospitals with a higher volume of off-pump CABG were more likely to offer multiple arterial grafts (OR: 1.37, 95% CI: 1.31-1.42, P < .001), while individual surgeons’ volumes were not associated with the use of MAG.
The interclass correlation coefficient was 0.31 (surgeon level) and 0.20 (hospital level), implying 31% of the variability (in the use of MAG) is due to differences between surgeons (independent of the patients and hospital), and 20% due to systematic differences between hospitals (independent of the patients and surgeons) (Table 3). Patient-level factors or other unaccountable factors explain the remaining variation.
DISCUSSION
Our findings indicate that, after accounting for patient characteristics, significant variation persists in the utilization of MAG at both the individual surgeon and hospital levels. Younger male patients with few comorbidities and higher socioeconomic status were more likely to receive MAG. Furthermore, the use of arterial grafts did not seem to increase the incidence of early in-hospital major complications.
Over the past 2 decades, despite growing evidence and guideline recommendations endorsing the benefits of MAG, its use has significantly decreased worldwide.3–5 MAG adoption remains restricted to specific surgeons and centres.6^,^7 A study by Velez and colleagues conducted a statewide survey to evaluate surgeons’ perception of the use of MAG. Half of the respondents reported non-routine MAG use in their practice, primarily due to the risk of potential postoperative complications. After linking the respondents’ data with the Society of Thoracic Surgeons patient data and considering the patients’ co-morbidities, there was a variation in the use of MAG at both the surgeons’ and hospitals’ levels. For example, 32% reported having a hospital MAG protocol, and this was associated with a higher MAG use. Such results were also observed in our study, where 50% of the variation was due to the surgeons’ and hospitals’ levels. Our results in the United Kingdom (11.3%) are somewhat similar to those in the United States, where 14% of patients received MAG in a study using the Society of Thoracic Surgeons Adult Cardiac Surgery Database between 2018 and 2019.10 In Canada, population-based data from Ontario (2008-2016) report 16.4% of patients received 2 arterial grafts and 6.1% received 3 arterial grafts.6 However, data from Australia and New Zealand showed a 54.7% use of MAG, suggesting variation is not only limited to surgeons and hospitals but potentially to the national and international level.11
There is no doubt that the surgeon and centre experience play a major role in the case selection and the outcome of MAG. A study by Schwann et al12 reported a higher operative mortality in patients receiving bilateral mammary artery than those receiving single mammary artery at low-experience centres in the United States. However, this was not observed in experienced centres, suggesting that experience matters in the use of MAG. A meta-analysis encompassing 27 000 patients from 34 studies reported an inverse relationship between centre volume in the use of MAG and long-term mortality, with lower-volume centres reporting a lower survival rate at both 5 and 10 years.13 In our analysis, after PSM, we did not find any significant difference in mortality and major early in-hospital complications associated with the use of MAG.
Patient risk profile undergoing CABG has been increasing for the past 2 decades in both the United Kingdom and worldwide.1 With an increasing risk profile, one could argue that this cohort of patients may not benefit from MAG. In a study analysing 26 000 patients using the New Jersey registry, the authors demonstrate that patients who received MAG had a better long-term survival and a lower incidence of repeat revascularization.14 However, the benefit of MAG on long-term survival was not observed in patients older than 70 years and those with poor left ventricular ejection fraction (≤30%) preoperatively.14 Gaudino et al15 examined the New York Cardiac Surgery Reporting System with approximately 64 000 patients and found similar findings. MAG was associated with a better long-term survival rate and reduction in repeat revascularization in low-risk patients only. Our study results also suggest that patients with fewer comorbidities were more likely to undergo MAG. These findings underscore the need to adjust for patient risk profiles using the MLM to account for variations in MAG utilization, thereby mitigating potential selection bias.
Enhanced recovery after surgery (ERAS) protocols in CABG are associated with improved postoperative outcomes such as reduced mechanical ventilation duration, shorter ICU and hospital stays, and lower rates of complications like bronchopneumonia, delirium, and acute kidney injury, without increasing mortality.16 These protocols are multimodal and focus on perioperative optimization, early mobilization, and minimizing surgical stress. The integration of ERAS protocols with MAG is not yet specifically addressed in the medical literature, but the available evidence suggests that ERAS could potentially be applied to patients undergoing MAG, as ERAS improves perioperative outcomes without increasing mortality or morbidity.16 Future studies integrating ERAS implementation status may clarify its impact on MAG utilization.
The technical complexity of MAG, including harvesting and anastomosis of arterial conduits such as the radial artery and bilateral internal thoracic arteries, requires advanced skill acquisition and experience. Insufficient exposure and lack of standardized training are major barriers to routine MAG use among trainees and practising surgeons.17–19 Venardos and colleagues conducted a survey with 84 thoracic surgery residents, with 76% and 35% claiming that they have no experience in radial artery and skeletonization mammary artery harvesting, respectively. Structured mentorship programs, where trainees work closely with experienced surgeons, facilitate the safe transfer of skills and help overcome the steep learning curve associated with MAG. Evidence demonstrates that training operations involving MAG can be performed safely by trainees under supervision, with outcomes comparable to those of experienced consultants, and that individual learning curves remain within acceptable error rates.20
In addition to surgical training, the implementation of hospital protocols or standardized pathways for MAG could increase the use of MAG. Adoption of hospital protocol for MAG was associated with increased utilization.7 This is likely due to explicit institutional support, standardized decision-making, and lower barriers to adoption MAG. Protocols could potentially facilitate multidisciplinary collaboration, streamline perioperative planning, and may include educational components or technical support, further increasing surgeon confidence and willingness to perform MAG.7
Limitation
There are several limitations in our study. The NACSA database heavily relies on healthcare professionals’ input, and missing data are noted in some of the non-mandatory input. Overall, less than 2% of mandatory variables and <5% of IMD data were missing. However, for non-mandatory variables in post-operative outcomes, such as deep sternal wound infection, this could be higher (∼10%). The use of Y/T grafting and the specific details of individual graft configuration were also not recorded in the NACSA database. Hence, variation among different arterial strategies could not be analysed. However, the number and types of grafts are mandatory, and no significant discrepancies were observed. Despite the application of PSM, residual bias may still be present in the analysis, as the propensity-matched model can only account for measured confounders and not for unmeasured confounders (eg, frailty). MLM is powerful for handling nested data, but it has limitations. Large sample sizes are required at each level to minimize bias, which limits the use of this method to small datasets. Lastly, the absence of follow-up data in the NACSA database, which includes survival rates, the need for repeat revascularization, and the rate of major adverse cardiac events, is another limitation to evaluate the benefits of MAG fully. Therefore, our analysis focuses primarily on short-term outcomes and variation in practice patterns.
CONCLUSION
Our results demonstrate a considerable variation at both the surgeons’ and hospitals’ levels in the use of MAG in isolated CABG in the United Kingdom. The use of MAG was more common in young males with few comorbidities and higher socioeconomic status. The use of MAG was not associated with an increase in the incidence of early in-hospital major complications. The substantial unwarranted variation suggests opportunities for quality improvement to standardize practice, including at both the surgeon and hospital levels.
The reference list from the paper itself. Each links out to its DOI / PubMed record.
- 1Chan J , Dimagli A, Dong T, Fudulu DP, Sinha S, Angelini GD. Trend and factors associated with multiple arterial revascularization in coronary artery bypass grafting in the UK. Eur J Cardiothorac Surg. 2022;62:1.10.1093/ejcts/ezac 28435511128 · doi ↗ · pubmed ↗
- 2Schwann TA , Tatoulis J, Puskas J, et al Worldwide trends in multi-arterial coronary artery bypass grafting surgery 2004-2014: a tale of 2 continents. Semin Thorac Cardiovasc Surg. 2017;29:273-280.29195570 10.1053/j.semtcvs.2017.05.018 · doi ↗ · pubmed ↗
- 3Sabik JF , Mehaffey JH, Badhwar V, et al Multiarterial vs single-arterial coronary surgery: 10-year follow-up of 1 million patients. Ann Thorac Surg. 2024;117:780-788.38286204 10.1016/j.athoracsur.2024.01.008 · doi ↗ · pubmed ↗
- 4Aldea GS , Bakaeen FG, Pal J, et al; Society of Thoracic Surgeons. The society of thoracic surgeons clinical practice guidelines on arterial conduits for coronary artery bypass grafting. Ann Thorac Surg. 2016;101:801-809.26680310 10.1016/j.athoracsur.2015.09.100 · doi ↗ · pubmed ↗
- 5Sousa-Uva M , Neumann F-J, Ahlsson A, et al; ESC Scientific Document Group. 2018 ESC/EACTS guidelines on myocardial revascularization. Eur J Cardiothorac Surg. 2019;55:4-90.30165632 10.1093/ejcts/ezy 289 · doi ↗ · pubmed ↗
- 6Rocha RV , Tam DY, Karkhanis R, et al Multiple arterial grafting is associated with better outcomes for coronary artery bypass grafting patients. Circulation. 2018;138:2081-2090.30474420 10.1161/CIRCULATIONAHA.118.034464 · doi ↗ · pubmed ↗
- 7Velez AK , Alejo D, Holmes SD, et al Multiple arterial graft use in coronary artery bypass surgery: surgeon perspective vs practice. Ann Thorac Surg. 2023;116:474-481.36608752 10.1016/j.athoracsur.2022.11.041 · doi ↗ · pubmed ↗
- 8Bridgewater B , Society for Cardiothoracic Surgery in GB, Ireland. Cardiac registers: the adult cardiac surgery register. Heart. 2010;96:1441-1443.20511631 10.1136/hrt.2010.194019 · doi ↗ · pubmed ↗