Contrasting viral infection strategies for single cell and colonial Microcystis populations consistent with Black Queen dynamics
Xuhui Huang, Emily E Chase, Brittany N Zepernick, Robbie M Martin, Lauren E Krausfeldt, Helena L Pound, Hanqi Wu, Zheng Zheng, Steven W Wilhelm

TL;DR
This study explores how Microcystis cyanobacteria form colonies and how this affects their interactions with viruses and other microbes.
Contribution
The study reveals how colony formation in Microcystis influences viral infection strategies and microbial community dynamics.
Findings
Colony-associated Microcystis cells show increased metabolic and defensive gene expression.
Viral infection strategies differ between colonial and single-cell Microcystis populations.
Colony formation may promote lysogeny due to high cell density and superinfection immunity.
Abstract
Cyanobacterial blooms dominated by Microcystis spp. pose significant ecological challenges, including the release of toxins and disruption of aquatic food webs. Although Microcystis can exist as free-living single cells or within dense mucilaginous colonies, the drivers and consequences of colony formation remain unclear. Here, we integrated metatranscriptomic datasets from two Microcystis bloom events in Lake Taihu, China, to analyze and to support findings on the functional differences between colonial and single-cell Microcystis. Our results confirmed colony expression profiles were disproportionately enriched in Microcystis transcripts compared to other prokaryotic taxa. This pattern exhibits Black Queen-like dynamics, where Microcystis assumes greater metabolic and defensive roles while associated bacteria reduce their transcriptional activity. Concomitantly, viral infection…
Genes, proteins, chemicals, diseases, species, mutations and cell lines named across the full text — each resolved to its canonical identifier and authoritative record.
Click any figure to enlarge with its caption.
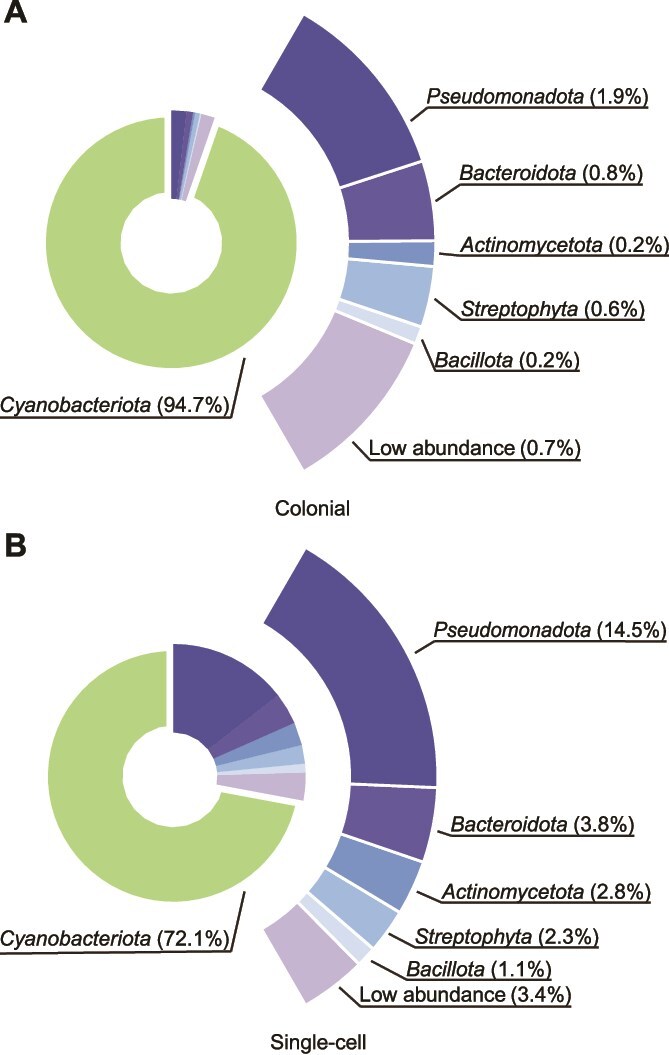 Figure 1
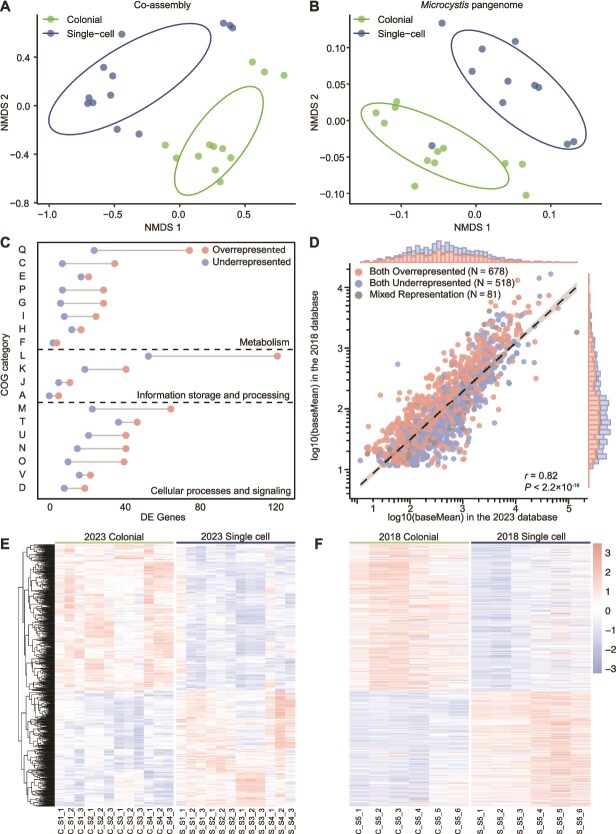 Figure 2
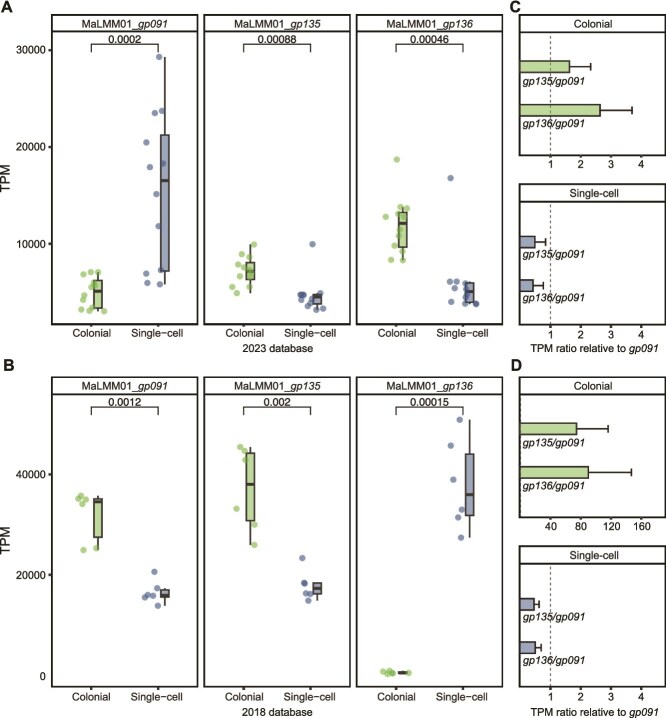 Figure 3
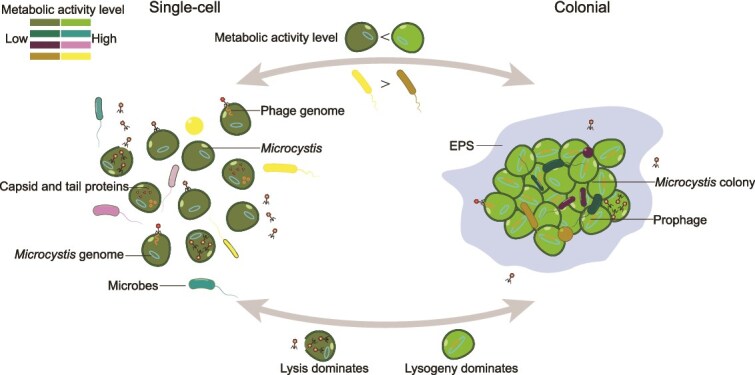 Figure 4
| Taxonomy | DE genes | Overrepresented genes in colonies | Underrepresented genes in colonies |
|---|---|---|---|
|
| 10 509 | 4423 | 6086 |
|
| 5404 | 4346 | 1058 |
|
| 5105 | 77 | 5028 |
|
| 54 612 | 66 | 54 546 |
|
| 17 150 | 23 | 17 127 |
|
| 11 515 | 13 | 11 502 |
|
| 4801 | 117 | 4684 |
|
| 2491 | 16 | 2474 |
- —National Science Foundation10.13039/100000001
- —National Institute of Environmental Health Sciences10.13039/100000066
- —Simons Foundation10.13039/100000893
Peer Reviews
No public reviews on file for this paper yet. If you reviewed it on a platform where reviews are public (OpenReview, ICLR, NeurIPS, ICML), you can paste yours below so the community can read it here.
Videos
No videos yet. Explain this paper in a talk, walkthrough, or lecture? Add one.
Taxonomy
TopicsAquatic Ecosystems and Phytoplankton Dynamics · Microbial Community Ecology and Physiology · Vibrio bacteria research studies
Introduction
Cyanobacteria are among the most ecologically significant microorganisms in fresh waters, driving biogeochemical cycles that include carbon fixation and nutrient regulation. Yet, concomitantly with these benefits come considerable environmental challenges through the formation of harmful algal blooms [1]. Microcystis has emerged globally as a key player [2] due to its adaptability to environmental conditions [3]. Although colony formation is a hallmark of Microcystis in natural systems, this capability is often lost under laboratory conditions [4], underscoring the potential importance of environmental pressures in driving this phenomenon.
The formation of Microcystis colonies has been suggested to confer numerous ecological advantages, including resistance to chemical stress [5], high-light conditions [6], grazing pressure [7], facilitating buoyancy, and nutrient acquisition [6]. Central to many of these processes is the interaction between Microcystis and associated heterotrophic bacteria (i.e., microbiome or phycosphere community), which can be embedded within the extracellular polymeric substance (EPS) matrix surrounding colonies [8]. This phycosphere community, comprising diverse taxa, is hypothesized to play pivotal roles in nutrient cycling, organic matter decomposition, and resource exchange, creating a microenvironment that supports Microcystis proliferation and dominance in eutrophic waters [9].
Bacteria and phages represent the most abundant and genetically diverse entities on Earth, with phages often outnumbering their bacterial hosts by an order of magnitude [10]. Among them, many phages employ a dual strategy of infection: entering lytic or lysogenic cycles [10]. In the lysogenic state, phages integrate into the bacterial genome as prophages, establishing a symbiotic relationship that may impose a fitness cost by disrupting host gene expression but also potentially conferring adaptive advantages, such as regulating host gene expression [11], introducing or altering functions [10], facilitating bacterial DNA transfer [12], shaping bacterial communities [13–15], and conferring resistance to further phage infection via superinfection exclusion. These phage-mediated interactions are thought to drive significant functional and evolutionary shifts in bacterial hosts, particularly under environmental stress [16, 17].
In this study, we used 20- and 0.45-μm-pore-size filters to enrich colonial and single-cell Microcystis bloom samples in Lake Taihu ( in Mandarin), China, and analyzed metatranscriptomic data to investigate the interplay between colony formation, the associated microbiome and viral infection. Additionally, we used data from another year to support the consistency of our observation. Previously we had hypothesized that lysogen formation or growth at high cell densities would be more prevalent when cyanobacterial blooms were at high densities [18]: we thought resistance to superinfection commonly seen in other lysogens could protect these massive blooms from collective lysis due to the high contact rates conditions would create [19]. By profiling the expression of lysogeny- and lytic-cycle-associated genes in a natural system, we demonstrated a positive correlation between colony formation and potential lysogen formation. However, the mechanism driving this phenomenon remains unclear—does lysogeny promotes colony formation by modulating host functions or does colony formation provide an environment conducive to lysogenic interactions? Our findings highlight the complexity of Microcystis ecological strategies and underscore the need for further research, including controlled experiments in laboratory settings, to disentangle the mechanistic links between lysogeny, colony formation, and microbial interactions.
Materials and methods
Sample collection
Surface water samples of a Microcystis bloom were collected from four sites (Supplementary Table 1) in Zhushan Bay, Lake Taihu on 26 August 2023 at midday. The separation of single cells and colonies of Microcystis was completed by a vacuum filter device (pressure range: 0 to −1 MPa) equipped with 20 μm filter membranes. Subsequently filtrates were pass through 0.45 μm filters to collect single cells. At each of four locations, sampling was performed in triplicate, resulting in a total of 12 colonial samples and 12 single-cell samples. Immediately after separation, the filter membranes were stored at −80°C until further processing. The particle size distribution of the colonial samples was measured using a laser particle size analyzer (BT-9300ST, Bettersize Instruments, Dandong, China) to confirm the presence of Microcystis colonies (Supplementary Fig. 1).
In parallel with the above samples, we accessed previously processed data collected and sequenced in 2018. Those six colonial and six single-cell samples were collected from the boat dock of the “Taihu Laboratory for Lake Ecosystem Research”. Samples were collected using 28 μm mesh-size Nytex™ filtration material: retentate was maintained for the “colonial” size class and material passing through the filter was recollected onto a 0.2 μm nominal pore-size polycarbonate filter mounted in a Swinnex holder and delivered with a sterile 60 CC syringe. Sample collections for the 2018 dataset are detailed in Supplementary Information.
RNA extraction and sequencing
RNA samples were extracted and sequenced at Shanghai Majorbio Bio-pharm Biotechnology Co., Ltd. (Shanghai, China). Total RNA was extracted from the tissue using Soil RNA Extraction Kit (Majorbio, China). Total RNA was processed using the Illumina Stranded mRNA Prep, Ligation kit (Illumina, San Diego, CA, USA), with rRNA depletion performed using the RiboCop rRNA Depletion Kit for mixed bacterial samples (Lexogen, USA). Libraries were prepared following standard Illumina protocols and sequenced on a NovaSeq 6000 platform (Illumina; paired-end mode). Sample collection, RNA extraction and sequencing of 2018 samples are detailed in Supplementary Information.
Pangenome assembly
To identify the transcriptomic differences between Microcystis morphotypes, 16 complete, closed Microcystis genomes (Supplementary Table 2) were downloaded from the National Center for Biotechnology Information (NCBI) to establish a Microcystis pangenome [20]. All individual genomes were merged into a single file and redundant coding sequences were subsequently removed via CD-HIT (nucleotide identity of 0.95) (v.4.8.1) [21]. Functional annotation of the Microcystis pangenome was derived from individual genomes, which were automatically annotated using NCBI Prokaryotic Genome Annotation Pipeline [22], additional annotations were supplemented using EggNOG-mapper (v.2.1.12) [23] using a specified e-value of 1e^−10^. Using the same pipeline, a Microcystis phage pangenome was constructed from 41 complete Microcystis phage genomes (Supplementary Table 3).
Metatranscriptomic analysis
The sequence analysis of both 2023 and 2018 libraries used the following pipeline: bioinformatic trimming of raw reads was performed using fastp (v.0.23.2) [24]. Subsequently, reads were interleaved together using reformat.sh script available in the BBTools suite(v.38.18) [25]. Residual rRNA and contaminants were removed using the JGI reference database and bbmap.sh(v.38.18) [25] (minid = 0.93). The quality of reads was checked using FastQC (v.0.12.1) before and after trimming. Trimmed and filtered libraries (n = 24) were concatenated and assembled via MEGAHIT (v.1.2.9) [26], with quality of coassembly confirmed via QUAST QC (v.5.0.2) [27]. Read mappings were performed using bbmap.sh (v.38.18) [25] (minid = 0.90) to align mRNA reads to the coassembly, Microcystis pangenome and Microcystis phage pangenome, respectively. The summary of sequence information of 2023 libraries was listed in Supplementary Table 4. Read counts were tabulated by featureCounts (v.2.0.6) [28].
Gene predictions were performed using MetaGeneMark (v.3.38) [29] with the metagenome-style model. Taxonomic annotation of predicted genes was performed using Kraken 2 (v.2.1.3) [30] with the RefSeq complete genomes dataset (including archaea, bacteria, viral, fungi, and plant genomes). Functional annotations of predicted genes were supplemented using EggNOG-mapper (v.2.1.12) [23] using a specified e-value of 1e^−10^.
Statistical analyses
Mapped reads were normalized to transcripts per million (TPM), representing relative transcript abundance, to account for differences in library size and gene length. The terms “overrepresented” and “underrepresented” are used to describe changes in the proportional representation of transcripts within the total transcriptome pool across conditions. All analyses were conducted in R [31] (v.4.4.2). For microbial relative abundance and gene expression levels, Shapiro–Wilk test was used to assess the normality of paired differences. As all comparisons met the normality assumption (P > .05), paired t-test was applied. Mean values are reported with standard deviation (SD). Normality of the log-transformed gene expression values from both 2018 and 2023 datasets was assessed using the Shapiro–Wilk test and did not meet the assumption of normality. Given the large number of genes analyzed, Pearson correlation was applied, with Spearman’s rank correlation used as a validation. Clustering of the normalized libraries was visualized via nonmetric multidimensional scaling (NMDS) using Bray–Curtis dissimilarity, implemented in the vegan (v.2.6-8) package. KEGG pathway enrichment analysis was performed using the clusterProfiler [32] (v.4.14.4) package. Heatmaps were generated with the pheatmap (v.1.0.12) package, and all additional figures were created using the ggplot2 [33] (v.3.5.1) package. Differential expression (DE) analysis was conducted using DESeq2 [34] (v.1.28.1), with genes showing a baseMean <10 excluded as noise. Genes with a log_2_ fold change >1 (log_2_|FC| >1) and an adjusted P value of <.05 were considered differentially expressed.
Results
Colonies are less taxonomically diverse than single-cell samples
We observed significant differences in the taxonomic composition between colonial (Fig. 1A) and single-cell (Fig. 1B) samples. Cyanobacteriota dominated both colonial and single-cell samples, accounting for an average of 94.7% ± 1.5% SD in colonial samples and 72.1% ± 10.5% SD in single-cell samples, with a significantly higher proportion in the colonial samples (P = .20, Shapiro–Wilk test; P < .001, paired t-test). Excluding Cyanobacteriota, the top five phyla which all demonstrated lower relative abundance in colonial samples compared with single-cell sample and included Pseudomonadota (P = .75, Shapiro–Wilk test; P < .001, paired t-test), Bacteroidota (P = .52, Shapiro–Wilk test; P < .001, paired t-test), Actinomycetota (P = .09, Shapiro–Wilk test; P < .001, paired t-test), Streptophyta (P = .10, Shapiro–Wilk test; P < .001, paired t-test) and Bacillota (P = .33, Shapiro–Wilk test; P < .001, paired t-test). At the genus level, Microcystis was the most abundant within the phylum Cyanobacteriota, accounting for an average of 91.7% ± 3.1% SD in colonial samples and 67.9% ± 9.6% SD in single-cell samples (Supplementary Fig. 2). During the 2023 sampling, Microcystis dominated both large colonies and small particles like what Cyanobacteriota did in phylum level, whereas other bacteria and eukaryotes were present at concentrations 1–2 orders of magnitude lower. These trends were also observed in 2018 samples (Supplementary Fig. 3).
Microbiota of colonial and single-cell samples from the 2023 dataset. (A), (B) Phylum-level distribution of the microbiota in colonial samples (A, n = 12) and single-cell samples (B, n = 12) collected in 2023. Cyanobacteriota are represented in the inner donut chart. The outer ring highlights the relative abundances of non-Cyanobacteriota phyla, with corresponding percentages indicated beside the taxa.
Microcystis dominates transcription of biological processes in colonies
Gene expression of both the microbiota and Microcystis differed in the colony samples relative to single-cell samples. The nMDS of Bray–Curtis dissimilarity based on gene expression from both the co-assembly (Fig. 2A) and Microcystis pangenome (Fig. 2B) were separately evaluated. DE analysis among the top six phyla revealed distinct transcriptional patterns (Table 1). In Cyanobacteriota, overrepresented and underrepresented genes between colonies and single cells were comparable. However, in other bacteria and eukaryotes, 97.8%–99.9% of the relevant expression of the genes were underrepresented in colonial samples. Within Microcystis alone, 81.6% of the genes in Microcystis increased expression in colonial libraries, whereas 97.8% of the genes in other Cyanobacteriota decreased expression. This latter pattern was similar to that of other bacteria and eukaryotes. The KEGG pathway enrichment analysis genes with decreased expression among all microbiota, excluding Microcystis, were primarily enriched in biosynthesis of cofactors and amino acids, and carbon metabolism (Supplementary Fig. 5). Within these same pathways, Microcystis showed more genes with increased expression (n = 212) in colonies than decreased expression (n = 116) (Supplementary Fig. 5).
Functional distribution based on the co-assembly and Microcystis pangenome. (A), (B) NMDS plot based on Bray–Curtis dissimilarity of transcriptomic data from 2023 samples, mapped to the co-assembly (A) and the Microcystis pangenome (B), using TPM normalized data. Ellipses cover 68% of the data for each form. (C) Distribution of 2166 differentially expressed (DE) Microcystis genes across COG functional categories in the 2023 dataset. (D) Pearson correlation analysis of log10-transformed baseMean values for 1277 shared significant genes in the 2018 and 2023 datasets. (E), (F) Heatmap of 1277 shared significant genes across colonial and single-cell samples from the 2023 (E) and 2018 (F) dataset. Gene expression values were normalized to z-scores based on TPM values, and hierarchical clustering was performed on genes in the 2023 dataset, with the 2018 dataset using the same order. DE genes: differentially expressed genes.
To further investigate how community morphology contributed to the dissimilarity in Microcystis expression, DE gene analyses were performed based on the Microcystis pangenome and 2023 dataset. In total, 2166 genes belonging to Microcystis were differentially expressed (|Log_2_ FC| ≥ 1, P_adj_ < .05), with 1547 of these genes increased in relative expression in colonial samples and 619 decreased. Across each COG category, most genes exhibited increased expression in colonial samples (Fig. 2C). Genes categorized in COG category L (Replication, recombination and repair, n = 175) were the most highly represented category based in the DE dataset, with 69.7% of them overrepresented in colonial samples. Of those genes, the majority belonged to transposase-encoding genes, with 64 identified, of which 52 (81.3%) showed decreased expression in colonial samples (Supplementary Fig. 7). Other genes associated with mobile genetic elements, such as genes encoding endonuclease and reverse transcriptase, also showed increased relative expression in colonies. Likewise, relative expression of genes within COG category Q (Secondary metabolites biosynthesis, transport and catabolism) increased in colonies (Supplementary Fig. 7). Other genes, including those encoding PEP-CTERM protein, gas vesicles and calcium-binding protein exhibited increased expression in colonial samples (Supplementary Fig. 7). Similar results were observed in 2018 samples (Supplementary Figs 6, 8).
To confirm our 2023 observations, a 2018 dataset of 12 libraries was also examined to find the DE genes in Microcystis. We identified 1277 shared genes (adjusted P < .05) present in both datasets (summary of these genes are provided in Supplementary Information), 93.7% of the genes showed consistent regulated results in two datasets. Correlation analysis (Fig. 2D) based on the average expression of shared genes in the two datasets revealed a strong positive correlation (Pearson correlation, r = .82, P < .001; Spearman’s rank correlation, ρ = .81, P < .001). We generated a gene clustering heatmap (Fig. 2E) using the 2023 dataset. Using the same gene order, we constructed a corresponding heatmap with the 2018 dataset (Fig. 2F). The results revealed consistent trends across both datasets, demonstrating that the significantly expressed genes exhibited the same regulatory patterns in both datasets. This indicated that the functional expression differences in Microcystis that are associated with differences in morphology were reproducible in Lake Taihu.
Differential expression of genes from Microcystis-infecting phage
Based on Microcystis dominating both colonial and single-cell samples, as well as the functional differences driven by these morphological distinctions, we examined the expression of Microcystis phage genes to explore infection dynamics. Construction of the Microcystis phage pangenome revealed that six phages—Ma-LMM01, MaMV-DC, MaMV-DL01, MaMV-DL02, MaMV-CH01, and MaMV-CH02—clustered with each other, with pairwise similarity ranging from 60.1% to 100.0% (Supplementary Fig. 9A). After mapping sample reads to the phage pangenome, only these six Ma-LMM01-like phages and Mic1 were recruited, with the Ma-LMM01-like phages accounting for 83.5% ± 7.7% SD of the total mapped reads (Supplementary Fig. 9B). Ma-LMM01, with its fully sequenced genome, has served as an important model for studying Microcystis-phage interactions. Normalized expression of the Ma-LMM01 markers of lytic infection (tail sheath, gp091) [18], and putative lysogenic infection (transposase, gp135, and site-specific recombinase, gp136) [18] were observed in colonial and single-cell samples (Fig. 3A). Homologous genes clustered with gp091 and gp135 were also identified in MaMV-DC, MaMV-DL01, MaMV-DL02, MaMV-CH01, and MaMV-CH02 with high sequence similarity (99.6%–99.96% for gp091 and 99.1%–99.6% for gp135), while genes homologous to gp136 were found in MaMV-DL01, MaMV-DL02, MaMV-CH01, and MaMV-CH02 (98.6% similarity). Of the 24 samples from the 2023 dataset, significant differences in infection strategies were observed. Colonial samples showed lower abundant expression of gp091 (P = .25, Shapiro–Wilk test; P < .001, paired t-test) and higher abundant expression of gp135 and gp136 than single-cell samples (P = .19, .07, Shapiro–Wilk test; P < .001, paired t-test). In colonial samples, gp135 (P = .20, Shapiro–Wilk test; P = .012, paired t-test) and gp136 (P = .57, Shapiro–Wilk test; P < .001, paired t-test) exhibited significantly higher expression levels compared to gp091 (Fig. 3C), with gp135 showing a 1.64 ± 0.72 SD-fold increase and gp136 displaying a 2.65 ± 1.08 SD-fold increase, implying that lysogenic infection was dominant. In single-cell samples, gp091 exhibited significantly higher expression than gp135 (P = .82, Shapiro–Wilk test; P = .002, paired t-test) and gp136 (P = .91, Shapiro–Wilk test; P = .007, paired t-test), with gp091 showing a 3.84 ± 2.58 SD-fold and 3.38 ± 2.27 SD-fold increase over gp135 and gp136, respectively (Fig. 3C), implying those free single Microcystis cells experienced more lytic events. The expression of these maker genes was also examined in the 2018 dataset (Fig. 3B and D), revealing a consistent trend but with even greater difference. We also examined several additional putative markers of lytic and lysogenic infections in both datasets, which showed consistent expression trends (Supplementary Figs 10 and 11). These expression pattern differences are consistent across different collection years, lake locations, and times of day. For Mic1, nearly all of its genes were overrepresented in colonial samples. Mic1 may represent a subset of the viral community capable of adopting both lytic and lysogenic lifestyles [35], although the regulatory factors underlying these infection modes remain unclear.
Relative expressions of lysogeny- and lysis-associated genes. (A), (B) TPM values of lysogeny- and lysis-associated genes in colonial and single-cell samples from the 2023 (A) and 2018 (B) dataset. gp091 represents a marker for lytic infection, whereas gp135 and gp136 represent markers for lysogenic infection. The horizontal bars within the boxes represent medians, with the tops and bottoms of the boxes indicating the 75th and 25th percentiles, respectively. The upper and lower whiskers extend to the furthest data points within 1.5× the interquartile range from the edges of the box. (C), (D) TPM ratio of lysogeny-associated genes (gp135 and gp136) relative to the lysis-associated gene (gp091) in colonial and single-cell samples from the 2023 (A) and 2018 (B) dataset. Ratios greater than 1 indicate lysogeny-dominant activity, whereas ratios less than 1 indicate lysis-dominant activity. Error bars represent the standard error of the mean for each ratio. The dashed vertical line at 1 represents equal dominance between lysogeny and lysis.
Discussion
This study focused on the dominant genus of cyanobacterial blooms in Lake Taihu, Microcystis, and explored its community dynamics, interactions with associated bacteria, and the infection strategies of Microcystis phages. Using metatranscriptomic data collected in 2023, we examined differences in species abundance and functional activity across colonial and single-cell forms of Microcystis and its associated microbes, as well as the contrasting infection strategies of Microcystis phages in these two forms. The findings in Lake Taihu were supported by comparisons with a similar 2018 metatranscriptomic dataset.
In each location, colonial and single-cell fractions were derived from the same original sample and therefore shared identical environmental parameters (Supplementary Table 1). This design minimizes the influence of external factors and supports the interpretation that observed differences in microbial taxonomic composition and functional potential are primarily driven by morphological form, rather than environmental variation. The differences are further likely driven by the dominant role of Microcystis within the colonies and its interactions with associated microbes.
Colonial Microcystis is often considered to be more competitive than the single-cell form due to enhanced resilience to environmental stresses provided by its structural advantages, such as the EPS matrix that offers physical protection and facilitates nutrient acquisition [6]. Colony formation is also thought to shield individual cells from environmental pressures [6]. However, overrepresentation of many other transcripts in colonial Microcystis suggests that significant metabolic investment is required to maintain the colony. This duality implies a trade-off: whereas colonies may offer greater defense and stability, from this work they appear to demand higher metabolic effort, which ultimately may shape the competitive fitness of colonial Microcystis.
Several specific gene groups may play key roles in colonial Microcystis. Genes encoding transposases were highly represented among the DE genes, this may reflect a rapid microevolutionary response under environmental stress, enhancing the adaptive flexibility of colonies [36]. Additionally, PEP-CTERM domain genes, previously shown to anchor exopolysaccharides and mediate cell aggregation in other bacteria [37], were also overrepresented in colonies, suggesting an essential role in forming and maintaining colony structure. Genes associated with gas vesicle formation similarly exhibited increased expression, consistent with their contribution to buoyancy control and light optimization [38]. But these expression data alone cannot resolve causality and warrant further experimental validation.
Microcystis genes exhibit increased expression in colonies, whereas the transcripts of associated microbes were reduced in representation. This suggests that these microbiome members need to maintain more active metabolic pathways in single-cell environments. We hypothesize that during the transition from single-cell to colonial Microcystis, microbial interactions undergo significant changes. In the initial stages of colony formation, microbes may collaborate but rely on their individual metabolic pathways. Once the colony is established, the system exhibits Black Queen-like dynamics [39]. In that context Microcystis assumes a central role, taking on the most metabolic and defensive burdens, whereas associated microbes downregulate gene expression, benefiting from a stable and protective environment where metabolic burdens are assumed by the cyanobacterium. It remains unclear if Microcystis suppresses the bacterial activity or whether the bacteria undergo self-inhibition. To this end, although some researchers have hypothesized that blooms form and persist due to the activity of associated microbial community members [40], it appears that the opposite may be in part true: blooms and particularly colonies provide a haven for many heterotrophic bacteria, perhaps through both the increased physical protection from the colony as well as the surplus of metabolic products Microcystis appears to produce.
Metabolic activity and phage-host interactions in single-cell and colonial Microcystis. The left panel shows single-cell Microcystis, characterized by higher activity in associated microbes and lytic phage dominance. The right panel represents colonial Microcystis, where metabolic activity is concentrated in Microcystis and lysogeny dominates. Arrows indicate transitions between single-cell and colonial forms, driven by environmental factors and phage infection dynamics. Metabolic activity levels are represented using color brightness (Bright: high activity; Dark: low activity).
A final unique observation from this dataset is the difference between potential lysogens and lytically infected Microcystis cells in the colonial vs single cell samples. Studies on lysogen formation in Microcystis are in their infancy. But, the possibility of lysogen formation by Ma-LMM01-like phages was noted with the initial genomic sequencing of the virus [41], and seasonal field studies in Taihu demonstrated strong seasonal patterns in expression of genes to which lysogenic function is ascribed [18]. It should be noted that these markers were also detected in a transcriptome that was to be documenting the lysis of a population [42], although in that study 20% of the population persisted at the end of the experiment and these could have readily been lysogens. As with any bulk transcriptomic dataset, however, such patterns cannot resolve whether these transcripts originated from the same or different cells. The factors promoting or constraining these infection outcomes (and indeed even which partner makes that decision) remain unclear. In the present case, lysogen formation appears to be consistent with the hypothesis that this relationship forms/is selected for during life-at-high-density scenarios [43]: many lysogens demonstrate immunity to superinfection by similar viruses. Although existing evidence, including genomic observations and seasonal transcript patterns, strongly suggests that Ma-LMM01-like phages are capable of establishing lysogeny, our conclusions should still be interpreted in this context. During large scale Microcystis blooms, both the host and its virus can reach densities greater than 100 000 per ml [44]. At these densities viruses should contact potential hosts on a daily basis [19], effectively collapsing the bloom as is seen in other high density algal blooms [45, 46]. Given that colonies are a localized high density scenario, protection from superinfection would seem to be a necessary priority for members of the colony forming community. Going forward, it will be interesting to determine how colonies can mimic climax bloom communities as opposed to early season populations, which likely mimic single cells [38].
Conclusion
Our study illuminates how colony formation restructures Microcystis’ metabolic activity and alters its interactions with both associated bacteria and phages (Fig. 4). Colonies appear to harbor a specialized microenvironment where Microcystis invests in sustaining a dense population, maintains putative fitness benefits such as enhanced stress tolerance, and supports an elevated propensity for lysogenic phage infection. By contrast, single-cell Microcystis undergoes more frequent lytic attacks, likely due to reduced cell density and diminished collective immunity. These findings highlight the dual ecological role of colony formation as both a protective refuge and a driver of complex host–virus dynamics.
Future controlled experiments—whereby environmental parameters, Microcystis colony density, and phage populations are systematically manipulated—will be essential to pinpoint the mechanistic underpinnings of lysogenic switching and to clarify the interplay between host competition, viral infection modes, and bloom persistence. Given the potentially key role of viruses in releasing toxins from the particulate to dissolved fraction in aquatic environments [47–49], understanding these processes are key to understanding system ecology and protecting our water resources. Cyanobacterial blooms and their associated toxins pose significant risks to aquatic ecosystems, drinking water supplies, and public health. By shedding light on these interactions, we can improve predictive modeling for bloom development and develop more effective strategies to mitigate their impacts, ultimately ensuring the availability of safe and sustainable water resources for ecosystems and human use alike.
Supplementary Material
Supplementary_Information_2025_Oct_27_clean_wraf244
The reference list from the paper itself. Each links out to its DOI / PubMed record.
- 1Huisman J, Codd GA, Paerl HW et al. Cyanobacterial blooms. Nat Rev Microbiol 2018;16:471–83. 10.1038/s 41579-018-0040-129946124 · doi ↗ · pubmed ↗
- 2Harke MJ, Steffen MM, Gobler CJ et al. A review of the global ecology, genomics, and biogeography of the toxic cyanobacterium. Microcystis spp. Harmful Algae 2016;54:4–20. 10.1016/j.hal.2015.12.00728073480 · doi ↗ · pubmed ↗
- 3Wilhelm SW, Bullerjahn GS, Mc Kay RML. The complicated and confusing ecology of Microcystis blooms. M Bio 2020;11:e 00529–0. 10.1128/mbio.00529-2032605981 PMC 7327167 · doi ↗ · pubmed ↗
- 4Yang G, Tang X, Wilhelm SW et al. Intermittent disturbance benefits colony size, biomass and dominance of Microcystis in Lake Taihu under field simulation condition. Harmful Algae 2020;99:101909. 10.1016/j.hal.2020.10190933218435 · doi ↗ · pubmed ↗
- 5Huang X, Gu P, Wu H et al. Shift of calcium-induced Microcystis aeruginosa colony formation mechanism: from cell adhesion to cell division. Environ Pollut 2022;313:119997. 10.1016/j.envpol.2022.11999735995295 · doi ↗ · pubmed ↗
- 6Xiao M, Li M, Reynolds CS. Colony formation in the cyanobacterium Microcystis. Biol Rev 2018;93:1399–420. 10.1111/brv.1240129473286 · doi ↗ · pubmed ↗
- 7Yang Z, Kong F, Yang Z et al. Benefits and costs of the grazer-induced colony formation in Microcystis aeruginosa. Ann Limnol Int J Limnol 2009;45:203–8. 10.1051/limn/2009020 · doi ↗
- 8Zhou Y, Cui X, Wu B et al. Microalgal extracellular polymeric substances (EPS) and their roles in cultivation, biomass harvesting, and bioproducts extraction. Bioresour Technol 2024;406:131054. 10.1016/j.biortech.2024.13105438944317 · doi ↗ · pubmed ↗