The influence of social network structures on leisure-time physical activity in hypertensive patients: a mixed-methods study in China
Bingjie Shen, Chenyang Pei, Tianjia Guan, Yuqing He, Ziqi He, Hui Li, Xiao Lu, Linghe Yang, Jinghong Zhao, Yuanli Liu

TL;DR
This study explores how social networks influence physical activity in Chinese hypertensive patients, finding that family ties and active spouses strongly encourage exercise.
Contribution
The study identifies specific social network structures and role models that influence physical activity in hypertensive patients within China’s cultural context.
Findings
Smaller, kinship-dense networks significantly increase moderate-to-vigorous physical activity adherence.
Having a physically active spouse is the strongest predictor of higher physical activity levels.
Network-driven strategies and active spouses can be leveraged to promote exercise in hypertensive patients.
Abstract
Hypertension remains a major public health challenge in China. Leisure-time physical activity (LTPA) is critical for hypertension control. Yet its social network determinants, particularly key role models, are understudied in China’s familial-centric cultural context. This sequential mixed-methods study integrated quantitative surveys with qualitative interviews among hypertensive patients in Yichang, China. A total of 2639 patients were selected from 18 primary healthcare institutions using multi-stage random sampling method. Totally, 10,550 social relationships were nominated. Quantitative data on LTPA was measured by the International Physical Activity Questionnaire Long Form, and social network characteristics (size, density, LTPA aggregation, LTPA heterogeneity, and LTPA status of specific members) was gathered through the name generator method. Generalized additive mixed models…
Genes, proteins, chemicals, diseases, species, mutations and cell lines named across the full text — each resolved to its canonical identifier and authoritative record.
Click any figure to enlarge with its caption.
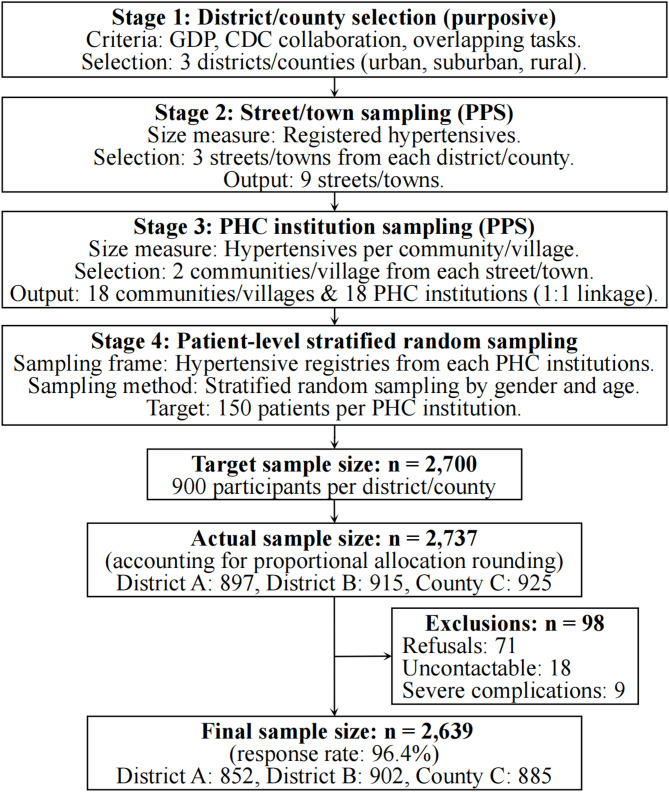 Figure 1
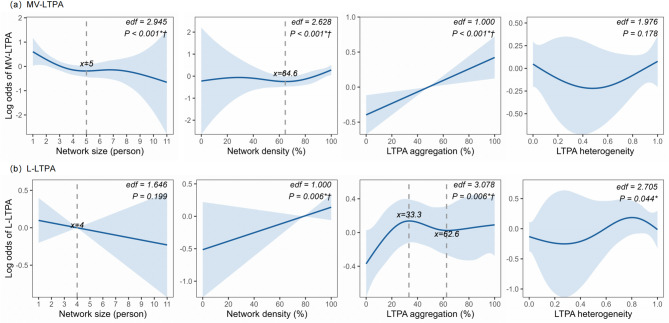 Figure 2
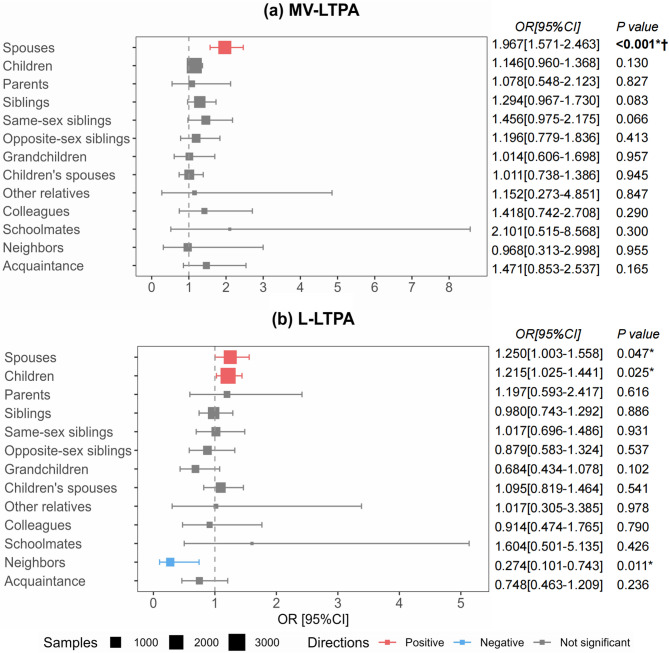 Figure 3
- —Bengbu Medical University
- —https://doi.org/10.13039/501100001809National Natural Science Foundation of China
Peer Reviews
No public reviews on file for this paper yet. If you reviewed it on a platform where reviews are public (OpenReview, ICLR, NeurIPS, ICML), you can paste yours below so the community can read it here.
Videos
No videos yet. Explain this paper in a talk, walkthrough, or lecture? Add one.
Taxonomy
TopicsPhysical Activity and Health · Health disparities and outcomes · Technology Use by Older Adults
Introduction
Challenges in hypertension management in China
Hypertension remains a critical public health crisis in China, characterized by two paradoxical trends: high prevalence (30.2% in men, 24.1% in women) yet alarmingly low control rates (13.9% in men, 17.8% in women) in 2019 [1]. This discrepancy persists despite the National Basic Public Health Service (BPHS) program since 2009, which mandates standardized hypertension management through primary care [2]. While BPHS has achieved some success in hypertension management, its impact on lifestyle modifications remains limited, which may explain suboptimal hypertension management outcomes [2].
Dilemma of LTPA promotion in hypertension management
Physical activity (PA) is considered equally vital as pharmacological interventions in hypertensive management due to its benefits, cost-effectiveness, and minimal adverse effects [3–5]. The World Health Organization (WHO) explicitly recommends adherence to ≥ 150 min of moderate-to-vigorous intensity PA (MVPA) weekly as part of total PA for chronic disease populations [6, 7]. Concurrently, light intensity PA (LPA), though often less emphasized, holds significant value for this population. As a feasible entry point for sedentary individuals and a sustainable means to reduce prolonged sitting, LPA offers a complementary pathway to improve cardiovascular health, particularly for those who face barriers to engaging in MVPA [8–10]. Leisure-time physical activity (LTPA)—defined as voluntary exercise during non-working hours—is a critical pathway to achieve the WHO target, especially given declining occupational/household PA from urbanization [11, 12]. National surveys reveal progress yet persistent gaps: regular exercise (≥ 3 times/week and ≥ 30 min per time) rates has risen from 14.7% (2014) to 30.3% (2020) in adults [13, 14]; ≥ 150 min/week of moderate-to-vigorous intensity LTPA (MV-LTPA) remains below 25% [15, 16], with even lower rates among hypertensive patients due to obesity and safety concerns [16]. This also reflects a global challenge in translating clinical recommendations into sustained patient-driven behavioral change, underscoring the urgency of identifying novel and effective intervention strategies [17, 18].
Evidence regarding social networks as a potential intervention lever for LTPA
Ecological models highlight multidimensional influences on LTPA [19], where social networks (the structural and functional architecture of interpersonal relationships [20]) represent an underexplored yet pivotal intervention lever, particularly within the Chinese context. In China, LTPA is often characterized by community-based activities (e.g., square dancing in public parks) and culturally embedded practices (e.g., tai chi), which are inherently social and deeply intertwined with the local relational fabric. This socio-cultural backdrop makes the influence of interpersonal networks on LTPA participation not only pronounced but also arguably inevitable, thereby necessitating a thorough investigation into its mechanisms.
Social networks shape health behaviors through structural (size, density, attributes of relationships, etc.) and functional (social support, resource access, social norms, behavioral contagion, etc.) dimensions according to Berkman’s theoretical framework [21] and growing evidence [22–26].
The functions provided by social networks play an proximal role in directly shaping behavioral outcomes [21, 22]. Among the existing functional mechanisms by which social networks influence LTPA, social contagion is an aspect that is often explored. Evidence demonstrats that network members' LTPA behaviors or exercise habits exert contagion effects [27]. Notably, studies suggest that individuals’ LTPA levels are positively associated not only with the actual behaviors of significant others but also with their perceptions of these individuals’ regular engagement in LTPA. Critically, such perceptions are found to exert a stronger influence on behaviors than objectively observed activity patterns [28].
However, these functions often depend on structural attributes and require precise structural metrics for evaluation. Crucially, social network research distinguishes itself by elucidating structural effects to guide interventions that modify network architecture [21, 22, 29]. Consequently, studies have explored the impact of objectively measurable structural indicators (e.g., network size, relational roles) on LTPA behaviors, grounded in functional mechanism theories. For instance, a Swiss study [30] demonstrated that individuals with regular exercise habits exhibited both larger proportions of active members and higher heterogeneity (balanced composition of active and inactive members) in their egocentric networks. Conversely, inactive individuals predominantly maintained networks with inactive members, often accompanied by discouraging interactions. Further analyses of relational attributes revealed familial clustering of PA levels in a Portuguese study [31], where kinship ties (spouses, parents, siblings) significantly shaped exercise habits. However, an adolescent study [32] highlighted peer networks (e.g., classmates or other friends of the same age) as dominant drivers of LTPA adoption.
Research gaps and objectives: bridging cultural and methodological divides
Although evidence supports the potential intervention value of social networks in promoting LTPA, existing research exhibits critical gaps, resulting in the current BPHS protocol lacking culturally adapted strategies to leverage China’s kinship-driven social fabric for LTPA promotion.
First, contextual evidence
Limited evidence exists within the Chinese context. Current research remains Western-centric, emphasizing peer/community networks in interventions [30, 31]. In contrast, exercise behavior in China may be mediated through concentric kinship circles (spouses, siblings, multi-generational ties) under the "differential mode of association (chaxugeju)" social structure [33], rather than voluntary peer groups.
Second, study population
A critical gap persists in middle-aged and older adults with hypertension—a population epitomizing China’s kinship-centric social structure. Existing conclusions, predominantly derived from adolescent studies emphasizing peer/parental influences [32], lack generalizability to this demographic.
Third, predictor measurement
Prior studies disproportionately focus on individual-level metrics (e.g., network size) while neglecting relational roles (e.g., spouses, siblings) in shaping PA behaviors [29, 30]. Although evidence suggests differential behavioral impacts of relational roles [27, 31, 32], their specific pathways under China’s kinship hierarchy remain unclear. Identifying pivotal network influencers could optimize targeted behavioral interventions.
Fourth, outcome scope
Existing research on hypertensive patients has predominantly focused on MV-LTPA [16, 34], with scant attention paid to the patterns and correlates of light-intensity LTPA (L-LTPA). The influence of social networks on L-LTPA, in particular, remains virtually unexplored. This creates a significant knowledge gap regarding the social determinants of a more feasible and accessible form of PA, especially for patients who may be unable or unwilling to engage in MV-LTPA.
Additionally, analytical methods
Sociological variables demand refined analytical approaches. Current models often treat network features as continuous variables in linear regressions [29, 30], oversimplifying complex social mechanisms. Multidimensional statistical methods and advanced classification strategies are warranted to unravel nonlinear associations.
Moreover, research design
Underutilization of mixed-methods approaches limits holistic insights. Quantitative studies predominantly report statistical associations without contextualization, while qualitative works rely on subjective theorization lacking large-scale validation [35]. Integrating both methodologies could elucidate sociobehavioral mechanisms with enhanced rigor.
Finally, inconsistent findings
Inconsistent findings impede practical applications. For example, studies on social network size showed mixed results: positive [36], negative [37], or no association [30] with LTPA. Discrepancies may arise from cross-cultural variability, unidentified critical network factors, and methodological heterogeneity. Establishing mechanistic consensus requires transcultural studies employing diverse methodologies.
Thus, this study targets hypertensive patients in the Chinese social context and aims to identify network-driven mechanisms of both MV-LTPA and L-LTPA, informing culturally intelligent interventions for China’s BPHS system. We will address these gaps through: (1) Theoretical integration: Incorporating differential mode of association theory into ecological models to decode kinship network impacts on LTPA. (2) Mixed-methods design: Combining quantitative regression with qualitative interviews to quantify network-LTPA linkages and capture lived experiences of social network influence. (3) Threshold effect analysis: Identifying critical structural thresholds in social networks that influence LTPA outcomes. (4) Comparative intensity analysis: Examining L-LTPA alongside MV-LTPA to provide a more nuanced understanding of how social networks distinctly shape the entire spectrum of LTPA. (5) Intervention targeting: Pinpointing culturally salient network actors and effective support mechanisms to inform BPHS-aligned, network-enabled strategies.
Methods
Study design and setting
This sequential explanatory mixed-methods study combined cross-sectional surveys with semi-structured interviews from April 2021 to March 2023 in Yichang, China. Quantitative findings guided qualitative exploration, while interview narratives enriched statistical associations with real-life contexts and provided a mechanistic explanation for quantitative findings.
Quantitative study
Participants and sampling
Inclusion criteria: (1) diagnosed with primary hypertension, without severe target organ damage; (2) hypertension management under the BPHS program for ≥ 1 year; (3) age 35–84 years; (4) permanent residency; and (5) able to complete the survey independently. Exclusion criteria: (1) severe complications (e.g., heart failure, stroke); (2) unable to complete the investigation due to cognitive/physical impairments; or (3) pregnancy.
Assuming a 50% prevalence of LTPA adherence (α = 0.05, margin of error = 5%, design effect = 2), the minimum sample size was calculated as 769 per district/county. We planned to recruit a total of 900 participants per district/county (accounting for 15% non-response), yielding a citywide target sample of 2,700. A four-stage stratified sampling design ensured geographic and demographic representativity (Fig. 1). After exclusions, a total of 2,639 participants remained.Fig. 1. Four-stage stratified sampling framework. Abbreviations: GDP, Gross Domestic Product; CDC, Center for Disease Control; PPS, probability proportional to size; PHC, primary healthcare
Variables and measures
Outcomes: Leisure-Time Physical Activity (LTPA)
LTPA was assessed using the LTPA part of the International Physical Activity Questionnaire Long Form (IPAQ-LF). It has been used in Chinese population studies, and showed good validity and reliability [38]. We calculated the total duration of MV-LTPA as well as L-LTPA during the past week, equating one minute of vigorous intensity LTPA (V-LTPA) to two minutes of moderate intensity LTPA (M-LTPA). Referring to the WHO recommendation for total PA (150 min/week), we categorized MV-LTPA adherence into yes (≥ 150 min/week) and no (< 150 min/week) groups. We categorized L-LTPA engagement into yes (> 0 min/week) and no (0 min/week) groups to capture the critical threshold of any L-LTPA engagement that disrupts sedentarism. Since WHO recommended PA for any length of time was encouraged, we removed the requirement that the traditional IPAQ only measure PA exceeding 10 min in a single session. We also found the results were similar to those when less than 10 min PA were excluded.
Explanatory variables: egocentric social network structural characteristics
Egocentric social network data were collected via a questionnaire employing the name generator method, a widely used tool for egocentric network analysis [39, 40]. Participants were asked to list contacts who frequently interacted with them or provided support relevant to hypertension self-care over the previous six months. Support types included informational (health advice), emotional (comfort during discomfort), instrumental (financial assistance for healthcare), and caregiving support. Participants could name up to seven members/alters per category across five questions, yielding a maximum of 35 network members. For each listed member, participants reported their relationship (e.g., spouse/partner, children, parents, siblings, neighbor, colleague, friend) and whether the member was physically active based on participants’ perception of member’s LTPA levels. Participants were provided with the 150 min/week MV-LTPA benchmark as a reference for their judgments. Members with ≥ 150 min/week MV-LTPA were classified as physically active; others (including cases with unknown LTPA levels) were deemed physically inactive. The structural network characteristics were computed from the name generator data at two levels: individual and relational. Detailed information of explanatory variables were provided in Table 1.Table 1. Explanatory variablesCharacteristicsDescription or calculation formulaRange and interpretationIndividual-level Basic structure Network sizeNumber of social relationships or social network members that the patient mentioned in the questionnaireInteger within [0, 35]: Larger values indicate a larger network Network densityProportion of strong ties (close relatives) in the network. Close relatives are defined according to China’s social structure and the Civil Code, including spouses, parents, children, siblings, grandparents, and grandchildren[0, 100%]: Larger values indicate a denser network LTPA-related structure LTPA aggregationProportion of physically active network members relative to the total number of network members[0, 100%]: Larger values indicate higher aggregation of physically active members LTPA heterogeneityIQV = \documentclass[12pt]{minimal} \usepackage{amsmath} \usepackage{wasysym} \usepackage{amsfonts} \usepackage{amssymb} \usepackage{amsbsy} \usepackage{mathrsfs} \usepackage{upgreek} \setlength{\oddsidemargin}{-69pt} \begin{document}$$\frac{\text{1} - \sum {\text{Pi}}^{2}}{\text{1} - \frac{1}{{\text{r}}}}$$\end{document} , where Pi is the proportion of physically active members or inactive members, and r is the number of variable categories[0, 1]: Larger values indicate greater heterogeneity (more balanced proportions of active/inactive members)Relationship-level LTPA of network members of specific relationshipWhether a network member was physically active, which was identified based on the participant’s subjective perception0 = Inactive;1 = ActiveAbbreviations: LTPA Leisure-time physical activity, IQV Index of Qualitative Variation
Covariates
Covariates were selected a priori based on previous literature and biological plausibility, including sociodemographics (gender, age, residence, education, occupation, income and marital status) and health status (body mass index [BMI] and self-rated health). These were collected using structured questionnaires during face-to-face interviews.
Data collection and quality control
Trained health workers conducted face-to-face interviews using structured questionnaires. Rigorous quality checks were implemented pre-, during, and post-data collection.
Statistical methods
The analytical strategy comprised descriptive statistics, followed by a two-level regression framework. All statistical analyses were performed using R 4.5.1. The Bonferroni correction was used to account for the multiple comparisons.
Individual-level analysis: nonlinear associations (n = 2639 patients)
Generalized additive mixed models (GAMMs) were implemented to jointly address nonlinear relationships between individual-level network metrics and LTPA outcomes while accounting for the hierarchical data structure (patients nested within 18 healthcare institutions). A Gaussian random intercept for the healthcare institution (k = 18) was incorporated to capture clustering effects, justified by significant intraclass correlation coefficient (ICC) = 0.305 for the MV-LTPA. Random effects at the district/county level were excluded due to limited group counts (k = 3), which could lead to biased variance estimates. Instead, fixed effects included residence (urban/suburban/rural, categorical covariate to adjust for regional disparities) as well as standard confounders (gender, age, education, etc.). Penalized B-splines (P-splines) were chosen for their robustness to sparse and skewed data, utilizing second-order difference penalties to control smoothness, which is not as sensitive to knot numbers and placements as restricted cubic splines [41]. Smooth terms were estimated via fast restricted maximum likelihood (fREML) optimization, which accelerates computation for large datasets while maintaining estimation accuracy comparable to conventional REML. The maximum basis dimension for each spline was set to k = 10 to accommodate potential complexity, with optimal smoothing parameters determined data-adaptively through fREML score minimization. Model validity was assessed through: (1) quantile–quantile plots of residuals to verify approximate normality; and (2) sensitivity analyses comparing P-splines to thin-plate splines. Models were fitted using the bam() function (Bayesian generalized additive models for large datasets) in the R package mgcv. For metrics exhibiting significant nonlinearity, inflection points were identified via first-derivative analysis of GAMM smoothing curves, and segments were defined ensuring adequate sample size in each to guarantee stable effect estimation with multiple covariates. Furthermore, segment-specific associations were quantified using piecewise mixed-effects logistic regression.
Relationship-level analysis: influential ties (n = 10,550 ties)
To identify which specific types of network members (e.g., spouses, friends) were associated with patients' LTPA, we conducted an analysis at the relationship level. Given the multilevel structure (ties nested within participants, participants nested within institutions), we fitted stratified mixed-effects logistic regression models for each of the 13 relationship subgroups. Each model included a binary outcome (participant’s LTPA outcomes: yes/no) and adjusted for three key dimensions: (1) core predictor: tie member’s LTPA status (active/inactive), (2) participant-level covariates: gender, age, residence, occupation, income, marital status and self-rated health, and (3) institution-level random intercept: to account for clustering of participants within the 18 recruitment institutions. To ensure model stability in smaller subgroups, covariates were refined by consolidating age and self-rated health into ordinal variables (≤ 3 levels) and excluding non-significant variables (education, BMI) from the participant-level analysis
Qualitative study
Participant selection
A purposive sampling strategy (maximum variation) was employed to select 37 participants from the quantitative study population to ensure diversity in age, gender, residence, and LTPA levels. Sampling continued until thematic saturation was achieved.
Data collection
Semi-structured interviews were conducted to explore social network characteristics and facilitators/barriers to exercise (using the term "exercise" instead of "LTPA" for clarity). All interviews were audio-recorded, transcribed verbatim, and cross-verified for accuracy.
Thematic analysis
Thematic analysis was guided by grounded theory principles. This involved an iterative process of: (1) open coding: iterative categorization of raw data into descriptive codes; (2) axial coding: grouping codes into thematic categories; and (3) selective coding: synthesizing categories into overarching themes. Analytical rigor was ensured through analyst triangulation and member checking.
Results
Quantitative results
Sociodemographic, physical-health, social network structural characteristics and LTPA levels of participants
A total of 2,639 hypertensive patients were included, with a median age of 65 years (interquartile range [IQR]: 58–70). The detailed sociodemographic and physical-health characteristics of the participants are presented in Table 2.Table 2. Baseline characteristics of the study participants (n = 2639)CharacteristicsOverall (proportion, %)MV-LTPA adherence (rate, %)P valueTotal2639 (100.00)919 (34.82)Sociodemographic characteristicsGender0.009 Male1217 (46.12)392 (32.21) Female1422 (53.88)527 (37.06)Age (Years)0.019 35–88 (3.33)23 (26.14) 45–343 (13.00)100 (29.15) 55–800 (30.31)273 (34.13) 65–1313 (49.75)491 (37.40) 75–8495 (3.61)32 (33.68)Residence< 0.001 Urban852 (32.28)434 (50.94) Suburban902 (34.18)332 (36.81) Rural885 (33.54)153 (17.29)0.009Education level Less than primary school graduation518 (19.63)156 (30.12) Primary school graduation805 (30.50)265 (32.92) Junior high school graduation868 (32.89)330 (38.02) High school graduation or above448 (16.98)168 (37.50)< 0.001Occupation Salaried employment365 (13.83)124 (33.97) Farmer1158 (43.88)257 (22.19) Unemployed1116 (42.29)538 (48.21)< 0.001Personal monthly income (yuan) 0–917 (34.75)255 (27.81) 1000–766 (29.03)267 (34.86) 2000–434 (16.45)185 (42.63) 3000–294 (11.14)134 (45.58) 4000–228 (8.63)78 (34.21)0.007Marital status Non-married38 (1.44)8 (21.05) Married2240 (84.88)760 (33.93) Divorce/separation52 (1.97)21 (40.38) Widowed309 (11.71)130 (42.07)Physical-health characteristics< 0.001Self-rated health Very poor74 (2.80)15 (20.27) Poor352 (13.34)77 (21.88) Fair1113 (42.18)436 (39.17) Good910 (34.48)349 (38.35) Excellent190 (7.20)42 (22.11)0.411BMI Underweight47 (1.78)12 (25.53) Normal weight1104 (41.83)380 (34.42) Overweight1075 (40.74)388 (36.09) Obesity413 (15.65)139 (33.66)Social network structural characteristics^a^ Network size (person)4 (2–5)3 (2–5)< 0.001 Network density (%)77.78(66.67–100.00)100.00(66.67–100.00)< 0.001 LTPA aggregation (%)50.00(25.00–71.43)50.00(33.33–100.00)< 0.001 LTPA heterogeneity0.75(0.00–0.94)0.75(0.00–0.89)< 0.001Abbreviations: LTPA Leisure-time physical activity, MV-LTPA Moderate-to-vigorous intensity leisure-time physical activity, BMI Body mass index^a^The continuous variables with non-normal distribution were described by the median (lower quartile–upper quartile)
During the past week, 70.56% (*n = *1862) of hypertensive patients engaged in L-LTPA for a median of 4 (IQR: 3–6) days/week, totaling 90 (IQR: 45–180) minutes/week. Moreover, 52.71% (1391) participated in M-LTPA for 3 (IQR: 2–5) days/week, totaling 180 (IQR: 60–360) minutes/week. Additionally, 32.21% (850) engaged in V-LTPA for 1 (IQR: 1–2) days/week, totaling 60 (IQR: 30–90) minutes/week. Overall, 63.77% (1683) engaged in MV-LTPA and 34.82% (919) met ≥ 150 min/week of MV-LTPA.
A total of 10,550 social network members were nominated by the 2639 hypertensive patients. Among these ties, 69.06% involved close relatives, with distant relatives (16.86%) and friends (14.08%) comprising the remainder. At the individual level (*n = *2639), the median network size was 4 persons, ranging from 1 to 11. Notably, patients with ≥ 150 min/week of MV-LTPA had smaller networks but higher density and greater LTPA aggregation (Table 2).
Associations of sociodemographic and physical-health characteristics with LTPA
Table 3 identified significant sociodemographic and physical-health characteristics for LTPA outcomes. For MV-LTPA, lower odds were observed in males (vs. females), adults aged 75–84 years (vs. 65–), rural residents (vs. urban), salaried employment or farmers (vs. unemployed), and those reporting very poor, poor or excellent self-rated health (vs. moderate). Higher odds of MV-LTPA occurred in participants with monthly income of 2000– yuan (vs. 0–) and widowed individuals (vs. married). For L-LTPA, only farmers (higher odds) and very poor self-rated health (lower odds) showed significant associations. All P < 0.05.Table 3. Associations of sociodemographic and physical-health characteristics with LTPA (n = 2639)CharacteristicsOR [95% CI] for MV-LTPA adherenceP valueOR [95% CI] for L-LTPA engagementP valueSociodemographic characteristicsGender Male0.735 [0.600–0.900]0.0030.851 [0.699–1.035]0.106 FemaleRefRefAge (Years) 35–0.745 [0.413–1.343]0.3281.695 [0.952–3.019]0.073 45–0.938 [0.658–1.336]0.7211.362 [0.958–1.937]0.085 55–1.162 [0.920–1.467]0.2070.968 [0.771–1.214]0.778 65–RefRef 75–840.423 [0.256–0.698]0.0011.335 [0.810–2.200]0.256Residence UrbanRefRef Suburban0.674 [0.239–1.898]0.4550.844 [0.426–1.674]0.628 Rural0.202 [0.070–0.584]0.0031.892 [0.933–3.836]0.077Education level Less than primary school graduationRefRef Primary school graduation0.930 [0.702–1.231]0.6111.006 [0.764–1.323]0.969 Junior high school graduation1.023 [0.755–1.386]0.8850.906 [0.675–1.216]0.510 High school graduation or above0.880 [0.606–1.279]0.5031.074 [0.747–1.545]0.700Occupation Salaried employment0.697 [0.491–0.989]0.0431.296 [0.919–1.828]0.140 Farmer0.681 [0.508–0.912]0.0101.535 [1.165–2.023]0.002 UnemployedRefRefPersonal monthly income (yuan) 0–RefRef 1000–1.222 [0.938–1.592]0.1380.861 [0.668–1.111]0.249 2000–1.432 [1.026–1.999]0.0350.870 [0.627–1.206]0.403 3000–1.229 [0.825–1.830]0.3110.801 [0.548–1.170]0.252 4000–1.276 [0.814–2.000]0.2880.721 [0.472–1.102]0.130Marital status Non-married0.932 [0.392–2.219]0.8740.691 [0.329–1.451]0.329 MarriedRefRef Divorce/separation1.555 [0.824–2.934]0.1731.476 [0.759–2.871]0.252 Widowed1.439 [1.072–1.932]0.0151.071 [0.799–1.435]0.648Physical-health characteristicsSelf-rated health Very poor0.507 [0.269–0.954]0.0350.320 [0.191–0.538]< 0.001 Poor0.628 [0.458–0.862]0.0040.793 [0.594–1.059]0.116 FairRefRef Good0.870 [0.700–1.082]0.2111.230 [0.991–1.528]0.061 Excellent0.524 [0.340–0.809]0.0041.343 [0.867–2.080]0.187BMI Underweight0.885 [0.410–1.909]0.7550.712 [0.356–1.424]0.337 Normal weightRefRef Overweight1.007 [0.822–1.234]0.9451.056 [0.865–1.288]0.592 Obesity1.108 [0.841–1.459]0.4670.887 [0.681–1.155]0.373Abbreviations: MV-LTPA Moderate-to-vigorous intensity leisure-time physical activity, L-LTPA Light intensity leisure-time physical activity, OR Odds Ratio, 95% CI 95% Confidence Interval, BMI Body mass index
Dose–response relationships between social network metrics and LTPA outcomes
Figure 2 and Table 4 revealed distinct nonlinear patterns between social network metrics and different intensities of LTPA.Fig. 2. Nonlinear associations between social network metrics and LTPA outcomes (individual-level, n = 2639). The figure depicts the relationships of network size, density, LTPA aggregation, and LTPA heterogeneity with the log odds of (a) achieving ≥ 150 minutes/week of MV-LTPA and (b) engaging in L-LTPA. Solid lines: Penalized spline fits from GAMMs; Shaded areas: 95% CI; Dashed vertical lines: Inflection thresholds identified where first derivative = 0 and segment sample size ≥ 10 times the number of predictors. All models adjusted for gender, age, residence, education, occupation, income, marital status, BMI, self-rated health and institution-level random effects. Statistical annotations: edf, effective degrees of freedom; * P < 0.05; † P < 0.00625 (Bonferroni-corrected significance). Abbreviations: LTPA, leisure-time physical activity; MV-LTPA, moderate-to-vigorous intensity leisure-time physical activity; L-LTPA, light intensity leisure-time physical activity; IQV: Index of Qualitative Variation; GAMMs, Generalized additive mixed models; 95% CI, 95% Confidence Interval; BMI, Body mass indexTable 4Linear and segment-specific associations between social network metrics and LTPA outcomes (n = 2639)VariablesLinear model OR [95% CI]P valueSegmented model OR [95% CI]P valueΔ AICOutcome: MV-LTPA adherence Network size (per 1 increase)0.905 [0.858–0.954]< 0.0011–: 0.826 [0.756–0.903]< 0.001−4.4P = 0.0125–11: 1.035 [0.923–1.161]0.558 Network density (per 10% increase)1.103 [1.050–1.159]< 0.0010–: 0.906 [0.788–1.041]0.16564.6–100: 1.191 [1.108–1.279]< 0.001−6.2P = 0.004 LTPA aggregation (per 10% increase)1.086 [1.055–1.118]< 0.001 LTPA heterogeneity (per 0.1 increase)0.997 [0.976–1.019]0.808Outcome: L-LTPA engagement Network size (per 1 increase)0.968 [0.921–1.017]0.200 Network density (per 10% increase)1.068 [1.019–1.119]0.006 LTPA aggregation (per 10% increase)1.031 [1.002–1.061]0.0330–: 1.233 [1.117–1.361]< 0.001−9.9P < 0.00133.3–: 0.878 [0.780–0.988]0.03062.6–100:1.058 [0.970–1.153]0.201 LTPA heterogeneity (per 0.1 increase)1.022 [1.001–1.044]0.044All models adjusted for gender, age, residence, education, occupation, income, marital status, BMI, self-rated health and institution-level random effects. Δ AIC = difference vs. linear modelAbbreviations: MV-LTPA Moderate-to-vigorous intensity leisure-time physical activity, L-LTPA Light intensity leisure-time physical activity, 95% CI 95% Confidence Interval, OR Odds Ratio, BMI Body mass index, AIC Akaike Information Criterion
Network size exhibited a threshold effect for MV-LTPA adherence (effective degrees of freedom [edf] = 2.945, P < 0.001), characterized by a sharp decline in odds as size increased to approximately 5 ties (Odds Ratio [OR] = 0.826, 95% Confidence Interval [CI]: 0.756–0.903), beyond which the effect stabilized. In contrast, its association with L-LTPA engagement was a non-significant linear decrease (edf = 1.646, P = 0.199).
Network density displayed a delayed-onset relationship with MV-LTPA (edf = 2.628, P < 0.001), where the positive effect remained weak until density exceeded about 64.6%, after which it increased sharply (OR = 1.191 per 10% density increase, 95% CI: 1.108–1.279). Whereas for L-LTPA it demonstrated a steady linear increase (edf = 1.000, P = 0.006; OR = 1.068 per 10% density increase, 95% CI: 1.019–1.119).
LTPA aggregation (the proportion of physically active members in one's network) showed a straightforward, linear increase in the odds of meeting ≥ 150 min/week of MV-LTPA (edf = 1.000, P < 0.001; OR = 1.086 per 10% aggregation increase, 95% CI: 1.055–1.118). However, its relationship with L-LTPA was more complex and triphasic (i.e., having three distinct phases, edf = 3.078, P = 0.006). The odds of L-LTPA initially increased as the proportion of active members rose, reaching a peak benefit at around one-third (33.3%) of members being active (OR = 1.233 per 10% aggregation increase, 95% CI: 1.117–1.361). Beyond this peak, the benefit began to diminish, eventually declining to a lower level by the time about 62.6% of members were active (OR = 0.878 per 10% aggregation increase, 95% CI: 0.780–0.988). After that, the effects stabilized.
After adjusting for multiple comparisons, LTPA heterogeneity (the diversity of LTPA levels of members) within a network did not show statistically significant associations with either MV-LTPA or L-LTPA (MV-LTPA: edf = 1.976, P = 0.178; L-LTPA: edf = 2.705, P = 0.044).
Associations between tie members’ LTPA and participants’ LTPA outcomes across different relationships
Stratified mixed-effects logistic regression analyses revealed heterogeneous effects across relationship types (Fig. 3). For participants’ MV-LTPA adherence, spouses' LTPA showed the strongest positive association (OR = 1.967, 95% CI: 1.571–2.463, P < 0.001), remaining statistically significant after Bonferroni correction for 13 subgroups. In contrast, no other relationship type significantly predicted MV-LTPA adherence post-correction. For participants' L-LTPA engagement, spouses' LTPA again demonstrated a positive association (OR = 1.250, 95% CI: 1.003–1.558, P = 0.047). Similarly, children's LTPA was positively associated with L-LTPA engagement (OR = 1.215, 95% CI: 1.025–1.441, P = 0.025). Notably, neighbors' LTPA exhibited an inverse relationship with L-LTPA engagement (OR = 0.274, 95% CI: 0.101–0.743, P = 0.011). However, these three associations with L-LTPA did not survive multiple testing correction. All models accounted for participant covariates and institutional clustering effects.Fig. 3. Forest plots of relationship-specific associations between tie members' LTPA and participant’ LTPA outcomes (relationship-level, n = 10,550). a Odds ratios for achieving ≥ 150 minutes/week of MV-LTPA. b Odds ratios for engaging in L-LTPA. Error bars represent 95% CI. Estimates derived from stratified mixed-effects logistic regression models with covariates (gender, age, residence, occupation, income, marital status and self-rated health) and institution-level random intercepts. Statistical annotations: * Uncorrected P < 0.05; † Significant after Bonferroni correction for 13 subgroups. Abbreviations: LTPA, leisure-time physical activity; MV-LTPA, moderate-to-vigorous intensity leisure-time physical activity; L-LTPA, light intensity leisure-time physical activity; OR, Odds Ratio; 95% CI, 95% Confidence Interval
Qualitative results: social network facilitators and barriers to exercise
The participants in this study were predominantly elderly patients. Their social networks were generally small in scale and structurally homogeneous, with spouses as the core members and a minority involving close family members such as children, children-in-law, and grandchildren. Their daily social engagement was notably limited. This phenomenon can be attributed to multidimensional factors, including: intergenerational separation (e.g., long-term migration of children for employment), time constraints due to household or labor burdens, caregiving responsibilities (e.g., grandchild care), health-related limitations, and a low willingness to socialize (e.g., introversion or deliberate avoidance of interactions).
Grounded theory analysis revealed two themes for social network facilitators: (1) Positive social norms and interactions from network members supporting exercise (e.g., joint workouts, exercise invitations). (2) Social support provided by network members, including informational (sharing exercise benefits), emotional (encouragement), and instrumental support (equipment provision). One theme for social network barriers was identified: Negative social norms and interactions among network members that discourage exercise (e.g., perceptions of exercise as exhausting, or invitations for sedentary activities). Coding details are presented in Table 5.Table 5. Social network facilitators and barriers to exerciseDirectionThemeCategoryCoding1.Facilitators1.1. Positive social norms and interactions among network members supporting exercise1.1.1. Attitudes of network members supporting exercise1.1.1.1. Network members perceive not exercising as an unhealthy lifestyle1.1.2. Behaviors of network members supporting exercise1.1.2.1. Other members in the network exercise regularly1.1.2.2. Network members exercise around the patient1.1.3. Positive interactions between exercising network members and the patient1.1.3.1. The patient lives with exercising network members1.1.3.2. The patient exercises with network members1.1.3.3. Network members invite the patient to exercise together1.2. Social support provided by network members1.2.1. Informational support1.2.1.1. Network members share personal health benefits gained from exercise1.2.1.2. Network members share that exercise helps control blood pressure1.2.1.3. Network members offer suggestions on how to exercise1.2.2. Emotional support1.2.2.1. Network members show concern for health issues related to exercise1.2.2.2. Network members encourage the patient to exercise actively1.2.2.3. Network members provide care when the patient feels sad and does not want to exercise1.2.3. Instrumental support1.2.3.1. Network members buy exercise equipment for the patient1.2.3.2. Network members remind the patient to participate in exercise2. Barriers2.1. Negative social norms and interactions among network members that discourage exercise2.1.1. Negative attitudes of network members towards exercise2.1.1.1. Network members express dissatisfaction with exercise, believing it to be too tiring2.1.2. Behaviors of network members not supporting exercise2.1.2.1. Other members in the network do not exercises2.1.2.2. Network members do not exercise around the patient2.1.3. Negative interactions between non-exercising network members and the patient2.1.3.1. The patient lives with non-exercising network members2.1.3.2. The patient spends leisure time with sedentary network members2.1.3.3. The patient engages in sedentary recreational activities with network members2.1.3.4. Network members invite the patient to engage in sedentary recreational activities
Discussion
MV-LTPA levels and associated determinants
This multi-stage random sampling study of middle-aged and elderly hypertensive patients in Yichang City revealed that 70.56% engaged in L-LTPA, with 34.82% meeting ≥ 150 min/week of MV-LTPA. While this exceeds rates reported in general populations by prior studies [15, 16], it remains substantially lower than figures from developed nations (e.g., 38.2%–50.4% in the US [42]). This disparity highlights contextual differences, in which occupational and domestic activities dominate physical exertion in China, whereas leisure-based activities prevail in Western settings.
Critically, approximately two-thirds of hypertensive patients still fell short of LTPA levels, underscoring an urgent need for targeted interventions. MV-LTPA adherence varied across subgroups. Males exhibited lower MV-LTPA than females, likely due to gendered activity patterns (e.g., work-related exertion vs. household or leisure activities) [15, 43]. Rural residents, agricultural workers and employed individuals also demonstrated poorer MV-LTPA outcomes, aligning with previous studies [15, 42, 44]. These findings emphasize socioeconomic and cultural barriers to LTPA, particularly among vulnerable populations. This study found that married patients exhibited significantly lower MV-LTPA compared to widowed individuals. Evidence indicated that both supportive and stressful marital dynamics could enhance LTPA, suggesting that marital quality may be a more critical determinant rather than mere marital status [45]. Additionally, the observed lower MV-LTPA levels among individuals with poorer self-rated health aligns with the findings of Han [46], though reverse causality warrants caution (e.g., higher LTPA may improve self-rated health through its benefits). Notably, even individuals with excellent self-rated health demonstrated relatively low MV-LTPA levels—a previously unreported phenomenon potentially attributable to exercise neglect driven by overconfidence in health status.
Social network influence on MV-LTPA
Basic structural characteristics
Hypertensive patients predominantly maintained small, kinship-centered networks, consistent with Fei Xiaotong’s differential mode of association theory [33]. A nonlinear association emerged for MV-LTPA, whereby patients with extremely small and tightly-knit core networks were more likely to achieve higher MV-LTPA. This finding expands the theoretical boundaries of network-health behavior relationships, challenging the linear assumptions prevalent in prior research. This is consistent with the negative correlation between family size and higher PA participation reported by Jurj et al. [37]. These also align with social capital theory [47], where core networks (characterized by high density, strong ties, and homogeneity) foster expressive behaviors (e.g., maintaining exercise habits), while loose networks support instrumental actions (e.g., resource acquisition). Qualitative insights suggest two possible explanation: strong ties enhance social support for maintaining exercise routines; larger and looser networks may demand greater social engagement, reducing time available for leisure activities.
However, inconsistent conclusions exist. Research in Latin American and U.S. populations have found positive associations between network size and healthier diabetes-related behaviors [36, 48], while a Swiss study observed no link between network size and weekly exercise frequency [30]. These discrepancies may stem from: (1) cultural heterogeneity: variations in societal perceptions of network functions; (2) methodological limitations: the name-generator method relies on participant recall and artificial nomination caps, potentially underestimating true network size [49]; (3) analytical bias: linear modeling may obscure true non-linear relationships; (4) structure–function disconnect: network features directly tied to health behaviors (e.g., exercise-specific support density) may surpass basic structural metrics in predictive value. These inconsistencies suggest the need to integrate cross-cultural data, employ objective network measurements and non-linear models, and explore functionally oriented network indicators to deepen mechanistic understanding.
LTPA-related structural characteristics
Our study has explored functionally oriented network indicators to deepen mechanistic understanding. We found patients with higher MV-LTPA exhibited significant clustering of physically active members within social networks, independent of sociodemographic and physical health-related factors, which aligns with findings from Western studies [30, 50, 51]. Our qualitative findings further support explanations related to social contagion or social norm effects, indicating individuals’ behavioral choices are influenced by the actions and opinions of significant others [35, 52]. These insights inform intervention strategies, such as identifying “exercise advocates” within networks to leverage peer influence for habit formation, and establishing community-based exercise groups to foster a culture of PA [53, 54]. However, it is important to note that these patterns could also result from selection effects, reflecting a bias in relationship formation toward individuals with similar exercise preferences [55]. Future studies will require longitudinal data to disentangle these pathways.
Key role models in network-driven interventions
Current evidence is lacking on selecting specific network members for inclusion in social network interventions, particularly within China’s sociocultural context. This study identified that among middle-aged and older hypertensive patients, spouses demonstrated significant positive effects on patients’ MV-LTPA levels. These findings aligned with Maia et al. [31] on familial clustering of PA and are further supported by cross-national validation of spousal influence [56, 57], providing an evidence-based rationale for culturally adapted social network interventions. We recommended prioritizing spouses as "exercise role models" in such interventions, particularly in older populations where kinship networks predominate.
Distinct correlates and social mechanisms of L-LTPA
Our findings extend beyond MV-LTPA to elucidate the unique socio-ecological landscape of L-LTPA, revealing behavioral profiles that are distinct in their determinants and social drivers. Unlike MV-LTPA adherence, which was associated with multiple sociodemographic factors, engagement in L-LTPA was independently predicted only by occupation and self-rated health. The higher odds of L-LTPA among farmers are consistent with the lower MV-LTPA previously reported in this population [15, 42], suggesting that high occupational exertion crowds out vigorous leisure activities while promoting lighter ones, as corroborated by our qualitative data. Conversely, the significantly lower odds among those with very poor self-rated health, which aligns with evidence linking LPA group to poorer general health [58]. It suggest that even light activities may be challenging for the most vulnerable patients, highlighting this subgroup as a critical target for supportive, low-intensity interventions.
The social network mechanisms underlying L-LTPA further demonstrate its uniqueness. L-LTPA benefited linearly from higher network density. This stable association suggests that the low-pressure environment of close-knit networks is uniquely suited to sustaining light activities, which demand less mutual reinforcement than MV-LTPA. The triphasic dynamic of LTPA aggregation—where the benefit peaked at a moderate level (approximately one-third) of active members and then declined to a steady level—is a landmark finding. This suggests that a critical mass of active peers provides optimal modeling for light activities without creating normative pressure. However, once active members exceed a majority, individuals may be propelled toward more vigorous exercise. The decline in L-LTPA likely signifies a shift to MV-LTPA, a conclusion supported by the linear increase in MV-LTPA with LTPA aggregation.
At the relationship level, the influence of network members on L-LTPA revealed nuanced patterns, even if some associations did not retain statistical significance after strict correction. The positive associations with spouses and children align with China's kinship-centric social fabric and are theoretically suggestive. The role of spouses, consistent across activity intensities, underscores their central position in chronic disease management within households. Conversely, the observed negative association with neighbors' LTPA warrants further investigation. While non-significant post-correction, it may point to unmeasured confounding factors or reveal a complex social comparison dynamic. Unlike the supportive role of family, neighbors' activity might be perceived as a source of upward social comparison or competition [59, 60], thereby failing to provide the same low-pressure support for light activities and potentially even discouraging engagement.
Implications for practice and policy
This study identifies actionable strategies for improving LTPA among hypertensive patients: (1) Targeted interventions: Prioritize males, rural residents, farmers, and employed subgroups through community-based programs. (2) Network-driven approaches: Integrate social network mechanisms into national fitness initiatives, and leverage exercise activists within patients’ networks (e.g., spouses) as role models. (3) Policy integration: Adopt the "Exercise is Medicine" framework in primary care, empowering general practitioners to prescribe exercise plans in collaboration with sports agencies.
Strengths and limitations
The study’s strengths include: (1) a representative baseline sample from a nationally managed hypertension cohort would facilitate future longitudinal studies and intervention trials, and (2) a mixed-methods design captured both structural and functional network dynamics. However, limitations exist: (1) Findings reflect community-based hypertensive populations in central China; patterns may differ among hospital-based populations or those residing in social contexts dominated by weak ties. (2) Cross-sectional survey precludes causal inferences; longitudinal or interventional studies are needed. (3) Self-reported LTPA may introduce recall bias and overestimation, as evidenced by prior research comparing subjective and objective measures [61]. Additionally, although individuals' behaviors are more strongly influenced by their perceptions of others' actions than by actual behaviors [62], such perceptions may not fully align with objective reality. Future studies should incorporate objective measures (e.g., accelerometer) to bridge gaps among perceived, self-reported, and actual activity data.
Conclusions
This study investigated LTPA levels among Chinese hypertensive patients and explored the influence of social networks as well as their potential for intervention. Although LTPA levels exceed those of the general population, significant gaps persist, particularly among marginalized subgroups. Social networks represent modifiable factors that influence LTPA behaviors. By shaping network structures, fostering positive norms within networks, and strategically engaging key members (e.g., spouses), policymakers and clinicians can design culturally resonant interventions to bridge the LTPA gaps. These insights not only advance behavioral theory but also offer pragmatic solutions for global hypertension management in aging populations.
The reference list from the paper itself. Each links out to its DOI / PubMed record.
- 1WHO guidelines on physical activity and sedentary behaviour. Geneva: World Health Organization; 2020. Licence: CC BY-NC-SA 3.0 IGO. https://iris.who.int/server/api/core/bitstreams/faa 83413-d 89e-4be 9-bb 01-b 24671 aef 7ca/content. Accessed 10 Apr 2025.
- 2General Administration of Sport of China. 2014 National Fitness Activities Survey Bulletin. https://www.sport.gov.cn/n 315/n 329/c 216783/content.html. Accessed 20 Jul 2025.
- 3General Administration of Sport of China. 2020 National Fitness Activities Survey Bulletin. https://www.sport.gov.cn/n 315/n 329/c 24335053/content.html. Accessed 20 Jul 2025.
- 4World Health Organization. Global action plan on physical activity 2018–2030: more active people for a healthier world. Geneva: World Health Organization; 2018. Licence: CC BY-NC-SA 3.0 IGO. https://iris.who.int/server/api/core/bitstreams/33339 c 9c-3a 9f-46d 4-9f 12-ae 9ff 0dfdc 6a/content. Accessed 10 Apr 2025.
- 5World Health Organization. Global status report on physical activity 2022. Geneva: World Health Organization; 2022. Licence: CC BY-NC-SA 3.0 IGO. https://iris.who.int/server/api/core/bitstreams/8804 f 1b 0-dbae-4e 58-a 251-36fd 14dc 7e 02/content. Accessed 10 Apr 2025.