Efficiency in COVID-19 inpatient care: findings from public hospitals in Iran
Rajabali Daroudi, Behzad Raei, Reza Goudarzi, Soheila Damiri, Hossein Ranjbaran, Zahra Shahali

TL;DR
This study analyzed the efficiency of public hospitals in Iran for treating COVID-19 inpatients, finding significant variation in costs and potential for resource savings.
Contribution
The study introduces a risk-adjusted efficiency analysis framework for hospital resource use during the pandemic in Iran.
Findings
Public hospitals in Tehran had the highest per-patient charge for COVID-19 treatment (USD 364.98).
Hospital efficiency scores varied widely, with potential for significant resource savings through standardized clinical practices.
Adjusting for contextual factors slightly changed hospital rankings but maintained a strong correlation with original efficiency scores.
Abstract
Improving efficiency is one of the high-potential options for expanding fiscal space for health. During the pandemic, as health systems’ financial challenges intensify, the importance of utilizing resources efficiently also increases. Therefore, this study was conducted to estimate the efficiency of Iran’s public hospitals in treating COVID-19 inpatient cases. This descriptive-analytical study was based on administrative claims data from the Iran Health Insurance Organization and included 439,327 COVID-19 inpatient cases across 493 public hospitals in 2021. Epidemic waves were first identified using time-series data on daily admissions, and each patient was assigned to the corresponding wave. A logistic regression model was then fitted to estimate the probability of death based on age, sex, ICU admission, and epidemic wave. From this, a risk-adjusted survival variable (RA_surv) was…
Genes, proteins, chemicals, diseases, species, mutations and cell lines named across the full text — each resolved to its canonical identifier and authoritative record.
Click any figure to enlarge with its caption.
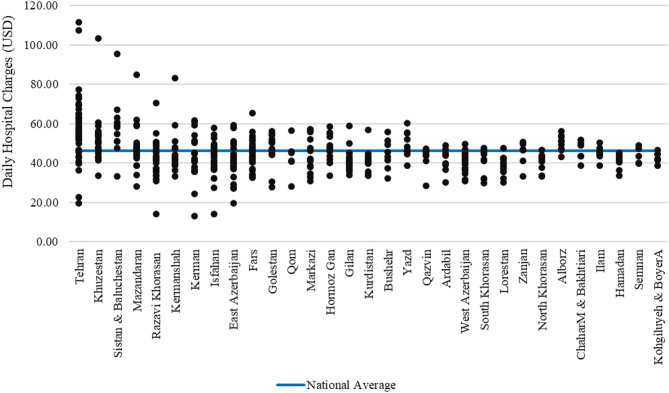 Figure 1
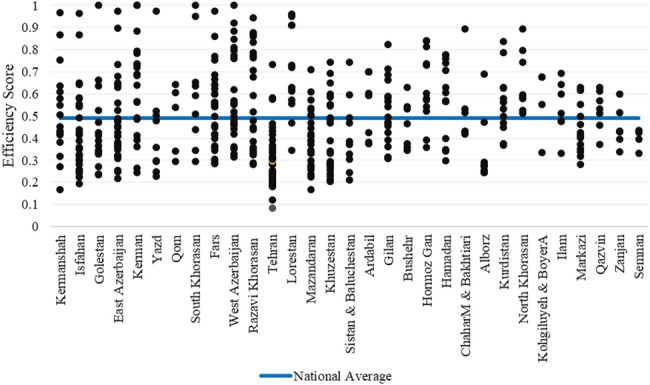 Figure 2
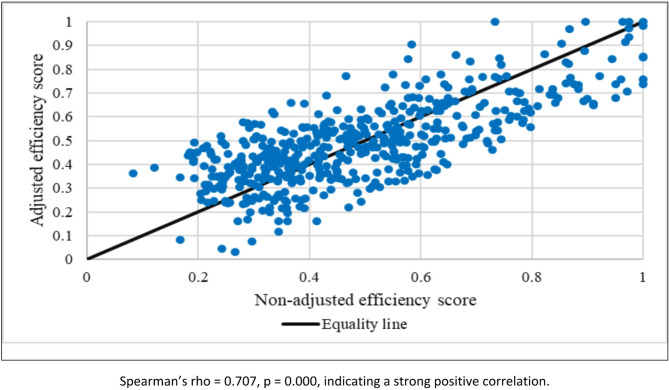 Figure 3
Peer Reviews
No public reviews on file for this paper yet. If you reviewed it on a platform where reviews are public (OpenReview, ICLR, NeurIPS, ICML), you can paste yours below so the community can read it here.
Videos
No videos yet. Explain this paper in a talk, walkthrough, or lecture? Add one.
Taxonomy
TopicsHealthcare Policy and Management · Telemedicine and Telehealth Implementation · Primary Care and Health Outcomes
Introduction
Efficiency is one of the mechanisms for expanding the fiscal space for health because if the same level of outputs can be produced with lower levels of inputs, part of the freed resources can be reallocated within the open health system [1]. The waste of resources in health care systems, amounting to more than one trillion dollars per year, leads to a loss of efficiency, productivity, and wealth generated in other sectors of the economy [2]. Studies show that the increase in the costs of health systems can be partly due to the inefficient use of resources [3]. So, by reducing the waste of resources such as money, manpower, buildings, and equipment, available resources can be used to provide more services or expand access and improve the quality of hospital services [4, 5].
The COVID-19 pandemic has brought about significant social and economic changes worldwide. The impact of the health sector has been greater than that of other sectors, so the system now includes new actors, priorities, interventions, and amplified socio-economic challenges. Its financial and political perspectives have also changed [6]. Estimates indicated that the COVID-19 pandemic imposed a heavy financial burden on hospitals and health systems [7]. For example, the American Hospital Association has estimated the financial impact of this epidemic on hospitals and the American healthcare system in terms of lost income at 50.7 billion per month). In addition, the cost of providing an effective healthcare response to COVID-19 in low- and middle-income countries is estimated at $52 billion (US) every four weeks [8]. Following the created financial needs, governments were forced to mobilize resources for the health sector from budgetary sources. Estimates show that in 2020, the additional budget al.located to European health systems ranged from about 8% of the 2018 health budget in high-income countries to 13% in upper-middle-income countries and 23% in lower-middle-income countries [9].
During the COVID-19 era, several studies with different study designs investigated the efficiency of health systems in responding to this shock at the micro and macro levels. For example, Chia-Yu Su et al. evaluated the comparative performance of 23 countries in reducing the transmission of COVID-19 using the Data Envelopment Analysis (DEA) method [10]. Selamzade et al. employed data DEA with multi-criteria decision-making methods to assess the efficiency of OECD health systems in responding to the COVID-19 pandemic. The study revealed that countries such as Colombia, Denmark, and New Zealand demonstrated higher efficiency, whereas Slovenia and Hungary ranked among the least efficient performers [11]. Kuzior et al. applied frontier-DEA to assess public health system efficiency and COVID-19 resilience across 22 countries, finding Beveridge-type systems highly efficient and resilient, while market-based models exhibited the weakest performance [12]. Breitenbach et al. also analyzed the effectiveness of 36 countries in stabilizing infection prevalence rates and minimizing mortality rates with the DEA [13]. C.O. Henriques in Portugal [14], Fabrizio Pecoraro in Germany, France, Italy, and Spain [15], Mishra in India [16], and Sülkü in Turkey [17] evaluated the efficiency at the hospital level. Overall, these studies consistently employed DEA-based approaches at both national and hospital levels, highlighting cross-country variations in efficiency of health systems during the COVID-19 pandemic.
Due to sanctions and other socio-economic challenges, Iran was affected by the COVID-19 pandemic more than other countries in the Middle East and North Africa (MENA) [18]. According to the provided estimates in 2020 and 2021, about 1,603 and 2,324 years of life per 100,000 people were lost due to mortality and morbidity caused by COVID-19 in Iran [19]. Several estimates of the average cost of COVID-19 infected cases treatment in Iran have been reported in recent years, for example, 59,203,409 IR Rials per patient direct medical costs in 2020 [20], 33,121,029 IR Rials [21], 1434 USD [22] and 1228 (51,578,373 IR Rials) per hospitalized patient [23], etc. However, no national-level study has compared the costs of treating COVID-19 patients across hospitals or examined the efficiency of such expenditures. This study aims to address this gap by analyzing hospitalization data from public hospitals in Iran in 2021.
Methods
In this study, we estimated the efficiency of Iranian public hospitals in managing COVID-19 inpatients in 2021 using the DEA method and subsequently calculated each hospital’s potential cost-saving capacity based on the adjusted efficiency scores. Efficiency and cost-saving capacity were first computed at the hospital level and then aggregated to the provincial level to provide a summarized view of regional variations.
Data and study population
In 2021, Iran had about 1030 hospitals (with 161,377 beds), and 68% of them were public hospitals (with 73.9% of total hospital beds) [24]. Public hospitals are primarily financed by basic health insurance organizations, including the Social Security Organization (SSO), the Iran Health Insurance Organization (IHIO), and the Armed Forces Medical Service Insurance Organization (AFMSIO) [19, 25]. These organizations have established claims assessment mechanisms to ensure billing compliance. Unlike other insurers that still rely on paper-based claim processing, the IHIO uses a computerized system linked to hospital information systems (HIS), ensuring accurate financial data that can be effectively used for policymaking [26]. We used stored patient demographic characteristics and financial data in the IHIO electronic claim processing system for patients admitted to public hospitals in 2021 due to COVID-19. Patients were identified using ICD-10 codes U07.1 (laboratory-confirmed) and U07.2 (clinically/epidemiologically diagnosed, but without laboratory confirmation), in accordance with the Iranian Ministry of Health guidelines [27]. These codes are regularly monitored by insurance auditors, strengthening their reliability despite the possibility of some misclassification.
The analytic sample comprised all inpatients hospitalized for at least one day with a primary diagnosis of COVID-19, while outpatient visits were excluded. Hospitals with minimal COVID-19 caseloads (total length of stay < 500 patient-days) were also excluded to enable meaningful comparisons. The dataset included hospital identifiers, patient demographics, clinical information, and detailed financial data (consultations, medicines, consumables, room and board, laboratory tests, imaging, etc.).
Efficiency measurement
In this study, each hospital was considered a decision-making unit (DMU), and efficiency in managing COVID-19 inpatients was evaluated through four steps: identifying epidemic waves, risk-adjusting survival, measuring efficiency using DEA, and adjusting efficiency scores based on hospital contextual factors.
Efficiency was assessed from the payer’s perspective. Unlike operational efficiency studies that focus on staff, beds, or equipment, this approach is particularly relevant in contexts where expenditure control is a key policy concern and financial data are the most reliable source of information. An input-oriented DEA model under the variable returns-to-scale (VRS) assumption was employed [28, 29]. Total inpatient COVID-19 expenditures were used as the input, and risk-adjusted survival (RA_surv) was estimated via logistic regression, controlling for age, sex, ICU admission, and epidemic wave, which were considered as the output. This specification was designed to capture hospitals’ ability to minimize costs while maintaining patient survival outcomes.
Patient-level risk adjustment
To account for patient case-mix heterogeneity and construct the DEA output variable, risk-adjusted survival was estimated using a logistic regression model. In efficiency analyses, risk-adjusted health outcomes, particularly mortality rates, are commonly treated as undesirable outputs in DEA models. For example, Clement et al. [30] used logistic regression to estimate risk-adjusted mortality and incorporated it with service volumes, while Bilsel and Davutyan [31] applied a similar adjustment in evaluating hospital efficiency in Turkey. In our study, however, we adopted a conceptually equivalent but more intuitive measure: risk-adjusted survival. At the individual level, the following model was fitted:
\documentclass[12pt]{minimal} \usepackage{amsmath} \usepackage{wasysym} \usepackage{amsfonts} \usepackage{amssymb} \usepackage{amsbsy} \usepackage{mathrsfs} \usepackage{upgreek} \setlength{\oddsidemargin}{-69pt} \begin{document}$$\begin{aligned}\:\text{l}\text{o}\text{g}\text{i}\text{t}\left(\text{P}\left({\text{d}\text{e}\text{a}\text{t}\text{h}}_{\text{i}\text{}}\right)\right) & ={\beta\:}_{0}+{\beta\:}_{1}\left({\text{a}\text{g}\text{e}\:\text{g}\text{r}\text{o}\text{u}\text{p}}_{i}\right)+{\beta\:}_{2}\left({\text{s}\text{e}\text{x}}_{i}\right)\\ & +{\beta\:}_{3}\left({\text{I}\text{C}\text{U}\:\text{a}\text{d}\text{m}\text{i}\text{s}\text{s}\text{i}\text{o}\text{n}}_{i}\right)+{\beta\:}_{4}\left({\text{w}\text{a}\text{v}\text{e}}_{i}\right)\end{aligned}$$\end{document}Epidemic waves were identified using smoothed daily admission counts (7-day moving average), and each admission was assigned to a wave category (waves 1–3, with non-wave as reference).
Predicted probabilities of death ( \documentclass[12pt]{minimal} \usepackage{amsmath} \usepackage{wasysym} \usepackage{amsfonts} \usepackage{amssymb} \usepackage{amsbsy} \usepackage{mathrsfs} \usepackage{upgreek} \setlength{\oddsidemargin}{-69pt} \begin{document}$$p\hat{}_i$$\end{document} ) were calculated for each patient. Risk-adjusted survival at the patient level was then defined as:
\documentclass[12pt]{minimal} \usepackage{amsmath} \usepackage{wasysym} \usepackage{amsfonts} \usepackage{amssymb} \usepackage{amsbsy} \usepackage{mathrsfs} \usepackage{upgreek} \setlength{\oddsidemargin}{-69pt} \begin{document}$${\mathrm R{\mathrm A}_-\mathrm{su}\mathrm r\mathrm v}_i=1-\mathrm p{\widehat{}}_i\;$$\end{document}and then aggregated at the hospital level:
\documentclass[12pt]{minimal} \usepackage{amsmath} \usepackage{wasysym} \usepackage{amsfonts} \usepackage{amssymb} \usepackage{amsbsy} \usepackage{mathrsfs} \usepackage{upgreek} \setlength{\oddsidemargin}{-69pt} \begin{document}$$\:{RA\_surv}_{h}={\sum\:}_{i\in\:\text{h}}{RA\_surv}_{i}$$\end{document}Thus, \documentclass[12pt]{minimal} \usepackage{amsmath} \usepackage{wasysym} \usepackage{amsfonts} \usepackage{amssymb} \usepackage{amsbsy} \usepackage{mathrsfs} \usepackage{upgreek} \setlength{\oddsidemargin}{-69pt} \begin{document}$$\:{RA\_surv}_h$$\end{document} reflects the expected number of survivors adjusted for age, sex, ICU admission, and epidemic wave.
Defining a COVID-19 wave is methodologically complex and subject to debate, as different criteria can lead to varying interpretations [32]. While a comprehensive epidemiological exploration of wave dynamics was not the primary aim of this study, we acknowledged these challenges and applied a clear, scientifically grounded, and transparent approach to identify epidemic waves in our dataset. This ensured that our analysis remained methodologically sound without diverging from the specific focus of the study. To delineate distinct epidemic waves, we applied a multi-step time-series analysis of daily hospital admissions for COVID-19. First, daily counts (𝑥_𝑡_) were smoothed using a 7-day centered moving average to reduce short-term fluctuations such as weekday–weekend variations:
\documentclass[12pt]{minimal} \usepackage{amsmath} \usepackage{wasysym} \usepackage{amsfonts} \usepackage{amssymb} \usepackage{amsbsy} \usepackage{mathrsfs} \usepackage{upgreek} \setlength{\oddsidemargin}{-69pt} \begin{document}$$\begin{aligned} & \:{MA7}_{t}=\\ & \frac{{x}_{t-3}+{x}_{t-2}+{x}_{t-1}+{x}_{t}+{x}_{t+1}+{x}_{t+2}+{x}_{t+3}}{7}\end{aligned}$$\end{document}Epidemic peaks were defined as local maxima where:
\documentclass[12pt]{minimal} \usepackage{amsmath} \usepackage{wasysym} \usepackage{amsfonts} \usepackage{amssymb} \usepackage{amsbsy} \usepackage{mathrsfs} \usepackage{upgreek} \setlength{\oddsidemargin}{-69pt} \begin{document}$$\:{MA7}_{t+1}<{MA7}_{t}\:\& \:\:{MA7}_{t-1}<{MA7}_{t}\:$$\end{document}while troughs were defined as local minima where: \documentclass[12pt]{minimal} \usepackage{amsmath} \usepackage{wasysym} \usepackage{amsfonts} \usepackage{amssymb} \usepackage{amsbsy} \usepackage{mathrsfs} \usepackage{upgreek} \setlength{\oddsidemargin}{-69pt} \begin{document}$$\:{MA7}_{t+1}>{MA7}_{t}\:\& \:\:{MA7}_{t-1}>{MA7}_{t}\:$$\end{document}
Each wave was defined from the trough before a peak, through the peak, to the next trough. To keep only meaningful peaks, we applied two filters: at least 20 days between peaks to avoid short-term fluctuations, and a prominence threshold to distinguish peaks from neighboring troughs. The 20-day gap was a conservative empirical choice. Similar approaches using moving averages and local extrema have been reported previously [32, 33].
Contextual adjustment of efficiency scores
To isolate hospital-level contextual influences from the DEA efficiency scores and provide policy-relevant, size-aware comparisons, we modeled the hospital efficiency score 𝜃_ℎ_ ∈ [0,1] using a fractional logit regression (Papke–Wooldridge). This specification is appropriate for bounded outcomes and accommodates the few boundary observations at unity. The model related efficiency to structural characteristics that were not used in the risk adjustment of survival (to avoid double-adjustment), namely teaching status, specialty profile, hospital size, and province fixed effects:
\documentclass[12pt]{minimal} \usepackage{amsmath} \usepackage{wasysym} \usepackage{amsfonts} \usepackage{amssymb} \usepackage{amsbsy} \usepackage{mathrsfs} \usepackage{upgreek} \setlength{\oddsidemargin}{-69pt} \begin{document}$$\begin{aligned}E (\theta_{h} | Z_{h}) & = \text{logit}^{-1} (\beta_{0}+ \beta_{1} Teaching_{h} \\ & + \beta_{2}SingleSpecialty_{h} +\beta_{3}\! \ln(Beds_{h}) \\ & + \gamma_{Province(h)}), \quad w_{h} = CaseVolume_{h}\end{aligned}$$\end{document}Because hospitals treated very different numbers of COVID-19 patients, regressions were estimated with probability weights equal to each hospital’s COVID-19 admission volume (i.e., pweights = case volume), so that estimates reflect the relative importance of higher-volume hospitals. ICU admission and epidemic wave indicators were not included at this stage because they had already been incorporated upstream in the patient-level logistic model used to form the risk-adjusted survival output for DEA; re-including them would constitute post-treatment adjustment of the DEA outcome.
From the fitted model we obtained fitted values \documentclass[12pt]{minimal} \usepackage{amsmath} \usepackage{wasysym} \usepackage{amsfonts} \usepackage{amssymb} \usepackage{amsbsy} \usepackage{mathrsfs} \usepackage{upgreek} \setlength{\oddsidemargin}{-69pt} \begin{document}$$\:\widehat{{\theta\:}_{h}}$$\end{document} . To remove the portion of efficiency associated with contextual factors while preserving the overall scale, we centered fitted values and subtracted them from observed scores:
\documentclass[12pt]{minimal} \usepackage{amsmath} \usepackage{wasysym} \usepackage{amsfonts} \usepackage{amssymb} \usepackage{amsbsy} \usepackage{mathrsfs} \usepackage{upgreek} \setlength{\oddsidemargin}{-69pt} \begin{document}$$\:{\theta\:}_{h}^{adj}={\theta\:}_{h}-({\widehat{\theta\:}}_{h}-\stackrel{-}{\widehat{\theta\:}})$$\end{document}where \documentclass[12pt]{minimal} \usepackage{amsmath} \usepackage{wasysym} \usepackage{amsfonts} \usepackage{amssymb} \usepackage{amsbsy} \usepackage{mathrsfs} \usepackage{upgreek} \setlength{\oddsidemargin}{-69pt} \begin{document}$$\:\stackrel{-}{\widehat{\theta\:}}$$\end{document} is the sample mean of \documentclass[12pt]{minimal} \usepackage{amsmath} \usepackage{wasysym} \usepackage{amsfonts} \usepackage{amssymb} \usepackage{amsbsy} \usepackage{mathrsfs} \usepackage{upgreek} \setlength{\oddsidemargin}{-69pt} \begin{document}$$\:{\widehat{\theta\:}}_{h}$$\end{document} . This yields context-adjusted efficiency scores that are interpretable on the original 0–1 scale.
Estimating cost-saving capacity
For each hospital, the potential cost savings were then computed using the following equation. In this equation, the \documentclass[12pt]{minimal} \usepackage{amsmath} \usepackage{wasysym} \usepackage{amsfonts} \usepackage{amssymb} \usepackage{amsbsy} \usepackage{mathrsfs} \usepackage{upgreek} \setlength{\oddsidemargin}{-69pt} \begin{document}$$\:{\theta\:}_{h}^{adj}$$\end{document} stands for context-adjusted efficiency scores.
\documentclass[12pt]{minimal} \usepackage{amsmath} \usepackage{wasysym} \usepackage{amsfonts} \usepackage{amssymb} \usepackage{amsbsy} \usepackage{mathrsfs} \usepackage{upgreek} \setlength{\oddsidemargin}{-69pt} \begin{document}$$\:{Cost\:Saving\:capacity}_{h}={\text{T}\text{o}\text{t}\text{a}\text{l}\:\text{C}\text{o}\text{s}\text{t}}_{h}\times\:(1-{\theta\:}_{h}^{adj})$$\end{document}Results
Unit cost analysis
This study evaluated data on hospital charges from 439,179 COVID-19-hospitalized patients from 493 Iranian public hospitals (Additional details are available in Additional file 1). Billed amounts paid for inpatient services reached nearly 236.46 (Std. Dev: 185.73). This figure varies among different regions (as grouped by province), ranging from 267.46 in Alborz Province, 265.66 in Khuzestan Province, and 171.37 in South Khorasan Province. The estimated charge for each day of a hospital stay is approximately 26.41, Median: 64.14 in Sistan & Baluchistan Province, 59.59 in Tehran Province, to as low as 39.87 in Lorestan Province. Generally, the main charged groups were medicine and medical supplies (42.00%), followed by hoteling (28.84%), and then visits and consultation (14.21%) (Table 1).
Table 1. Descriptive statistics of COVID-19 inpatient hospital chargesProvinceTotal Charge (USD)Per-patient charges (USD)Per-day charges (USD)The contribution of different service groups to the total chargeMeanSDMedianMeanSDMedianvisithotelingMedicine & medical suppliesimaginglaboratoryOtherMeanSDMeanSDMeanSDMeanSDMeanSDMeanSDEast Azerbaijan5,044,805241.6241.9189.542.420.638.514.17.631.214.341.420.92.33.48.86.92.38.1West Azerbaijan5,937,673211.8174.6174.941.818.638.812.97.029.914.048.520.12.03.25.84.50.95.7Ardabil1,887,112204.5201.6168.940.318.037.913.47.228.912.844.021.83.15.18.66.62.18.2Isfahan7,369,555266.6280.4197.444.322.340.615.28.031.614.035.221.14.56.110.47.13.29.3Alborz2,143,455267.5223.8214.551.630.844.212.86.729.213.346.118.42.13.37.55.02.38.0Ilam1,099,100179.2139.9153.645.519.242.915.18.725.112.250.319.62.13.45.75.21.86.3Bushehr915,521197.6177.2162.843.021.439.517.79.127.412.741.421.02.93.97.26.03.48.6Tehran12,000,000365.0373.4256.259.642.051.213.67.630.414.935.620.03.75.311.47.25.412.5ChaharM& Bakhtiari1,858,093244.2250.9188.247.423.243.717.49.426.311.034.921.94.85.714.28.12.58.1South Khorasan1,436,978171.4164.7140.142.721.239.816.58.327.612.738.022.54.55.611.88.51.66.8Razavi Khorasan7,648,664229.4240.0172.342.821.938.713.78.132.114.638.321.14.14.88.56.23.29.7North Khorasan1,904,478186.0145.2166.444.021.640.813.47.226.612.043.522.04.05.09.78.32.911.4Khuzestan5,884,560265.7264.5194.559.642.648.115.17.628.316.544.721.52.94.15.94.03.110.3Zanjan1,737,208250.1198.6208.447.023.043.513.47.327.312.745.819.92.03.18.45.73.16.1Semnan1,041,931243.7207.0199.045.722.642.211.87.029.513.143.122.43.04.08.86.53.99.4Sistan & Baluchestan1,718,682237.4230.9183.464.141.451.315.28.925.515.442.224.13.64.77.96.65.617.2Fars5,820,122220.0214.7178.545.321.342.114.47.627.112.542.821.93.45.19.16.93.28.7Qazvin1,518,612233.0246.0170.242.923.738.316.57.631.213.835.621.03.54.711.37.31.98.0Qom1,559,689231.2221.2181.441.722.737.612.87.432.114.337.421.83.95.111.28.12.77.2Kurdistan2,712,086209.1203.3167.741.217.538.06.88.528.211.850.117.81.93.45.84.37.210.0Kerman5,175,387218.5220.2171.745.824.341.715.78.627.613.137.722.74.35.010.77.54.112.7Kermanshah3,041,775217.5191.6182.543.820.840.114.58.628.013.445.419.63.14.27.25.61.86.9Kohgiluyeh & BoyerA1,490,249219.8204.4179.142.819.040.321.28.328.612.337.221.12.13.99.27.51.85.8Golestan3,101,441263.8235.8209.548.125.044.114.18.027.613.044.620.63.03.88.66.12.18.6Gilan2,027,770199.2186.3161.841.320.238.113.57.627.213.242.123.23.24.411.88.22.48.1Lorestan3,228,390182.6144.6166.539.918.937.913.97.727.612.745.322.62.84.59.17.81.36.2Mazandaran4,585,425243.3205.9206.247.126.443.014.27.829.014.144.122.23.04.47.85.42.08.5Markazi1,489,480223.0197.7182.345.624.341.314.07.828.513.444.121.12.74.18.77.52.05.9Hormoz Gan2,713,674196.7184.1166.248.223.444.915.88.925.312.542.622.53.64.29.98.12.910.7Hamadan4,195,932225.2174.1194.142.318.340.013.67.128.412.646.920.12.33.67.75.41.16.1Yazd1,582,840229.9210.2194.348.222.544.915.79.126.111.745.921.13.04.17.76.61.75.8Total103,870,687236.5234.5185.746.326.441.614.28.128.813.742.021.73.24.68.96.92.99.4
Figure 1 illustrates the variation of per-day charges across hospitals for each province. Analysis reveals that although difference was found in every province, the range of such differences considerably differed across provinces. In Tehran province, for example, the per-day charges ranged widely from 111.6, thereby highlighting a significant difference across hospitals. Likewise, Khuzestan province had a range between 103.5, whereas Sistan & Baluchistan had fluctuations between 95.6. In contrast, Semnan province and Kohgiluyeh & Boyer Ahmad province had the lowest ranges, with a difference in their respective daily charges of merely 7.9, respectively. Compared to national average figures, provinces such as Tehran not only reflected the highest range difference across hospitals but also had their average daily charges considerably elevated compared to national average figures. In contrast, provinces such as Semnan had a trend towards reporting below national average values (Fig. 1).
Fig. 1. Average daily hospital charges across hospitals by province
The results of the logistic regression model used to estimate patient-level mortality probabilities, which formed the basis for calculating risk-adjusted survival, are presented in Supplementary Table S2. The probability of death was lower during the first wave (OR = 0.94, 95% CI: 0.91–0.97), significantly higher during the second wave (OR = 1.14, 95% CI: 1.11–1.18), and lower again during the third wave (OR = 0.75, 95% CI: 0.72–0.78), compared with periods outside the epidemic waves. Age was strongly associated with increased mortality. Patients aged 21–50 years had nearly twice the odds of death compared with those younger than 20 years (OR = 1.91, 95% CI: 1.76–2.08), and patients older than 50 years had more than sixfold higher odds (OR = 6.48, 95% CI: 5.99–7.01). Female patients had a lower death probability than male patients, with an odds ratio of 0.79 (95% CI: 0.77–0.81). ICU admission emerged as the strongest predictor, with patients admitted to intensive care having more than 15-fold higher odds of death (OR = 15.1, 95% CI: 14.8–15.5).
The analysis of hospital efficiency scores in the baseline model (before adjustment for contextual factors) indicates that overall scores across the country ranged from 0.083 to 1.00. Figure 2 presents the estimated efficiency scores of all hospitals, categorized by province. As shown, Kermanshah province (range: 0.167–0.968) exhibited the widest variation in hospital efficiency scores, whereas Semnan province (range: 0.331–0.434) showed the narrowest variation. Full efficiency scores (1.00) were observed in several provinces, with the highest frequency recorded in Kerman province, where three hospitals achieved the maximum score. Comparing hospital efficiency scores with the national average of 0.498 reveals that in provinces such as Tehran and Mazandaran, a larger proportion of hospitals scored below the national benchmark. In contrast, Lorestan province had the majority of its hospitals scoring above the national average. These findings highlight the substantial heterogeneity in efficiency across hospitals and provinces in Iran.
Fig. 2. Distribution of hospital efficiency scores across provinces (before adjustment for contextual variables)
The results of the fractional logit regression, which assessed the association between hospital contextual factors and efficiency scores used to obtain the adjusted efficiency values, are presented in Supplementary Table S3. Teaching status was not significantly associated with efficiency, whereas being a single-specialty hospital was negatively associated with efficiency (β = − 0.339, p = 0.050; marginal effect = − 0.084, p = 0.053). Larger hospitals demonstrated higher efficiency, as indicated by the positive effect of ln(beds) (β = 0.158, p = 0.016; marginal effect = 0.038, p = 0.015). Substantial regional heterogeneity was observed: hospitals in West Azerbaijan, North Khorasan, Kerman, Lorestan, and Hormozgān had significantly higher efficiency compared to the reference province (East Azerbaijan), while hospitals in Tehran and Semnan had lower efficiency scores.
Table 2 compares hospital efficiency scores before and after contextual adjustment using fractional logit regression, as well as the corresponding potential cost-saving capacity. At the national level, the mean DEA efficiency score was 0.49 (SE = 0.01; median = 0.48). After contextual adjustment, the mean score remained stable (0.49), but quartile distributions shifted, indicating re-ranking of hospitals once teaching status, specialty, size, and province were accounted for. Provinces such as North Khorasan, Lorestan, and Kerman showed relatively higher non-adjusted efficiency, while Tehran, Semnan, and Mazandaran recorded lower scores. Adjustment attenuated some of these differences, suggesting that part of the variation reflected structural or regional factors rather than intrinsic performance. Potential cost-saving capacity also varied substantially: in the unadjusted model, savings were concentrated in provinces with lower raw efficiency (e.g., Tehran, Isfahan, Khuzestan), whereas adjusted estimates redistributed potential savings more evenly across regions. Overall, the adjusted results provide a more equitable basis for cross-provincial comparisons of efficiency and cost-saving opportunities.
Table 2. Results for efficiency measurement and cost-saving potential estimationNon-adjusted DEA efficiencyAdjusted efficiency (fractional logit)ProvinceEfficiency scoreHospital distribution in efficiency quartiles (%)Potential savings (USD)Efficiency scoreHospital distribution in efficiency quartiles (%)Potential savings(USD)MeanSDMedianQ1Q2Q3Q4MeanSDMedianQ1Q2Q3Q4East Azerbaijan0.4730.1900.43825.032.117.925.02,467,5470.4930.1960.43828.628.617.925.02,472,162West Azerbaijan0.590.2010.5428.024.032.036.01,812,7130.4480.1890.42048.016.04.032.02,751,736Ardabil0.5970.1760.6030.033.322.244.4514,4300.4440.1630.47633.322.222.222.2858,784Isfahan0.4240.1800.35642.424.221.212.13,945,2540.5180.1670.47215.236.421.227.33,478,060Alborz0.3240.1460.27480.00.010.010.01,218,2460.4280.1600.38140.040.010.010.0997,960Ilam0.5140.1250.49612.512.550.025.0508,0640.5200.1290.49312.525.025.037.5510,359Bushehr0.5130.1710.5010.050.025.025.0421,5160.5250.1740.50612.525.050.012.5435,858Tehran0.3020.1240.28775.018.24.52.38,368,3970.5430.1340.5062.331.840.925.05,744,693ChaharM & Bakhtiari0.5380.1660.5150.042.942.914.3823,3550.5160.1730.47214.342.928.614.3918,437South Khorasan0.5990.2310.58310.020.030.040.0385,7910.4170.2390.39940.030.010.020.0665,781Razavi Khorasan0.5550.2220.48619.226.915.438.52,526,6040.4400.2070.36950.011.57.730.83,651,751North Khorasan0.690.1680.5960.00.055.644.4398,8720.4590.1550.37344.411.122.222.2861,218Khuzestan0.3990.1730.33850.08.329.212.53,018,9230.4750.1880.39741.712.516.729.22,713,244Zanjan0.4340.0950.42714.357.128.60.0881,1160.5120.0750.5120.028.657.114.3788,353Semnan0.4060.0450.42620.080.00.00.0599,0390.5380.0260.5420.00.0100.00.0475,001Sistan & Baluchestan0.4160.1560.38436.427.327.39.1994,3780.5230.1540.51118.218.236.427.3827,479Fars0.5330.1680.54612.525.034.428.12,436,2640.5030.1690.50921.925.028.125.02,785,067Qazvin0.5030.1070.52412.525.037.525.0697,1790.5260.1080.5060.025.037.537.5704,231Qom0.5710.2530.57216.716.733.333.3603,6350.4760.2760.45233.333.316.716.7777,621Kurdistan0.5460.1480.5340.030.838.530.8999,9450.4780.1250.49023.123.138.515.41,246,841Kerman0.630.2190.6829.514.319.057.11,210,3400.4260.2220.49838.19.528.623.82,422,424Kermanshah0.5170.2060.47317.629.423.529.41,297,8010.4610.2130.45241.217.617.623.51,498,790Kohgiluyeh & BoyerA0.5950.1590.67520.00.020.060.0512,4900.4860.1470.55620.020.040.020.0677,542Golestan0.4350.1970.37737.531.312.518.81,798,7550.5490.1840.51012.531.331.325.01,479,400Gilan0.5020.1490.47215.826.336.821.1935,5570.5200.1560.50515.826.326.331.6944,516Lorestan0.6880.1870.6380.07.121.471.4671,2260.4430.1850.38935.728.67.128.61,482,337Mazandaran0.3940.1320.38138.530.823.17.72,544,7840.5060.1320.46415.438.515.430.82,111,181Markazi0.4430.1110.41914.350.021.414.3740,9750.4960.0960.4847.135.742.914.3682,359Hormoz Gan0.6110.1700.5780.023.138.538.5796,8120.4650.1650.44030.823.123.123.11,250,647Hamadan0.5650.1720.5686.726.726.740.01,648,1110.5100.1620.50826.713.326.733.31,976,208Yazd0.4390.2180.41940.010.040.010.0816,1230.4540.2210.44440.030.020.010.0815,594Total0.4900.1970.467----52,190,8160.4930.1960.478----52,265,335
Figure 3 illustrates the scatter plot of non-adjusted versus adjusted efficiency scores across hospitals. The points cluster around the equality line (y = x), highlighting a strong association between the two measures. Nevertheless, the distribution reveals that efficiency scores increased after adjustment for about 52% of the hospitals, while approximately 47% experienced a decline. In just one case, the adjusted and non-adjusted scores were identical. The Spearman correlation between the non-adjusted efficiency score and the Adjusted efficiency score was 0.707, which was statistically significant at the 0.01 level (p = 0.000). This finding indicates a strong positive correlation between the two efficiency measures, such that higher non-adjusted efficiency values are associated with higher adjusted efficiency values.
Fig. 3. Scatter plot of adjusted and non-adjusted hospital efficiency scores
Discussion
This study aimed to assess the efficiency of public hospitals in Iran in managing hospitalized COVID-19 patients and to estimate the potential cost-saving capacity. Data from over 439,000 admissions across 493 hospitals in 2021 were analyzed, and efficiency scores were calculated using an input-oriented DEA model, with hospital charges as inputs and risk-adjusted survival as outputs. The scores were subsequently adjusted based on hospital structural characteristics, yielding a mean efficiency of 0.49.SS. Several studies have been conducted in Iran to evaluate the efficiency of hospitals using various perspectives and methodologies. For example, in Malekzadeh et al.‘s study, which employed the Pabon Lasso approach, it was demonstrated that the efficiency of units in general hospitals decreased at the onset of the epidemic [34]. Raadabadi et al.‘s study in the west of Iran [35] and Mahmoodi et al.‘s study in one of the eastern provinces of Iran, with the Pabon Lasso method, reports similar results [36]. Mirmozaffari et al. investigated the efficiency of 56 hospitals during the COVID-19 pandemic using two DEA approaches and random frontier analysis (SFA). The average scores estimated using these methods were 0.87 and 0.84, respectively. in this study, in addition to cost, they also considered other inputs such as human power, the number of hospital beds, etc [25]. Although there are considerable differences in the settings and methodological approaches of these studies, their overall findings consistently emphasize that there has been a substantial potential for improving the efficiency of Iran’s health system during the COVID-19 era.
The potential for resource savings in crises such as COVID-19 is a critical concern for health insurance organizations. In this study, instead of operational resources such as human resources, including physicians, and hospital infrastructures, hospital charges were used as the input. Despite considerable variation across hospitals, the average charge per admitted COVID-19 patient was USD 236.46 (median USD 185.73), and per hospital day USD 46.34 (median USD 41.62). Medications and consumables (42.01%), hoteling services (28.85%), and physician visits (14.21%) were the largest cost categories. In recent years, several studies have estimated hospitalization costs of COVID-19 or the broader economic burden at national or sub-national levels. Owing to differences in methodology, study setting, exchange-rate conversion, and study period, a wide range of mean costs has been reported. For example, Khandehroo et al. analyzed 1,015 hospitalized patients in a teaching hospital and found an average charge of 77,107,720 IRR (≈ USD 2,461 PPP) and a median of 42,410,477 IRR, with medications and consumables comprising nearly 37% of total costs [37]. Ramezani-Doroh et al. analyzed 909 hospitalized COVID-19 patients in Sina Hospital, Hamedan, and reported a median inpatient cost of USD 134.48 (range: 19.19–2,397.54), with higher costs observed in patients with longer stays (>9 days, median USD 507.30). Medications and consumables accounted for the largest share of expenses, comprising nearly 58% of total costs [38]. Damiri et al. analyzed data from 1,324 hospitalized COVID-19 patients at Imam Khomeini Hospital in Tehran University of Medical Sciences and found an average inpatient charge of 33,121,029 IRR (≈ USD 209.22) [21]. Haji Aghajani et al. analyzed 991 hospitalized COVID-19 patients in Imam Hossein Hospital, Tehran, and reported a median hospitalization cost of USD 271.1 (IQR 170.7–489.6). Hoteling services and medications comprised the largest share of expenditures [39].
About 52,190,816 and $52,265,335, respectively (51.00% and 51.07% of total charges). In this study, only the hospital bills of the IHIO-insured population, who constitute almost half of the country’s population (42,158,648 from 84,055,000), have been included, so about twice this amount could be saved in the inpatient sector of Iran’s health system. Generally, the study’s results reflect the high capacity of saving financial resources available for the Iranian health system during the pandemic. The relatively low to moderate efficiency of Iran’s health system in responding to the COVID-19 pandemic has also been confirmed in other studies. For example, Breitenbach et al. conducted an input-oriented DEA of 36 countries, assessing health system efficiency in managing COVID-19 under three alternative models that differed in their outputs (recovery-to-infection ratio, recovery-to-death ratio, and total recoveries). The average technical efficiency score across countries was approximately 0.53, whereas Iran consistently exhibited lower efficiency (around 0.33) across all models, highlighting considerable potential for improving resource allocation compared with other countries [13]. Babaei-Meybodi et al. evaluated the efficiency of 50 countries in managing COVID-19 during April–June 2020 using an input-oriented, two-stage DEA BCC model with Variable Returns to Scale. The first stage assessed outbreak control (inputs: population, number of tests, outbreak duration; output: confirmed cases), while the second examined treatment (inputs: confirmed cases, health expenditure; outputs: recoveries and deaths). Mean efficiency scores across countries varied by period, averaging 0.5152, 0.4423, and 0.5210 for Stage 1, and 0.4900, 0.3500, and 0.4700 for Stage 2. Iran ranked 10th overall with an average efficiency of 0.6592, scoring 1.0000, 0.0583, and 0.0641 in Stage 1 and 0.9443, 0.8329, and 0.3741 in Stage 2 [40]. The results indicated a considerable variation in efficiency scores across provinces, such that in the adjusted model, provinces like Semnan (0.54), Tehran (0.54), and Golestan (0.55) demonstrated higher levels of efficiency, while provinces such as South Khorasan (0.42), Alborz (0.43), and Kerman (0.43) showed lower values. This inter-provincial variation, along with intra-provincial heterogeneity, may reflect the significant role of managerial differences, infrastructural capacity, and resource allocation in shaping hospital performance during the COVID-19 crisis. Such differences in the efficiency of various subsectors of Iran’s health system across regions are not limited to COVID-19. Similar patterns have also been reported in studies evaluating the overall efficiency of hospitals under non-pandemic conditions, as well as in areas such as primary care systems. For instance, Shaker et al., using Data Envelopment Analysis (DEA), evaluated the technical efficiency of financial and human resources in public hospitals across 31 provinces. Efficiency scores varied widely: East Azerbaijan, Razavi Khorasan, and Gilan reached full efficiency [1], while Hamadan and Kerman scored below 0.3 [41]. Iran has been under severe economic sanctions at the same time as the pandemic, a situation that compromised Iran’s health system. Although medicines and medical equipment are exempted from the economic sanctions, the direct and indirect effects of sanctions have restricted Iran’s banking system and consequently have led to a wide range of limitations on trade, manufacturing sector, insurance, and ventures [42]. This situation increases the need to adopt appropriate strategies to improve efficiency.
On average, about 42% of each patient’s bill costs were the costs of medicine and medical consumables, so this group can be considered the most important driver of costs. Koushk et al. in a study in a systematic review have categorized various strategies and actions proposed in the literature for in-hospital drug cost containment into 5 groups: Procurement, Storage, Distribution, Prescription, and Use. Some measures related to prescription and use are prevention from duplication prevention, Substitution of less expensive alternatives, Rules and regulations, prescription of generic drugs, regularly ranking and limiting the use of top-ranked drugs, A computerized decision-support program connected to computer-based patient records, Physician education, The rounding of drug dosages, Returning patients surplus drugs and deliver to hospital pharmacy [43].
The second group with the highest bill shares was hoteling services (charges for hospital beds and nursing care in intensive/non-intensive care units). On average, this group accounts for about 29% of the bill. Increasing the length of stay in the hospital and being cared for in intensive care units increases the share of this group in the bill. Several studies have provided estimates of the length of stay (LOS) for patients with COVID-19. For example, on average, 4.8 days to 8 days in different provinces of Iran [44], and 4.94 days in Hormozgan Province of Iran [45]. In the systematic review and meta-analysis conducted by Mohammadi et al., the mean LOS was reported to be 15.35 days [46]. One of the reasons for increasing the hoteling charges in the bill can be being under care in the ICU, which is one of the relatively expensive services in health systems [47]. For example, in Iran, the per-day charge for ICU care at a public hospital in 2021 was 12,159,000 IRR, while it was 2,620,000 IRR for per-day non-ICU care simultaneously [48]. Evidence from different settings has shown that many hospital stays were unnecessary and inappropriate. Moradi et al. in a study in a specialized burn hospital, reported that about 28.5% of the patients had at least 1 day of inappropriate stay, and about 6% of the total hospitalization days were inappropriate [49]. In a systematic review and meta-analysis, Arab-Zozani et al. showed that in Iran, the overall rate of inappropriate ICU admissions was 12.3% [50]. Developing clinical guidelines, and their education and providing appropriate motivation to follow them in clinical environments can be effective strategies to reduce clinical practice variations, clinical care quality assurance, and improve efficiency. Clinical guidelines are “statements that include recommendations intended to optimize patient care that is informed by a systematic review of evidence and an assessment of the benefits and harms of alternative care options”. They have the potential to reduce unwarranted practice variation, enhance the translation of research into practice, and improve healthcare quality and safety if developed and implemented according to international standards [51]. The evidence shows that paper-based clinical guidelines are used less in practice, and the development of Clinical Decision Support Systems (CDSS) can significantly contribute to the up-to-date use of international clinical evidence gathered in the form of clinical guidelines [52].
This study has several strengths. The main strength of this study is its dataset. It includes more than 439,000 hospital records from 493 public hospitals across the country. Having such a large and diverse dataset gives a solid base for analysis and makes the results more reliable and applicable. Second, the methodological framework is innovative: by combining data envelopment analysis (DEA) with risk-adjusted survival measures and complementary regression approaches, the study offers a more refined understanding of hospital efficiency. Third, looking at the data from the perspective of the national health insurer offers useful insights for policy, especially regarding resource allocation and financial planning during crises. At the same time, some limitations need to be noted. The DEA model relied on a relatively small set of inputs and outputs, which means it may not fully reflect all aspects of hospital performance. To address this, we included risk-adjusted survival measures and variables related to epidemic waves, helping to account for differences between patients and changes over time. Another challenge comes from the diversity among hospitals. Differences in size, teaching status, and available resources can make direct comparisons difficult. We partly addressed this by using regression analyses to adjust for these contextual factors. A further limitation of this study is the absence of detailed clinical information, such as specific comorbidities or laboratory findings, which would have enabled a more precise adjustment for patient case-mix differences. To partly address this gap, patient age and ICU admission were used as proxy indicators of disease severity, and risk-adjusted survival was incorporated as the output in the DEA model to account, as far as possible, for underlying variations in clinical complexity across hospitals. These measures helped reduce, though not eliminate, the potential bias arising from differences in patient complexity across hospitals. Finally, although data from 2020 were available, our analysis focused on 2021. This was done to avoid distortions caused by the health system’s initial unpreparedness during the early months of the pandemic. By 2021, hospitals were assumed to be operating under more stable conditions.
Future research should build on this work by incorporating richer clinical and structural indicators including comorbidities, treatment modalities, and hospital resource measures to provide a more comprehensive picture of efficiency determinants. In addition, a deeper exploration of temporal dynamics, such as the impact of different pandemic waves, resource shortages, and workforce pressures, would offer further insights into efficiency variations under crisis conditions. Such efforts can help inform evidence-based and equitable policies aimed at strengthening the resilience of health systems in the face of future public health emergencies.
Conclusion
This study is the first nationwide effort in Iran to evaluate how efficiently public hospitals managed patients hospitalized with COVID-19, using routinely collected administrative data. The findings revealed wide differences in daily hospital charges and indicated that, on average, hospitals operated below their optimal efficiency levels. These results suggest that there remains meaningful potential to improve the use of available resources through well-designed policy and management reforms. Drawing on these findings, several directions can guide policymakers and health system managers:
- Strengthen adherence to clinical guidelines to reduce unwarranted variations in care and enhance consistency across hospitals.
- Expand the use of decision-support and monitoring tools that enable data-driven management and timely performance feedback.
- Adopt targeted charge-control and budgeting strategies to improve cost containment while safeguarding patient outcomes.
- Encourage evidence-based efficiency benchmarking across hospitals to identify best practices and guide capacity adjustments.
Despite certain limitations, this study captures an overall picture of hospital performance and spending patterns across Iran during the COVID-19 pandemic. The insights gained can support policymakers in designing strategies that enhance the system’s financial sustainability and operational readiness for future health challenges. Finally, this study makes a unique contribution by combining a payer-perspective DEA approach with risk-adjusted survival as an output indicator. This analytical design has not been previously applied to hospital efficiency evaluation in Iran.
Supplementary Information
Supplementary Material 1.
Supplementary Material 2.
Supplementary Material 3.
The reference list from the paper itself. Each links out to its DOI / PubMed record.
- 1World Health Organization. Spending on health in Europe: entering a new era Copenhagen: WHO Regional Office for Europe. 2021. Available from: https://iris.who.int/bitstream/handle/10665/340910/9789289055079-eng.pdf?sequence=1&is Allowed=y.
- 2United Nations. UN Iran socio-economic recovery programme against the impact of. COVID-19. 2020. Available from: https://www.undp.org/sites/g/files/zskgke 326/files/migration/ir/ed 815d 9fcb 36963 c 575d 3c 16b 09163564 da 1afd 8e 960cdbaa 4c 0d 08a 5d 8ad 3b 2.pdf.
- 3ICD-10 Version. 2019. International Statistical Classification of Diseases and Related Health Problems 10th Revision (ICD-10)-WHO Version for;2019-covid-expanded. 2024. Available from: https://icd.who.int/browse 10/2019/en#/U 07.1.
- 4Alimohamadi Y, Yekta EM, Sepandi M, Sharafoddin M, Arshadi M, Hesari E. Hospital length of stay for COVID-19 patients: a systematic review and meta-analysis. Multidisciplinary Respiratory Med. 2022;17(1).10.4081/mrm.2022.856PMC 947233436117876 · doi ↗ · pubmed ↗