Generation and characterization of a knockout mouse of an enhancer of EBF3
Emily Cordova Hurtado, Janine M. Wotton, Alexander Gulka, Crystal Burke, Jeffrey K. Ng, Ibrahim Bah, Juana Manuel, Hillary Heins, Stephen A. Murray, David U. Gorkin, Jacqueline K. White, Kevin A. Peterson, Tychele N. Turner

TL;DR
This study creates and analyzes a mouse model with a deletion in a regulatory region linked to neurodevelopmental disorders, showing reduced gene expression and sex-specific behavioral differences.
Contribution
The study introduces a novel mouse model with a deletion in the Rr169617 enhancer and demonstrates its impact on Ebf3 expression and behavior.
Findings
Deletion of the Rr169617 enhancer leads to reduced Ebf3 expression in mice.
Rr169617−/− mice show sex-specific differences in mobility and body composition.
Dysregulated genes in knockout mice include those related to histones and brain development.
Abstract
Genomic studies of neurodevelopmental disorders (NDDs) have identified several relevant genomic variants. EBF3 is a gene with an excess of protein-coding de novo variants and underlies Hypotonia, Ataxia, and Delayed Development Syndrome. We previously identified noncoding de novo variants in an enhancer of EBF3 and further found enrichment of deletions of this enhancer in NDDs. In this study, we generated a novel mouse line that deletes the highly conserved, orthologous mouse region within the Rr169617 regulatory region, and characterized the molecular and phenotypic aspects of this mouse model. We found a deviation from Mendelian expectation (P=0.02) with significant depletion of the deletion allele (P=5.8×10⁻⁴). Rr169617+/− mice had a reduction of Ebf3 expression by 10% and Rr169617−/− mice had a reduction by 20%. Differential expression analyses in E12.5 forebrain, midbrain, and…
Genes, proteins, chemicals, diseases, species, mutations and cell lines named across the full text — each resolved to its canonical identifier and authoritative record.
Click any figure to enlarge with its caption.
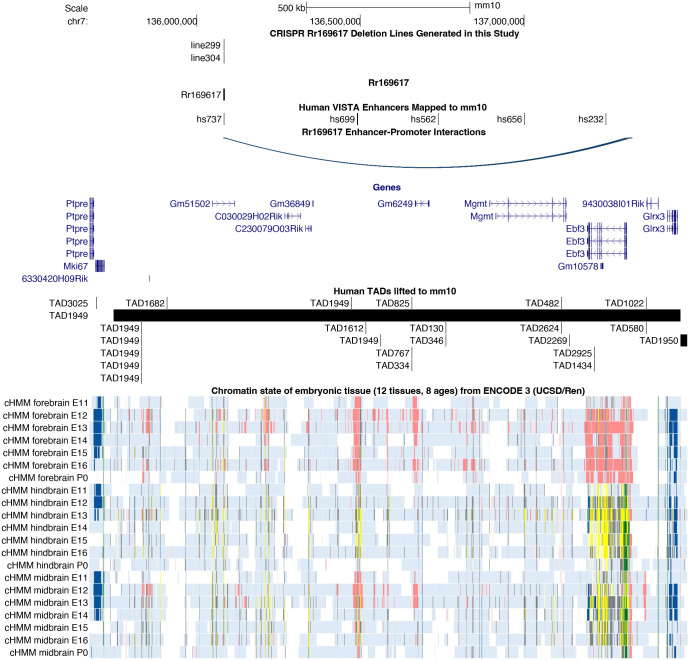 Fig. 1
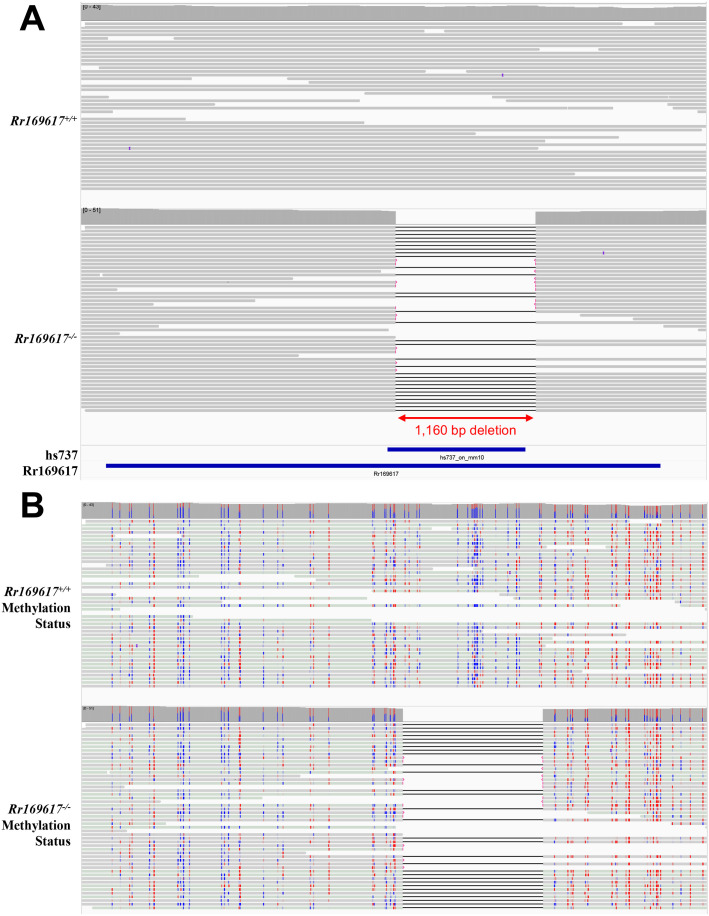 Fig. 2
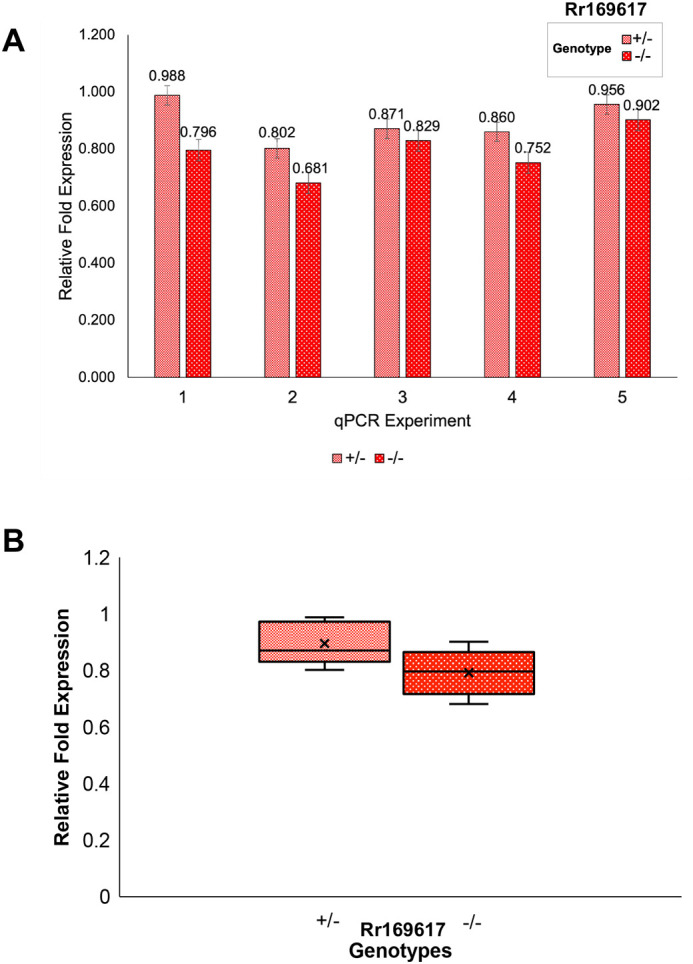 Fig. 3
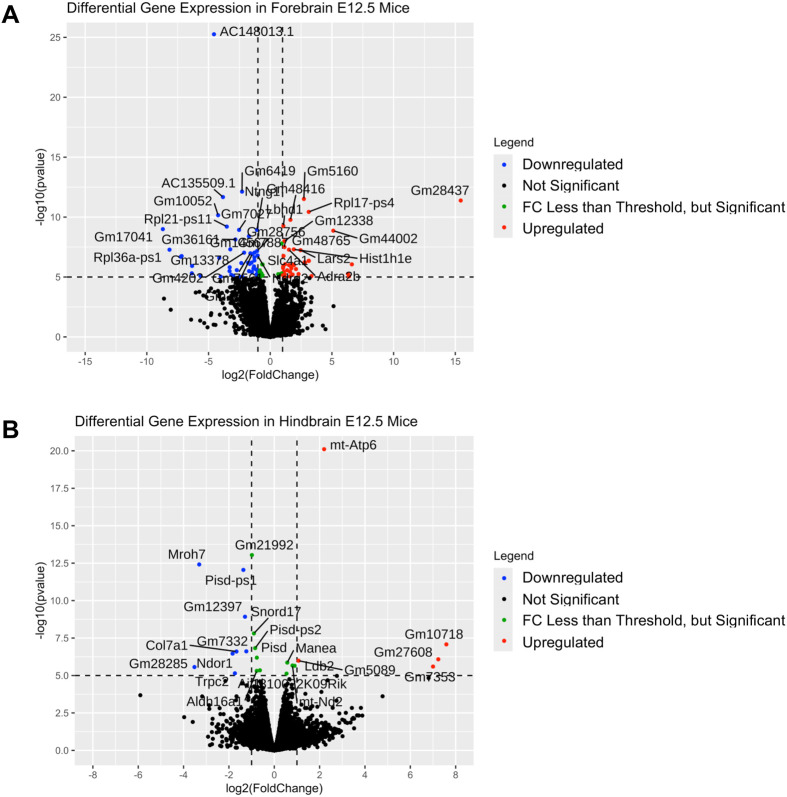 Fig. 4
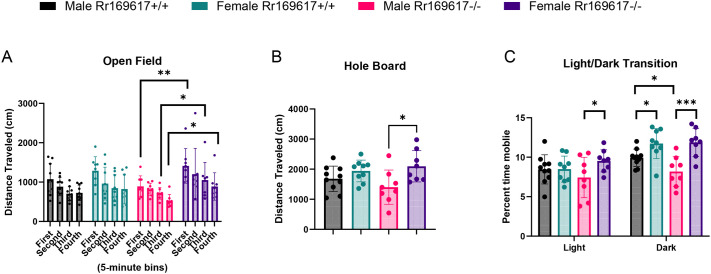 Fig. 5
- —National Institutes of Healthhttp://dx.doi.org/10.13039/100000002
- —McDonnell Center for Cellular and Molecular Neurobiology, Washington University in St. Louishttp://dx.doi.org/10.13039/100020522
Peer Reviews
No public reviews on file for this paper yet. If you reviewed it on a platform where reviews are public (OpenReview, ICLR, NeurIPS, ICML), you can paste yours below so the community can read it here.
Videos
No videos yet. Explain this paper in a talk, walkthrough, or lecture? Add one.
Taxonomy
TopicsAutism Spectrum Disorder Research · Congenital heart defects research · Animal Genetics and Reproduction
INTRODUCTION
Autism is a neurodevelopmental disorder with high heritability (Bai et al., 2019; Sandin et al., 2017). Several studies focusing on exome sequencing have identified de novo variants (DNVs) that disrupt genes (De Rubeis et al., 2014; Dong et al., 2014; Iossifov et al., 2014, 2012; Sanders et al., 2012; Krumm et al., 2015; O'Roak et al., 2011, 2014, 2012a,b; De Rubeis and Buxbaum, 2015). Other genetic factors include large copy number variants (Coe et al., 2014; Cooper et al., 2011; Girirajan et al., 2013; Krumm et al., 2013, 2015; Sanders et al., 2011, 2015; Levy et al., 2011; Marshall et al., 2008; Pinto et al., 2010) and common variants contributing to polygenic risk (Weiner et al., 2017), respectively. A contribution from noncoding DNVs has also been identified from studies using whole-genome sequencing (Turner et al., 2017, 2016; An et al., 2018; Werling et al., 2018; Brandler et al., 2018, 2016; Padhi et al., 2021; Markenscoff-Papadimitriou et al., 2020; Zhou et al., 2019). We previously identified an enhancer, hs737, with an excess of noncoding DNVs in individuals with autism (Padhi et al., 2021). This enhancer targets the gene EBF3 that is the underlying gene for Hypotonia, Ataxia, and Delayed Development Syndrome (HADDS). Protein-coding DNVs of EBF3 are also known to be genome-wide significant for excess in neurodevelopmental disorders (Chao et al., 2017; Harms et al., 2017; Sleven et al., 2017; Padhi et al., 2021; Ignatius et al., 2022). When comparing individuals with protein-coding DNVs in EBF3 to those with noncoding DNVs in hs737, that affects EBF3, we found that individuals with protein-coding DNVs are more severe in their phenotype (Padhi et al., 2021). Beyond single point variants in this enhancer, we also previously showed that it does not deviate from the copy number of two in 56,256 alleles from individuals who do not have neurodevelopmental disorders (Padhi et al., 2021). However, it is enriched for deletions and nominally enriched for duplications in individuals with neurodevelopmental disorders (Padhi et al., 2021).
The EBF3 gene encodes a transcription factor that preferentially binds to the promoters of other transcription factors and chromatin-binding proteins involved in neurodevelopmental disorders (NDDs) (e.g. CHD2, CHD8, ARID1B) (Padhi et al., 2021). This gene is a member of the EBF gene family, which includes EBF1, EBF2, EBF3, and EBF4 (Liberg et al., 2002), and is known to form homodimers or heterodimers with itself or other family members, respectively. It is known to be regulated by the X chromosome gene ARX that is also involved in NDDs. It resides in a large TAD region in the genome of ∼2 Mbp and several regulatory regions of EBF3 exist within the TAD. The hs737 enhancer is ∼1.5 Mbp from the promoter of EBF3 and has been shown to contact the promoter (Padhi et al., 2021; Chen et al., 2024). It is an enhancer that is a member of the VISTA enhancer database that contains several enhancers with conservation in human, mouse, and rat (Pennacchio et al., 2006). While expression of EBF3 is ubiquitous in the human body, the activity of hs737 seems to be restricted to the fetal brain (Padhi et al., 2021).
As noted, there is an enrichment of DNVs within hs737 in individuals with autism and an enrichment of deletions in individuals with neurodevelopmental disorders. We sought to determine the molecular and phenotypic consequence of deletion of hs737 in a model system. Thus, we focused on generating a mouse model for this genomic interval as the sequence of hs737 is highly conserved with its orthologous mouse sequence [within the Rr169617 (https://www.informatics.jax.org/marker/MGI:8255218) regulatory region] (Padhi et al., 2021). Here, we describe the creation of a novel mouse line engineered to delete the relevant sequence within Rr169617, assess the molecular consequences through RNA-seq experiments, and determine the phenotypic consequences through systematic broad-based phenotyping assays. This mouse model provides a useful tool to others in the field especially those studying the EBF3 gene regulatory network (GRN) that has been implicated in autism and other neurodevelopmental disorders (Chao et al., 2017; Harms et al., 2017; Sleven et al., 2017; Padhi et al., 2021; Ignatius et al., 2022).
RESULTS
The topologically associating domain with Hs737 is highly conserved in mouse
By aggregating genomic annotation data from our (Padhi et al., 2021) and others' (Dixon et al., 2012; Chen et al., 2024; Moore et al., 2020) previous work, we studied the features of the human genomic topologically associating domain (TAD) region containing hs737 in the mouse genome (within Rr169617). EBF3 resides within TAD1949 originally defined in Dixon et al. (2012) via Hi-C in human embryonic stem cells. To identify the orthologous region in mouse, we performed liftover from human (GRCh38/hg38) to mouse (GRCm38/mm10) and found that this TAD was mostly conserved in mouse (Fig. 1). The large TAD region contains the same TAD boundaries as seen in human (Fig. 1). Further support for the conserved architecture of this region is provided by comprehensive capture-Hi-C experiments for several VISTA enhancers that identified multiple enhancer-promoter interactions between the region within Rr169617 and the promoter of Ebf3 (Fig. 1) (Chen et al., 2024) These findings are consistent with our previous observations of hs737 contacting the promoter of EBF3 by examining Hi-C data in the human fetal brain (Chen et al., 2024; Padhi et al., 2021).
Ebf3 regulatory landscape and associated hs737/Rr169617 enhancer deletion mouse lines. Genome browser view of the topologically associating domain region containing Rr169617 and its target gene Ebf3 (GRCm38/mm10). The first track shows the two independent founder mouse lines generated in this study: line 299 (C57BL/6J-Rr169617em1Tnt/J) and line 304 (C57BL/6J-Rr169617em2Tnt/J). The second track shows the location of the regulatory region, Rr169617. The third track shows the location of human VISTA enhancers lifted over to the mouse genome. Included is hs737 that resides within the Rr169617 region. The fourth track shows enhancer-promoter interactions of Rr169617 and Ebf3 from Chen et al. (2024). The fifth track shows the genes within the region. The sixth track shows human topologically associating domains lifted over to this region and show high conservation. Finally, the chromatin state data available from ENCODE3 is shown across the different timepoints in mouse development. The colors in this track refer to their chromHMM status as described in (Ernst and Kellis, 2012).
Generation of knockout mouse lines
A deletion within Rr169617 was generated in mouse using CRISPR/Cas9 and paired guide RNAs flanking the region of interest. This resulted in two separate deletion founder animals that we carried forward (Fig. 1). Due to the similarity in the deletions, detailed experimental characterization was performed on line 299 that has a 1160 bp deletion (chr7:136083275-136084434 GRCm38/mm10). To further validate this line, we performed PacBio HiFi long-read whole-genome sequencing on E12.5 forebrain tissue from wildtype (Rr169617^+/+^) and homozygous deletion animals (Rr169617^−/−^). All of the sequence reads in the homozygous deletion (Rr169617^−/−^) mice contained a 1160 bp deletion and none of the sequence reads in the wildtype (Rr169617^+/+^) mice contained the deletion (Fig. 2A). Since we performed long-read sequencing, we also assessed the methylation (5mC) status within the enhancer region (Fig. 2B) and over the Ebf3 promoter (Fig. S1). The sequence deleted in Rr169617^−/−^ contained CpG sites that were not methylated in Rr169617^+/+^. The methylation status surrounding the deletion region was similar in both Rr169617^+/+^ and Rr169617^−/−^ (Fig. 2B). The Ebf3 promoter sequence was mostly not methylated in both Rr169617^+/+^ and Rr169617^−/−^ (Fig. S1).
Long-read whole genome sequencing characterization of Cas9 edited mice. (A) PacBio HiFi long-read whole-genome sequencing of E12.5 forebrain tissue collected from Rr169617+/+ and Rr169617−/− mice. All reads in the homozygous deletion mice contain the deletion. None of the reads in the wildtype mice contain the deletion. (B) Methylation status of CpG sites within the Rr169617 region based on the PacBio whole-genome sequencing data. Note, any of the bases within the portion of Rr169617 containing the sequence orthologous to hs737 are unmethylated as shown in blue. Red=methylated CpG. Blue=unmethylated CpG. For both A and B, the region shown is chr7:136,080,610-136,085,789 (GRCm38/mm10).
Based upon the results of long-read sequencing, we developed a PCR-based genotyping assay that could discriminate between wildtype (Rr169617^+/+^), heterozygote (Rr169617^+/−^), and homozygous deletion (Rr169617^−/−^) mice (Fig. S2A) and showed that it matched exactly to the results of whole-genome sequencing (Fig. S2B).
Underrepresentation of the deletion allele
Genotype distributions were analyzed in 278 mice derived from intercrosses between heterozygous animals (Rr169617^+/−^×Rr169617^+/−^, Fig. S3). From these crosses, we observed 99 (35.6%) wildtype animals Rr169617^+/+^, 121 (43.5%) heterozygotes Rr169617^+/−^, and 58 (20.9%) homozygotes Rr169617^−/−^. This distribution significantly deviates from expected Mendelian frequencies (Chi-Square Test, P=0.02), demonstrating an underrepresentation of the deletion allele (Binomial test, P=5.8×10^−4^, based on an expected deletion allele frequency of 50%). This showed a confining of homozygous viability but at a reduced level with no significant differences between sexes.
Consequence of Rr169617 deletion on Ebf3 expression
We hypothesized that deletion in Rr169617 would affect the expression of Ebf3 based upon the supporting 3D interaction data suggesting that it functions as an enhancer of Ebf3. To determine the impact of the deletion on Ebf3 expression, we collected ≥10 mouse forebrains, of each genotype, at E12.5 and performed a series of five independent qRT-PCR experiments. Since we have previously shown that the enhancer is active at E12.5 in the forebrain (Padhi et al., 2021), we utilized this tissue source for the qRT-PCR. Consistently, the heterozygous deletion line reduced Ebf3 expression by ∼10% (Fig. 3) compared to wildtype, and the homozygous deletion line showed a ∼20% reduction in Ebf3 (Fig. 3). While the reduction was consistent, it was not statistically significant. For significance estimates, we calculated the sample size necessary to detect 80% power for a 20% reduction in expression and found that we need a minimum of 38 samples of each genotype, for 90% power 44 samples of each genotype, and for 100% power 68 samples of each genotype.
qRT-PCR analysis for Ebf3 expression in E12.5 forebrain. (A) Results of five independent qRT-PCR for Ebf3 expression. Samples for each genotype were as follows: Rr169617+/+ (n=12), Rr169617+/− (n=14), and Rr169617−/− (n=10). (B) Relative fold expression aggregating data across all five independent qPCR experiments. For both A and B, relative fold expression is in comparison to the Rr169617+/+ results.
Based on our power estimates, we knew we would not be powered to see a significant difference in Ebf3 expression in a standard RNA-seq experiment because it would be cost prohibitive to sequence a minimum of 76 mice [38 wildtype, 38 homozygous deletion, 56,012) just for sequencing]. This is an important note for researchers focused on effects of variation in noncoding regions. Therefore, we proceeded to look for downstream (of Ebf3) expression changes of much higher effect using a high coverage (∼200 million read pairs) RNA-seq experiment on three animals of each genotype expanding out to examine the forebrain, midbrain, and hindbrain, respectively. We used a fold change cutoff of Log2≥|1| and a P-value cutoff of ≤10^−6^ to identify dysregulated genes. Through these analyses (Fig. 4, Fig. S4), we found there was at least one dysregulated gene in each brain region. In the forebrain (Table S1), there were 39 genes that were significantly upregulated (17 were protein-coding genes: Lbhd1, Slc4a1, Hist1h1e, Adra2b, Lars2, Trim10, Nhej1, Csf2rb, Ncf4, Slc25a37, Prr15l, Acp5, Hist1h2bk, Hist1h3i, Mylk3, Cited4, Pdzk1ip1) and 45 genes that were significantly downregulated (11 were protein-coding genes: Ntng1, Ndrg2, Hist1h2ao, Nox1, Neurod6, Cst6, Cdh12, Chd5, Htra1, Prdm8, Glra2). There were also 14 genes that were significant but did not meet the fold change threshold (11 were protein-coding genes: Robo2, Cachd1, B4galt5, Bhlhe22, Kel, Hbb-y, Hsd3b6, Csf2ra, Cabp1, Asrgl1, Hspa8). In the midbrain (Table S2), there was only 1 gene that was significantly downregulated (pseudogene Pisd-ps1). In the hindbrain (Table S3), there were 5 genes that were significantly upregulated (1 protein-coding: mt-Atp6) and 8 genes that were significantly downregulated (four were protein-coding genes: Mroh7, Col7a1, Ndor1, Trpc2). There were also ten genes that were significant but did not meet the fold change threshold (six were protein-coding: Pisd, Manea, mt-Nd2, Ldb2, Aif1l, Aldh16a1).
Volcano plots of RNA-seq data from E12.5 mice. Volcano plots from (A) forebrain and (B) hindbrain mice collected at E12.5 are shown. Each figure compares a Rr169617−/− versus Rr169617+/+. The fold change cutoff was Log2≥|1|, and a P-value cutoff of ≤10−6 was used, denoted by the dashed black lines. Red dots are significantly up-regulated genes, blue dots are significantly down-regulated genes, and green dots are genes that met statistical significance but did not meet the fold change threshold.
Phenotyping analysis of enhancer deletion mice
Given the reproducible reduction in expression of Ebf3 observed in our enhancer deletion mice, we next performed in vivo phenotyping (Table S4-S23) to assess potential behavioral differences focusing on open field, hole board and light/dark transition. These tests allowed us to assess traits related to anxiety, exploration, and mobility.
The PhenStat analysis revealed sexual dimorphism for the number of center entries (P=0.04) and total number of rears in open field (P=0.03). Male Rr169617^−/−^ mice showed significantly fewer entries and less rearing compared to wildtype males, and the Rr169617^−/−^ females showed significantly more entries and more rearing compared to wildtype females (Table S22). This indicates that female mutants explore more than female wildtypes, and male mutants explore less than male wildtypes.
For open field, the distance travelled was recorded in four 5-min bins. There was no significant effect of gene and no overall sexual dimorphism. However, using planned pairwise comparisons, three of these bins showed sexual dimorphism within the mutant mice. Male Rr169617^−/−^ mice travelling less than female Rr169617^−/−^ mice (P-values for the first, second, third and fourth 5-min bin=0.009, 0.065, 0.031, and 0.017; Fig. 5A and Table S23). Similarly, the planned pairwise comparisons also showed sexual dimorphism within the mutant mice for time spent mobile (P=0.045) and time spent rearing (i.e. vertical time; P=0.049) (see Table S23). Overall, male Rr169617^−/−^ mice spent less time active than female Rr169617^−/−^ mice in open field.
Summary of mouse activity as measured by three independent behavioral assays. (A) Distance travelled in 5-min bins for open field, (B) distance travelled in hole board, and (C) percentage of time mobile in light/dark transition. In all assays, male Rr169617−/− mice were less active than female Rr169617−/− mice. Asterisk indicates statistical significance ( P<0.05, ** P<0.01 *** P<0.001) between groups from Bonferroni corrected pairwise comparisons.*
The additional motor parameters recorded for hole board, revealed the same pattern, showing significance only for sexual dimorphism within the mutant mice for distance travelled (P=0.006; Fig. 5B), ambulatory time (P=0.041), and ambulatory episode average velocity (P=0.003) (see Table S23). Male Rr169617^−/−^ mice travelled less distance, for less time, and more slowly than the Rr169617^−/−^ females.
Consistent with the above findings, in the light/dark transition assay, the percentage of time mobile in the light showed male Rr169617^−/−^ mice as less mobile than the Rr169617^−/−^ females (P=0.034) (Fig. 5C). A complex pattern of statistical significance was revealed in the dark by the planned pairwise comparisons (Fig. 5C and Table S23). Both the wildtype (P=0.027) and the mutant mice (P<0.001) showed sexual dimorphism, with males consistently less mobile than females. In addition, a genotype effect for males was detected, with male Rr169617^−/−^ mice being less mobile in the dark than their male wildtype controls (P=0.034). The primary driver of these differences is the reduced mobility of the male Rr169617^−/−^ mice during light/dark transition assay (Fig. 5C).
All mice in this study were also assessed for a variety of other phenotypic measures (Table S21). Most notably, PhenStat analysis detected differences in body composition parameters that showed an overall gene effect as Rr169617^−/−^ mice had a lower proportion of fat than wildtype mice, and conversely an increased lean proportion (e.g. fat(g)/bodyweight (g) P=0.005, lean mass (g)/bodyweight (g) P=0.002). (Table S22).
DISCUSSION
Discovery of genes involved in autism and other neurodevelopmental disorders is occurring rapidly with the utility of several sequencing strategies. Moving beyond the exome, there is an appreciation that noncoding regions of the genome also play an important role. These regions finely tune the expression of genes and are particularly important in brain development. Several areas are being pursued with regard to noncoding regions including statistical testing for enrichment, machine-learning based models, functional characterization at thousands of regions/variants at a time (i.e. Multiplex Assays of Variant Effects), transient transgenic assays, and through precision engineering in model organisms. In this study, we follow up on our previous identification of variants in individuals with neurodevelopmental disorders in the enhancer hs737 that affects the target gene, EBF3. EBF3 is well-established as a syndromic gene and has genome-wide significance for excess variation in individuals with neurodevelopmental disorders. However, the knowledge of the function of this gene and the gene regulatory network (GRN) that it resides within are understudied at this time. Our identification of hs737 provides a foothold into looking at the upstream regulators of EBF3. Further, we observed an excess of deletions of hs737 in individuals with neurodevelopmental disorders consistent with the finding that both EBF3 and its associated regulatory elements are required for normal neural development.
In this study, we pursued the hypothesis that deletion of this element in the highly conserved, orthologous mouse region would provide additional insights into hs737/Rr169617 and EBF3/Ebf3.
First, we found that when the corresponding region in mouse of hs737 is deleted it results in fewer progeny homozygous for the deletion than expected by chance. This suggests that while homozygous deletion mice are viable they are not being born at the rate expected by Mendelian inheritance. Second, mice homozygous for this deletion displayed a relatively small effect on expression of the target gene. However, each enhancer has a different effect on expression, and it is not readily apparent a priori what the reduction of a specific enhancer will be in an in vivo model. Thus, emphasizing the critical importance of experimentally testing regulatory sequences in the context of a whole animal. The modest reduction in expression can also have consequences for RNA-seq experiment design; whereby, exorbitant sample sizes would be necessary to see the expression difference as significant. Therefore, we recommend that smaller sample sizes may be pursued for the RNA-seq experiments but that the outcome of these experiments will only reveal the genes with highest changes in expression. We identified genes with high changes in expression in this study including Lbhd1 and Ntng1. Third, we identified sex specific phenotypes related to mobility when comparing males versus females homozygous for the enhancer deletion. The high-throughput statistical analysis applied as standard by the IMPC indicated greater exploration by female mutants compared to wildtype and less exploration by male mutants compared to wildtype. A smaller but very consistent sexually dimorphic effect, specific to the mutants, was seen across three independently conducted behavioral assays, with male Rr169617^−/−^ mice less mobile than the Rr169617^−/−^ females (nine of ten additional significant motor measures assessed by planned pairwise comparisons). This is highly relevant to the phenotype of autism and the phenotypes we see in individuals with variation in the hs737 enhancer (males with autism and hypotonia but no intellectual disability) (Padhi et al., 2021).
In future studies, it will be important to identify the upstream transcription factors that bind hs737, determine its activity at the single-cell level, and characterize the other cis-regulatory elements that help orchestrate the precise developmental expression of Ebf3. These analyses will provide a framework for investigating the effects of other noncoding variants found within the Ebf3 regulatory landscape. Here, we focused on the deletion of a single element due to the overwhelming supporting evidence from individuals with neurodevelopmental disorders that harbor deletions in this region. The detailed characterization of this novel mouse model provides insight into the molecular and phenotypic impacts of deleting this enhancer and will be of interest to the broad biomedical research community interested in understanding how changes in the noncoding fraction of the genome affect human health and disease.
MATERIALS AND METHODS
Generation of deletion mouse lines
To delete the relevant sequence in Rr169617, paired upstream (CATGCAGAGAAAACAAAATG, GCTGAATTGTAGCGTGTTTA) and downstream (TGGCGCCAGTGGGCCCCGAC, ATCCTGGCACTGGCGCCAGT) guides were identified to flank the genomic region of interest on mouse chr7:136083335-136084349 (GRCm38/mm10). Guide RNAs were incubated with Cas9 protein to generate ribonucleoprotein complexes (RNPs) followed by electroporation into C57BL/6J zygotes (JAX strain #:000664) using standard conditions. Following PCR genotyping for the deletion allele three independent founder lines (lines 299, 300 and 304) were recovered and backcrossed to C57BL/6J to generate N1 progeny; however, only two lines (299 and 304) showed successful germline transmission. A molecular description of the genomic lesion present in each of these independent lines was defined by Sanger Sequencing of PCR amplicons. Line 299 carried a 1160 bp deletion (chr7:136083275-136084434 GRCm38/mm10); referred to as C57BL/6J-Rr169617^em1Tnt^/J (RRID:MMRRC_075665-MU). Line 304 was found to contain a 1147 bp deletion (chr7:136083283-136084428 GRCm38/mm10); referred to as C57BL/6J-Rr169617^em2Tnt^/J. In this study, detailed characterization was performed on C57BL/6J-Rr169617^em1Tnt^/J that we refer to as Rr169617 in this study.
Ethical approval
All mouse work reported herein was conducted at the Jackson Laboratory under the Institutional Animal Care and Use Committee-approved license numbers 11005 and 20028. AAALACi accreditation number 00096, and NIH Office of Laboratory Animal Welfare assurance number D16-00170.
Animal housing information
Animals used in phenotyping studies were homozygous mutant Rr169617^−/−^ mice [female (n=8), male (n=8)] and age and sex matched wildtype control Rr169617^+/+^ mice [female (n=9), male (n=10)]. Mice were housed (1 to 5 animals per cage) in individually ventilated cages [Thoren Duplex II Mouse Cage #11 and Thoren Maxi-Miser PIV System (30.8 L×30.8 W×16.2 H cm)] behind a pathogen-free barrier. Access to water and food (5K52 diet, LabDiet) was ad libitum. Wood shavings (aspen) bedding substrate was provided and sections housing individual mice were supplemented with environmental enrichments (e.g. a nestlet and cardboard hut). Mice were housed in rooms with 12-h light–dark cycle and temperature and humidity were maintained between 20-22°C and 44-60%, respectively.
Mouse colony maintenance and embryo collections
Mouse colonies were maintained by either backcrossing to wildtype C57BL/6J or by intercrosses between heterozygous animals. Timed matings were performed by intercrossing heterozygous Rr169617^+/−^ animals where noon of the day of detection of vaginal plug was considered embryonic day 0.5 (E0.5). Embryos were kept cold on ice in 1× phosphate buffered saline (PBS) and microdissected in ice cold PBS. Embryonic tissues were snap frozen in liquid nitrogen and stored at −80°C until use.
Genotyping PCR for the deletion
DNA was extracted from E12.5 forebrains for one sample each of wildtype (Rr169617^+/+^), heterozygous (Rr169617^+/−^), and homozygous (Rr169617^−/−^) mice using the Zymo Quick-DNA HMW MagBead kit. This extraction method was also used to derive DNA from the HT-22 cell line as a control for the PCR. Primers were designed to test for presence of the deletion in Rr169617 (mm10 chr7:136083275-136084434). The forward primer was 5′ CATACTTAGCTACTGTGGATGGTGA 3′ and the reverse primer was 5′ CAAATCCCACCTTAACAGCACATAG 3′. PCR reactions consisted of 30 ng HMW DNA of each sample, positive control (HT-22), or negative control (water), 1.25 µl of 10 µM forward primer, 1.25 µl of 10 µM reverse primer, 0.75 µl DMSO, 12.5 µl 2× Phusion High Fidelity master mix, and nuclease free water up to 25 µl. Cycling conditions were 98°C for 2 min, 25 cycles of [98°C for 10 s, 70°C for 30 s, 72°C for 30 s], 72°C for 10 min, 4°C hold. The samples were run on an Agilent Bioanalyzer. The wildtype band was 2618 bp and the deletion-containing band was 1484 bp. Confirmation of the sequence of the wildtype and deletion bands were completed by TOPO TA cloning of the sequences into a plasmid (using the TOPO TA Cloning Kit for Sequencing) and sequencing of the plasmid by Oxford Nanopore Technology sequencing at Plasmidsaurus.
Long-read whole-genome sequencing of mice
E12.5 mouse forebrains were pooled from three wildtype (Rr169617^+/+^) and three homozygous mice (Rr169617^−/−^), respectively. High molecular weight DNA was extracted for each pooled sample. Each pool was made into a library for PacBio HiFi sequencing on the Revio sequencer. Each library was sequenced using one SMRT cell to approximately 30× coverage.
RNA extraction, cDNA synthesis and RNA-seq of E12.5 forebrain
Mouse E12.5 fetal forebrain tissue from mice that were wildtype (Rr169617^+/+^) (n=12), heterozygous (Rr169617^+/−^) (n=14), or homozygous (Rr169617^−/−^) (n=10) for the deletion in Rr169617 was used to extract RNA. The RNA was extracted using a Bead Bug homogenizer to homogenate the tissue and the Maxwell simplyRNA Tissue kit for RNA extraction. SuperScript III First-Strand Synthesis System was used for reverse transcription. Taqman mouse Ebf3 (Mm00438642_m1) and GAPDH (Mm99999915_g1) gene expression assays were performed on a QuantStudio 6 Flex quantitative thermocycler using four reactions for each sample. QuantStudio Real-Time PCR software was used to run the thermocycler using the Standard Comparative Ct (ΔΔCt) method. Three individuals performed a total of five qPCR assays in quadruplicate. Results were reviewed by three individuals to assess each set of quadruplicates for outliers (>0.5 cycles apart), and these were removed from the data sets. For RNA-seq, three RNA samples from each E12.5 genotype group (Rr169617^+/+^, Rr169617^+/−^, Rr169617^−/−^) were polyA selected and sequenced to a target of 200 million read pairs using Illumina NovaSeq6000. Every sample RNA had a RIN greater than 8.0. Ribosomal RNA was removed through poly-A selection with Oligo-dT beads (mRNA Direct kit, Life Technologies). The mRNA was fragmented in reverse transcriptase buffer and heated to 94°C for 8 min. Reverse transcription of the mRNA to cDNA was performed using the SuperScript III RT enzyme with random hexamers. A second strand synthesis was carried out to produce double-stranded cDNA. The cDNA was blunt-ended, an A base was added to the 3′ ends, and Illumina sequencing adapters were ligated to the ends. The ligated fragments were amplified for 12-15 cycles with primers incorporating unique dual index tags. Finally, the fragments were sequenced on an Illumina NovaSeq with paired-end reads extending 150 bases at the McDonnell Genome Institute.
RNA-seq of E12.5 midbrain and hindbrain
RNA was extracted from E12.5 midbrains and hindbrains of three independent samples of each genotype (Rr169617^+/+^, Rr169617^−/−^), respectively. Library preparation, ribosomal RNA reduction, and Illumina UDI library preparation were performed at the University of Maryland Institute for Genome Sciences. They were sequenced (rRNA depletion RNA-seq) to a target of 200 million read pairs using an Illumina NovaSeq6000.
RNA-seq analysis
The RNA-seq analysis was run using the ENCODE pipeline, found here (https://github.com/ENCODE-DCC/rna-seq-pipeline), due to it being a well-developed standard. The only modifications were hardcoded PATH variables so that the pipeline would function properly on our HPC. The mouse Gencode M21 reference data was used; links are provided in the ENCODE documentation. The forebrain poly-A samples were run as paired, unstranded runs, while the rRNA-depleted samples were run as paired, reverse-stranded runs. Differential gene expression analysis was performed using DESeq2 (Love et al., 2014).
Phenotype pipeline
The mice progressed through the JAX KOMP phenotyping pipeline (Table S5, https://www.mousephenotype.org/impress/PipelineInfo?id=12) (Dickinson et al., 2016). The methods for all assays in the pipeline are provided online (https://www.mousephenotype.org/impress/PipelineInfo?id=12) and the assays for which we had a priori hypotheses are detailed below. Raw phenotyping data are available in Tables S4-S20.
Behavioral assays
Three behavioral assays (open field, light/dark transition and hole board) were conducted to provide information on anxiety, exploration and mobility. Testing was conducted between 07:00 h and 17:00 h in the light portion of their 24-h cycle and mice were first habituated to the room for 30 min. For all three assays, mice were placed in an acrylic chamber (40×40×40 cm) contained within a sound attenuated, ventilated cabinet (64 L×60 W×60 H cm) and the motor behavior and location were recorded by horizontal infrared photobeam sensors (16×16 array) using Fusion behavioral tracking software (Omnitech Electronics, Columbus, OH, USA).
At approximately 8 weeks of age mice completed the open field test. Mice were placed in the center of the open field arena (light level:100-200 lux) and behavior was recorded for 20 min. The following week mice were tested in the light/dark transition assay which included a dark insert chamber (40×20×40 cm) so that half the chamber was in light (∼200 lux) and half dark (∼1 lux). Mice were placed in the lit portion of the chamber facing away from the dark portion and were recorded for 20 min. Later the same week mice were tested in the hole board configuration which included a grid of 16 shallow holes in the floor (4×4 grid) of the open field arena for the mice to explore (light level:100-200 lux) and behavior was recorded for 10 min.
Dual-energy X-ray absorptiometry (DEXA)
DEXA provided measures of body composition (lean and fat mass), bone mineral content and bone density. Mice (approximately 14 weeks of age) were anesthetized [intraperitoneal injection of 400 mg/kg tribromoethanol diluted in sterile PBS (in-house pharmacy)], measured for length and then placed in the previously calibrated densitometry machine (Lunar Piximus II from GE Medical systems). The region of interest measured excluded the head and neck.
Statistical analysis of phenotypes
The phenotyping pipeline was analyzed using standard IMPC analysis based on PhenStat (Kurbatova et al., 2015) which was designed to find the best analysis for high-throughput data. Standard mandatory parameters for the IMPC were analyzed (Table S21; https://www.mousephenotype.org/impress/PipelineInfo?id=12). Continuous data were analyzed using optimized linear model ANOVAs with the initial factors of genotype, sex, and body weight when available. PhenStat returns significance and effect size for genotype and for sexual dimorphism. Categorical data (e.g. eye morphology) were tested using Fisher's exact tests.
Targeted a priori hypotheses: Although the mice were tested in a full phenotyping pipeline, several of the assays provide additional, non-mandatory parameters of motor responses that were hypothesized to differ between the sexes of the mutant mice (Padhi et al., 2021). These additional behavioral data were analyzed using multivariate ANOVAs by assay, testing factors of sex (male, female), genotype (Rr169617^−/−^, Rr169617^+/+^), and interaction between sex and genotype. Mutant male mice were predicted to be more affected than mutant female mice (Padhi et al., 2021) therefore planned paired comparisons of sex by genotype were completed for these assays, with Bonferroni adjustment for multiple testing, for each analysis. These a priori hypotheses were analyzed using SPSS version 29 (IBM). Motor parameters previously tested using PhenStat were not re-analyzed.
Supplementary Material
10.1242/biolopen.062070_sup1Supplementary information
Table S1. E12.5 Forebrain RNAseq Results
Table S2. E12.5 Midbrain RNAseq Results
Table S3. E12.5 Hindbrain RNAseq Results
Table S4. Mouse Details for the KOMP Phenotyping
Table S5. KOMP Phenotyping Pipeline
Table S6. KOMP Phenotyping Standalone Body Weight
Table S7. KOMP Phenotyping Open Field
Table S8. KOMP Phenotyping SHIRPA Dysmorphology
Table S9. KOMP Phenotyping Grip Strength
Table S10. KOMP Phenotyping Light/Dark Transition
Table S11. KOMP Phenotyping Hole Board
Table S12. KOMP Phenotyping Acoustic Startle PPI
Table S13. KOMP Phenotyping Electrocardiography
Table S14. KOMP Phenotyping Glucose Tolerance
Table S15. KOMP Phenotyping Body Composition
Table S16. KOMP Phenotyping Eye Morphology
Table S17. KOMP Phenotyping Auditory Brainstem Response
Table S18. KOMP Phenotyping Hematology
Table S19. KOMP Phenotyping Clinical Blood Chemistry
Table S20. KOMP Phenotyping Heart Weight
Table S21. Phenotyping Full Parameter List
Table S22. Phenstat Significant Results
Table S23. ANOVA with Planned Pairwise Comparisons (PPC) Significant
The reference list from the paper itself. Each links out to its DOI / PubMed record.
- 1An, J. Y., Lin, K., Zhu, L., Werling, D. M., Dong, S., Brand, H., Wang, H. Z., Zhao, X., Schwartz, G. B., Collins, R. L. et al. (2018). Genome-wide de novo risk score implicates promoter variation in autism spectrum disorder. Science 362, eaat 6576. 10.1126/science.aat 657630545852 PMC 6432922 · doi ↗ · pubmed ↗
- 2Bai, D., Yip, B. H. K., Windham, G. C., Sourander, A., Francis, R., Yoffe, R., Glasson, E., Mahjani, B., Suominen, A., Leonard, H. et al. (2019). Association of genetic and environmental factors with autism in a 5-country cohort. JAMA Psychiatry 76, 1035-1043. 10.1001/jamapsychiatry.2019.141131314057 PMC 6646998 · doi ↗ · pubmed ↗
- 3Brandler, W. M., Antaki, D., Gujral, M., Noor, A., Rosanio, G., Chapman, T. R., Barrera, D. J., Lin, G. N., Malhotra, D., Watts, A. C. et al. (2016). Frequency and complexity of De Novo structural mutation in autism. Am. J. Hum. Genet. 98, 667-679. 10.1016/j.ajhg.2016.02.01827018473 PMC 4833290 · doi ↗ · pubmed ↗
- 4Brandler, W. M., Antaki, D., Gujral, M., Kleiber, M. L., Whitney, J., Maile, M. S., Hong, O., Chapman, T. R., Tan, S., Tandon, P. et al. (2018). Paternally inherited cis-regulatory structural variants are associated with autism. Science 360, 327-331. 10.1126/science.aan 226129674594 PMC 6449150 · doi ↗ · pubmed ↗
- 5Chao, H. T., Davids, M., Burke, E., Pappas, J. G., Rosenfeld, J. A., Mc Carty, A. J., Davis, T., Wolfe, L., Toro, C., Tifft, C. et al. (2017). A syndromic neurodevelopmental disorder caused by De Novo variants in EBF 3. Am. J. Hum. Genet. 100, 128-137. 10.1016/j.ajhg.2016.11.01828017372 PMC 5223093 · doi ↗ · pubmed ↗
- 6Chen, Z., Snetkova, V., Bower, G., Jacinto, S., Clock, B., Dizehchi, A., Barozzi, I., Mannion, B. J., Alcaina-Caro, A., Lopez-Rios, J. et al. (2024). Increased enhancer-promoter interactions during developmental enhancer activation in mammals. Nat. Genet. 56, 675-685. 10.1038/s 41588-024-01681-238509385 PMC 11203181 · doi ↗ · pubmed ↗
- 7Coe, B. P., Witherspoon, K., Rosenfeld, J. A., Van Bon, B. W., Vulto-Van Silfhout, A. T., Bosco, P., Friend, K. L., Baker, C., Buono, S., Vissers, L. E. et al. (2014). Refining analyses of copy number variation identifies specific genes associated with developmental delay. Nat. Genet. 46, 1063-1071. 10.1038/ng.309225217958 PMC 4177294 · doi ↗ · pubmed ↗
- 8Cooper, G. M., Coe, B. P., Girirajan, S., Rosenfeld, J. A., Vu, T. H., Baker, C., Williams, C., Stalker, H., Hamid, R., Hannig, V. et al. (2011). A copy number variation morbidity map of developmental delay. Nat. Genet. 43, 838-846. 10.1038/ng.90921841781 PMC 3171215 · doi ↗ · pubmed ↗