The Pattern Glare Test: Further Exploration of Methodological and Demographic Factors
Lenka Jurkovičová, Julie Páleník, Alexandra Ružičková, Robert Roman, Milan Brázdil

TL;DR
The Pattern Glare Test shows how visual discomfort varies with factors like sex and trial progression, highlighting the need for standardized methods.
Contribution
The study identifies sex and trial progression as significant factors in visual discomfort, independent of migraine history.
Findings
Sex (biological) significantly affects subjective responses to the Pattern Glare Test.
Trial progression influences reports of visual discomfort and distortions.
Color-related visual distortions overlap substantially and can be grouped into a single category.
Abstract
The Pattern Glare Test (PGT) is a widely used tool for assessing visual discomfort and perceptual distortions elicited by repetitive, high-contrast patterns. It has been applied across diverse populations and research fields, including neuroscience, cognitive psychology, optometry, orthoptics, and ophthalmology. Despite its broad use, considerable variation exists in how the PGT is implemented, particularly regarding stimulus parameters, participant characteristics, and scoring methods. Such variability introduces potential confounding factors that may obscure the psychological and neurological mechanisms underlying pattern-induced visual discomfort. We analyzed PGT data from 184 neurotypical young adults (72 males and 112 female; mean age = 24.29 years, SD = 4.75) to examine methodological influences on reports of associated visual distortions (AVDs) and discomfort. Our main analyses…
Genes, proteins, chemicals, diseases, species, mutations and cell lines named across the full text — each resolved to its canonical identifier and authoritative record.
Click any figure to enlarge with its caption.
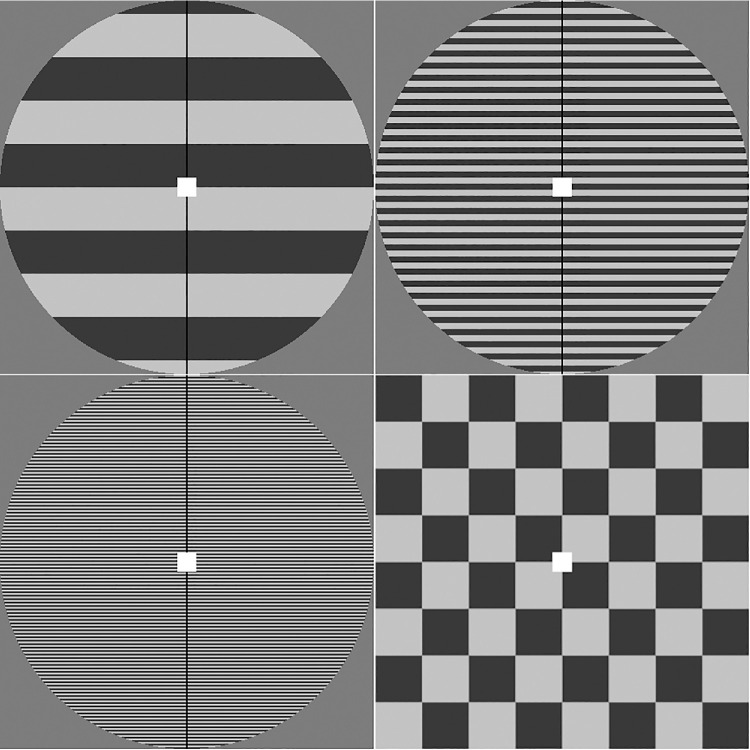 Figure 1
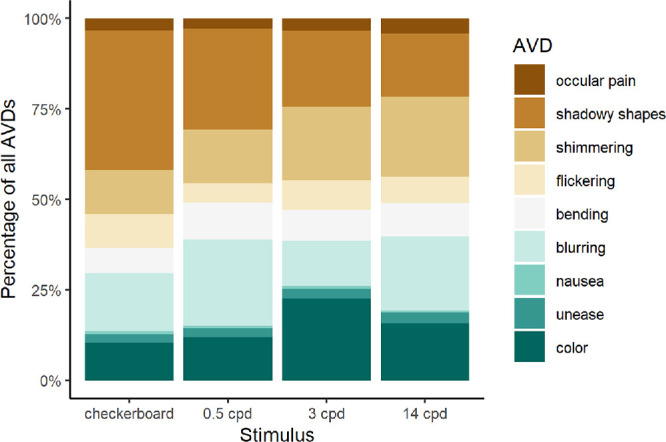 Figure 2
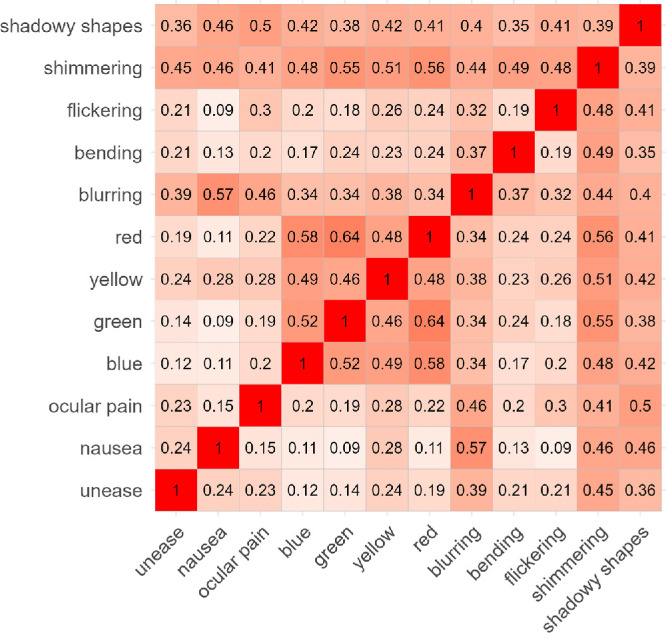 Figure 3
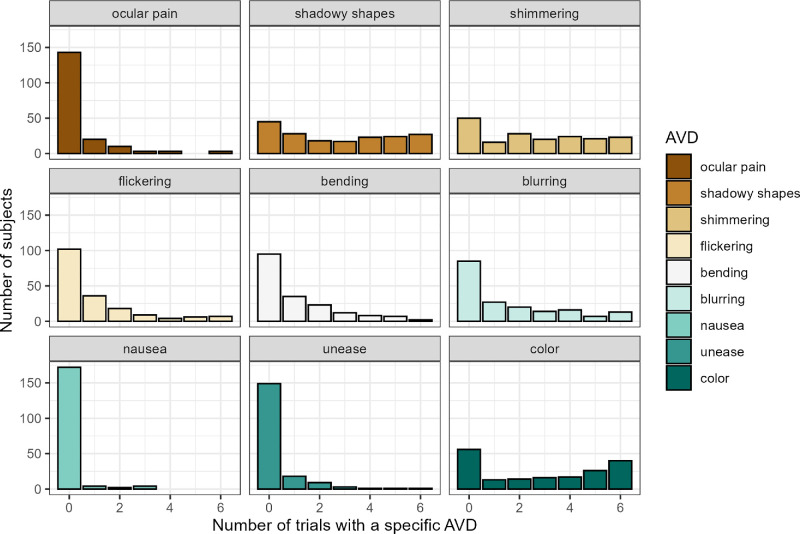 Figure 4
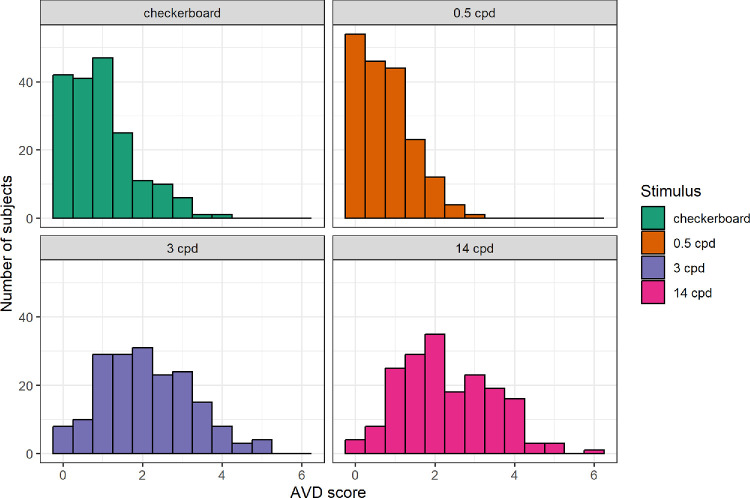 Figure 5
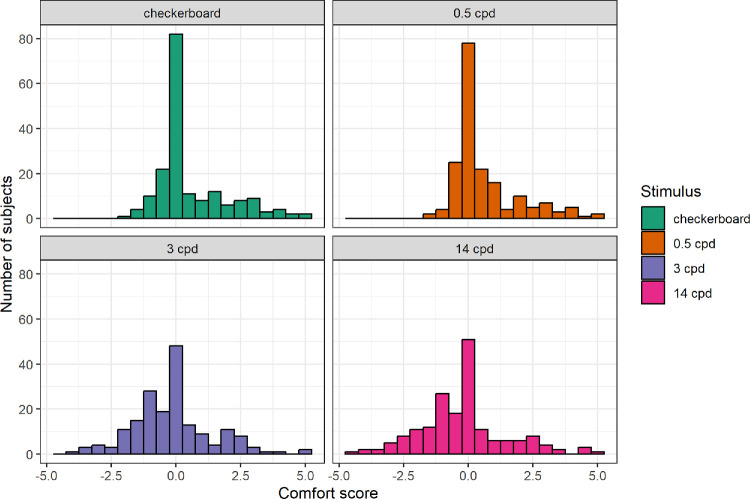 Figure 6
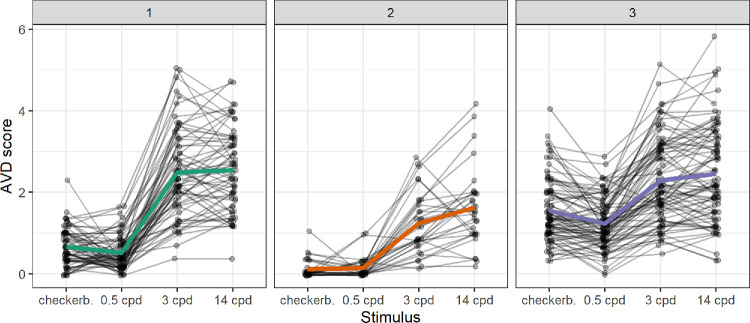 Figure 7
|
| Percentage | |
|---|---|---|
| Biological sex | ||
| Male | 72 | 39.13 |
| Female | 112 | 60.87 |
| Age, y | ||
| 18–20 | 29 | 15.76 |
| 21–23 | 83 | 45.11 |
| 24–26 | 31 | 16.85 |
| 27–29 | 14 | 7.61 |
| 30–32 | 11 | 5.98 |
| 33–35 | 8 | 4.35 |
| 36–38 | 5 | 2.72 |
| 39–40 | 3 | 1.63 |
| Native language | ||
| Czech | 135 | 73.37 |
| Slovak | 43 | 23.37 |
| Other | 6 | 3.26 |
| Migraine without aura | ||
| Yes | 29 | 15.76 |
| No | 154 | 83.7 |
| Missing value | 1 | 0.54 |
| Number of Endorsed AVDs | Comfort Ratings | |
|---|---|---|
| Trial | 1.012** | 0.979*** |
| Lateralization (left) | 1.002 | 1.249* |
| Lateralization (right) | 2.028*** | 1.567** |
| Sex (male) | 0.163*** | 0.84 |
| Age, y | 0.936*** | 0.969*** |
| Stimulus onset jitter | 1.047 | 0.99 |
| Prev. stim. (0.5 cpd grating) | 1.103 | 1.046 |
| Prev. stim. (3 cpd grating) | 0.826* | 1.102 |
| Prev. stim. (14 cpd grating) | 0.934 | 1.069 |
| Migraine | 1.583*** | 0.889 |
| Stimulus (0.5 cpd grating) | 0.714*** | 1.041 |
| Stimulus (3 cpd grating) | 6.714*** | 0.433*** |
| Stimulus (14 cpd grating) | 8.76*** | 0.381*** |
| Sex (male) * migraine | 0.941 | 0.955 |
| Sex (male) * age | 1.049*** | 1.029* |
Peer Reviews
No public reviews on file for this paper yet. If you reviewed it on a platform where reviews are public (OpenReview, ICLR, NeurIPS, ICML), you can paste yours below so the community can read it here.
Videos
No videos yet. Explain this paper in a talk, walkthrough, or lecture? Add one.
Taxonomy
TopicsOphthalmology and Visual Impairment Studies · Ergonomics and Musculoskeletal Disorders · Spatial Neglect and Hemispheric Dysfunction
The Pattern Glare Test (PGT) is a widely used tool in visual research, primarily utilized to evaluate susceptibility to visual discomfort.1^,^2 It was first developed by Arnold J. Wilkins and colleagues in the 1980s,3 with its standardized version—the Wilkins and Evans Pattern Glare Test—officially published in 2001.4 Many variants of the test, however, have been in use since.5^–^16
The PGT is grounded in the study of “pattern glare,” a phenomenon where viewing repetitive, high-contrast patterns, such as black-and-white gratings, induces visual discomfort and perceptual distortions.17 During the test, observers are presented with striped patterns of varying spatial frequencies, including the most aversive frequency of approximately 3 cycles per degree (cpd), to assess their susceptibility to visual discomfort and related effects. These effects often include the perception of colors, motion, or shapes that are not actually present in the stimulus and may even trigger symptoms such as headaches, eye strain, or nausea in some individuals.1
The pattern glare phenomenon, resulting in visual discomfort, is attributed by some authors to hyperexcitability in the visual cortex, where certain patterns excessively stimulate its neurons.3^,^5^,^6^,^9^,^10^,^18^–^21 The level of induced discomfort varies between individuals and is frequently elevated in conditions such as visual stress,22 migraine,18^,^23^–^26 epilepsy,27^–^29 stroke,30 or dyslexia.31^,^32 However, research in this area has also documented significant differences among healthy individuals.9^,^10^,^14^,^33^,^34
Despite its widespread application in neuroscience, cognitive psychology, and ophthalmology research,13^,^20^,^21^,^35^–^37 the methodologies using PGT demonstrate considerable variability across studies, reflecting diverse research objectives, theoretical frameworks, and experimental designs. Importantly, the influence of potential moderating factors, such as participant characteristics and stimulus properties, is accounted for to varying extent. This inconsistency may limit the ability to draw generalizable conclusions and to fully understand the psychological and neurological mechanisms underlying visual discomfort, and also poses challenges for cross-study comparisons.
The age distribution of participants across the PGT literature ranges from young students to different cohorts of productive-age individuals to seniors; some studies were even conducted on children. Because there is evidence that the effect of pattern glare decreases significantly with age,2 the conclusions based on data from various cohorts should be interpreted with caution.
Similarly, the variability extends to the consideration of sex and gender. In life sciences research, either biological sex, gender, or both should be accounted for due to their impact on biological, environmental, social, and psychological processes, which may interact with study hypotheses.38 This is particularly relevant in studies of processes associated with the human brain, which exhibits significant sexual dimorphism influenced by testosterone.39 It is essential to use the terms “sex” and “gender” appropriately and to distinguish them in sample characteristics. Sex is a biological variable defined by characteristics encoded in DNA, such as reproductive organs and other physiological and functional characteristics. In contrast, gender refers to the social, cultural, and psychological characteristics associated with human male and female subjects through social context.40 Although the key PGT normative study by Evans and Stevenson2 assessed gender differences in pattern glare and found no significant effects, this conclusion was based on a relatively small sample (34 male and 43 female subjects) with a wide age range (10–90 years), including children, which limits its generalizability. In contrast, our prior research suggests that biological sex may significantly influence PGT outcomes in certain populations41 and requires further exploration.
In regard to test parameters, although some studies have demonstrated the importance of specific stimulus characteristics, such as contrast and color,3^,^42^,^43 viewing distance,44 or presentation order,2 these variables are not always clearly reported and controlled for in PGT studies, posing challenges for reproducibility. Additionally, numerous other potential confounding factors related to the physical, temporal, or spatial characteristics of the stimuli remain to be further examined.
In addition to the stimuli themselves, the subjective response scoring systems introduce a critical source of variability across study designs. Various versions of visual distortion lists are used. Some authors use the original list of seven symptoms recommended in the PGT manual,4 that is, colors, bending of lines, blurring of lines, shimmering or flickering, fading, shadowy shapes, and others. Other authors have modified the list to suit specific research objectives, either by adding or removing visual or somatic symptoms, or by subdividing the “colors” category into specific colors.10^,^20^,^37^,^45^–^47 These differences in scoring approaches can lead to divergent outcomes, and therefore, examining the potential influence of such methodological variability is warranted.
The current study explores potential moderating factors by analyzing empirical data from 184 young neurotypical participants. We examine several key PGT variables and their effects on participants’ subjective reports of core outcomes: perceptual distortions and discomfort. Whereas some methodological and participant-related factors have been examined previously, this study applies advanced statistical modeling to a large sample (n = 184) to extend current understanding of their influence on Pattern Glare Test outcomes. This approach aims to identify confounding factors and evaluate their influence on PGT results, ultimately informing refinements to the test's application in both research and clinical settings, while advancing understanding of the pattern glare phenomenon.
Methods
We present a re-analysis of PGT data previously collected in our laboratory, focusing on the influence of potential confounding variables recorded during the experiment and on the internal structure of subjective responses. To our knowledge, this is the first such analysis reported in the context of the PGT. The data originate from the experiment detailed in Jurkovičová et al.,41 where the complete methodology, including other utilized methods, is described. Only the aspects that are most relevant to the PGT are described here. Contrary to the original study, no participants were excluded based on their responses to the PGT or incomplete magnetic resonance imaging (MRI) data to ensure the largest and most representative sample.
Inclusion criteria required participants to be 18 to 40 years old, have normal or corrected-to-normal vision, have no psychiatric or neurological disorders (except for migraine without aura and common headaches), have no history of migraine with aura, no MRI contraindications, and provide signed informed consent. Participants were recruited via a database of volunteers for neuroscience research and advertisements in university/social media. The sample included 122 students, plus 10 PhD-level students (71.7% of the sample in total). The study was approved by the Research Ethics Committee of Masaryk University. The study was conducted in accordance with relevant guidelines and regulations following the principles of the Declaration of Helsinki.
Pattern Glare Test
A computerized version of the PGT was administered in a shielded laboratory, following the methodology suggested by Braithwaite et al.10 Distance of 80 cm from the LCD screen was ensured using a chinrest. Light in the room was kept at a stable 35 lux. Four types of stimuli were presented: 3 achromatic square-wave gratings at different spatial frequencies (0.5 cpd, 3 cpd, and 14 cpd) and a black-and-white 0.5 cpd checkerboard in a square window, included to mitigate the possibility of persistent neural activity or afterimages influencing responses to subsequent stimuli (Fig. 1). Michelson contrast of the gratings was 0.7 as in the original test by Wilkins et al. in 1984.3
Stimuli used in the experiment. The upper row shows the 0.5 cycles per degree (cpd) and 3 cpd gratings. The lower row shows the 14 cpd grating and 0.5 cpd checkerboard, shown from left to right.
The stimuli were shown to participants in pseudorandomized order, where every stimulus was seen once during a block of four presentations and the same stimulus was never presented twice in a row (including at the beginning or end of a block of 4 stimuli). Each stimulus was presented 6 times, resulting in 24 trials overall.
Before each trial, a fixation dot was presented in the center of the screen for a random interval between 6 seconds and 8 seconds (interval length picked from a uniform distribution). After this, 1 of the 4 stimuli was presented for 12 seconds, with the fixation dot remaining on the screen. After answering the questions about their experience viewing the pattern (see below), a blank screen was shown for 8 seconds before the start of the next trial.
Three kinds of responses were collected from participants in each trial. First, the participants selected all associated visual distortions (AVDs) they experienced while viewing the stimulus from a list. These included ocular pain, shadowy shapes, shimmering, flickering, bending, blurring, nausea, and red, yellow, green, or blue color. A printed-out list of AVDs, which included their definitions, was provided to participants before the task and was available to them during the entire procedure.
Second, participants were asked to determine whether the AVDs were present more on one side of the screen, left or right, or on both sides roughly equally (lateralization). Last, participants rated their level of discomfort on a 11-point scale ranging from extreme discomfort (–5), through neutral experience (0) to extreme comfort (5).
Data Analysis
All the data analyses were conducted in RStudio (version 2024.04.2+764) using R software version 4.4.1. The data and R script are publicly available at 10.5281/zenodo.15051368.
First, the internal structure of the PGT was investigated by analyzing the data on the level of single trials. The distribution of different AVDs on the four types of stimuli was compared using the chi-squared test. The tendency of pairs of AVDs to co-occur on a single trial was quantified using the overlap or Szymkiewicz–Simpson coefficient. The advantage of this metric over other similarity measures, such as the phi coefficient, is that it equals one when one of the phenomena is a subset of the other. Comparatively rare phenomena therefore can still have high degrees of overlap with more common ones.
Next, two PGT scores were computed in accordance with previous works: average number of endorsed AVDs (either counting the 4 reportable colors separately or as one AVD) and the average comfort rating, both averaged per trial of a stimulus type. These scores were compared using the Friedman test, a nonparametric equivalent of a repeated measures ANOVA, and post hoc analyses were conducted using paired Wilcoxon signed-rank tests with Bonferroni adjusted P values.
We also investigated whether individuals exhibited distinct response patterns across the four different stimuli. Average AVDs were converted into relative scores by dividing each subject's PGT score for a certain stimulus type by the sum of their PGT scores across all four stimuli. K-means cluster analysis was then conducted using Euclidean distances of these relative PGT scores. The number of clusters was established using a combination of the elbow method, average silhouette, and the gap statistic method (based on the first local maximum).
Finally, responses on single trials, both AVD sums and comfort scores, were predicted using cumulative link mixed models (CLMMs) with a logit link function from the “ordinal” R software package.48 CLMMs are an extension of logistic regression. Whereas logistic regression predicts binary outcomes, CLMMs estimate separate thresholds for each level of an ordinal response variable, thereby modeling the probability that a response falls within a given ordered category. This approach accounts for the ordinal nature of the data without assuming equal distances between categories, providing a more accurate representation of the observed responses. Coefficients of a CLMM represent log-odds of the ordinal response variable being in a category one higher per unit of the predictor. In this study, we report exponentiated coefficients, converting them into odds ratios (ORs).
The predictor variables included the presented stimulus, trial number, lateralization of reported distortions, biological sex, age, jitter of the stimulus onset, previous stimulus (i.e. stimulus presented in the preceding trial), presence of migraine, and two-way interactions of sex with migraine and age with migraine, along with a random effect of the subject. Due to the inclusion of the “previous stimulus” variable, the first trial of each subject was excluded from the analysis.
A major assumption of CLMMs are proportional odds, meaning that the effects of predictors are equivalent across all levels of the response variable. Because the “ordinal” package does not implement a formal test for the proportional odds assumption in the case of CLMMs, we investigated this assumption by fitting separate binomial generalized linear mixed models (GLMMs) for each level of the response variable and comparing the model coefficients.
Results
Demographic information of the sample has been summarized in Table 1. The analyzed sample consisted of 184 subjects (self-reported biological sex = 72 male and 112 female subjects). The average age of subjects was 24.29 years (SD = 4.75). The age distribution was positively skewed (1.42), indicating a higher proportion of younger participants. Most respondents were native Czech (135) or Slovak (43) speakers. Other reported native languages included Ukrainian (1), Romanian (1), Belarussian (2), and Russian (1), whereas one participant claimed both Czech and Slovak as native languages. All participants were fluent in Czech. Participants reported the number of hours slept before the experiment (M = 6.91, SD = 1.30) and on their typical night (M = 7.45, SD = 0.85). Twenty-nine participants reported experiencing symptoms of migraine without aura at some point during the last 10 years, whereas 154 reported no symptoms. One subject did not respond to the migraine-related question.
Internal Structure of the PGT
At least one AVD was reported on 74.21% of all trials (52.86% of 0.5 cpd trials, 89.76% of 3 cpd trials, 93.02% of 14 cpd trials, and 61.12% of checkerboard trials). The specific type of AVD experienced differed significantly across the four stimuli (χ^2^ = 685.95, df = 33, P < 0.001). When the colors were treated as a single AVD category, the trend remained highly significant (χ^2^ = 383.41, df = 24, P < 0.001). Colors were experienced more frequently for 3 cpd gratings than for other stimuli, whereas shadowy shapes were most commonly observed in the control checkerboard stimulus (see Fig. 2).
Distribution of AVDs on different stimuli.
The matrix of overlap coefficients of different pairs of AVDs is presented in Figure 3. The color variables (red, yellow, green, and blue) display a high degree of overlap (all ≥ 0.46), which justifies the decision in some previous studies to combine them into a single “color” variable.
Overlap coefficient values for pairs of AVDs.
Figure 4 shows the distributions of specific AVDs on the 3 cpd grating (ranging from 0 = the subject never experienced this AVD on the 3 cpd; to 6 = the AVD was experienced on each of the 3 cpd presentations). All the distributions have a mode of zero, although shadowy shapes and colors (2 of the most common AVDs) also show a trend toward bimodality with modes at the extremes of the variable range.
Histograms showing the proportion of target 3 cpd trials in which subjects experienced specific AVDs.
Lateralization of the perceived phenomena, that is, the side where the distortions were more prominent, was reported in 12.08% of all trials (7.3% on the left and 4.78% on the right side of the visual field). For the target 3 cpd stimulus, 124 of the 184 subjects (67.39%) never reported any lateralization. Moreover, 80 subjects (43.48%) did not report lateralization on any trial across all four stimulus types during the entire task.
Overall PGT Scores
Two overall PGT scores were computed: average number of AVDs and the average discomfort rating per trial for each of the four stimulus types. The distribution of overall AVD scores is shown in Figure 5. The scores for the 3 cpd and 14 cpd gratings were approximately normally distributed; however, the Shapiro-Wilk test was significant in both cases (P < 0.01), likely due to the large sample size.
Distributions of overall AVD scores. The score represents the average number of endorsed AVDs per trial for each specific stimulus type.
The Friedman test was highly significant (χ^2^(3) = 373, P < 0.001). All paired Wilcoxon tests remained significant after correction (P < 0.01). The highest number of AVDs was reported on the 14 cpd grating (M = 2.82, SD = 1.16), followed by the 3 cpd grating (M = 2.11, SD = 1.15), the 0.5 cpd checkerboard stimulus (M = 0.95, SD = 0.83), and the lowest on the 0.5 cpd grating (M = 0.76, SD = 0.66).
Average comfort ratings were computed analogously to the AVD scores. As illustrated by the distributions in Figure 6, a large portion of the sample found the control 0.5 cpd gratings and checkerboards neutral (with an average comfort rating of zero) or only slightly irritable. However, a subset of subjects rated these stimuli as comfortable (positive comfort ratings), indicating that some participants may have been using different responding criteria than others.
Distributions of average comfort scores per trial for each specific stimulus.
Comfort scores varied significantly across the four stimulus types, according to the Friedman test (χ^2^(3) = 129, P < 0.001). To mitigate the effect of responding criteria, we further analyzed the data using a chi-square test, recoding comfort scores as a binary variable: presence (comfort score ≥0) or absence (comfort score <0) of discomfort. The differences between stimuli remained highly significant (χ^2^(3) = 51.794, P < 0.001).
All post hoc comparisons (paired Wilcoxon tests) were significant at corrected P < 0.001, except for those between the 0.5 cpd grating and checkerboard, and between the 3 cpd and 14 cpd gratings. Lower discomfort was reported on checkerboard (M = 0.57, SD = 1.39) and 0.5 cpd gratings (M = 0.61, SD = 1.28) compared to the 3 cpd (M = −0.14, SD = 1.54) and 14 cpd gratings (M = −0.2, SD = 1.66).
Finally, to examine individual profiles of responding to the different PGT stimuli, AVD scores were converted into relative values, and a k-means cluster analysis was conducted based on their Euclidean distances. Analysis of the entire sample, using both the average silhouette and gap statistic methods, indicated the presence of two clusters. However, because one cluster included only six participants, these were deemed to be outliers and were excluded from the second iteration of the cluster analysis.
Among the remaining sample of 178 subjects, both the elbow and the gap statistic method suggested three clusters, whereas the average silhouette indicated two clusters. To facilitate interpretation, we opted to conduct the analysis with three clusters. The results of the k-means cluster analysis are shown in Figure 7. Cluster 1 comprised 64 subjects, cluster 2 included 31 subjects, and cluster 3 contained the remaining 83 subjects.
Individual profiles of the three clusters of PGT responses. Average cluster profiles are shown in color (without dots).
Regression Modeling of Visual Distortions and Comfort Ratings
The number of endorsed AVDs and comfort ratings on single trials were modeled using CLMMs. Only exponentiated coefficients (ORs) are reported. A summary of the CLMM results can be found in Table 2, whereas the coefficients of separately fitted GLMMs are provided in Supplementary Materials.
The effect of the presented stimulus was highly significant (P < 0.001) in all cases, except for the contrast between 0.5 cpd checkerboards and 0.5 cpd gratings (OR = 1.041, P > 0.05). Additionally, we observed a consistent effect of trial number, with later trials associated with an increase in AVDs (OR = 1.012, P < 0.01) and greater discomfort (OR = 0.979, P < 0.001).
Although a statistically significant effect of lateralization was found, further examination of the separate binomial models indicated that the assumption of proportional odds was likely violated for these coefficients. Additionally, the effect of previous stimulus on the number of AVDs was present mostly for the thresholds between zero and one, and one and two distortions. This pattern indicates that the effect is not consistent across all levels of the outcome variable. Consequently, we recommend not interpreting this coefficient as is, as it may not accurately reflect the effect across the full range of AVDs.
The main effects of biological sex and migraine without aura were significant only for AVDs. Male subjects reported fewer AVDs than female subjects (OR = 0.163, P < 0.001), and subjects with migraine reported more AVDs than those without (OR = 1.583, P < 0.001). Age also significantly predicted responses to the PGT, although the direction of the effects was not as expected. Higher age was associated with fewer reported AVDs (OR = 0.936, P < 0.001) but greater discomfort (OR = 0.969, P < 0.001). However, the effect of age was significantly different between men and women (AVDs: OR = 1.049, P < 0.001 and comfort: OR = 1.029, P < 0.05), being weaker in men.
Discussion
Our study aimed to comprehensively investigate the factors influencing the PGT by re-analyzing empirical data and addressing specific research gaps using a controlled dataset. The presented analysis offers several advantages over previously reported research. We utilized a fairly large sample, considering that the data were collected in a laboratory setting, with mostly balanced representation of biological sex. Our version of the PGT was also highly controlled, maintaining constant lighting conditions and fixed viewing distance from the stimulus.
When analyzing overall PGT scores that are commonly used in research, we discovered statistically significant differences between almost all pairs of stimuli. Whereas comfort scores differed between the control and high-frequency stimuli, AVD scores were significantly different even between the two low spatial frequency stimuli (0.5 cpd gratings and checkerboard) and the two higher frequency stimuli (3 cpd and 14 cpd gratings). However, an examination of the comfort rating distributions revealed a potential area for improvement. Our findings suggest that the commonly used bipolar comfort scale with both positive and negative values9^,^35^,^42^,^49 may introduce bias in responses, as some participants do not utilize the full range of the scale, with only a subset utilizing positive values. For future research, we therefore recommend using a simplified discomfort scale, which goes from neutral ratings to different levels of experienced discomfort, provided that clear and thorough instructions are given.
Although participants’ AVD score patterns could be clustered, we did not identify any cluster with a radically different profile of AVD scores. Notably, all 3 identified clusters followed a similar pattern: low response scores on the control stimuli with 0.5 cpd and higher responses for the stimuli with higher spatial frequencies. This finding further supports the validity and practical usefulness of the PGT, when using the aversive grating with approximately 3 cpd as a target stimulus and low-frequency grating as the control stimulus.2^,^32
Age was found to be a significant factor influencing subjective ratings, and thus confirming the results of the study by Evans and Stevenson.2 Interestingly, the direction of age effects differed between the two predicted variables; higher age was associated with fewer reported AVDs but greater discomfort. This finding should be interpreted with caution, given our age-related inclusion criteria.
The significant main effect of biological sex aligns with our previous analyses on a subgroup of 160 participants from the same research.41 Importantly, the present re-analysis demonstrated that the interaction between sex and migraine was not significant, indicating that excluding individuals with migraines from the sample does not eliminate the influence of sex on AVDs. At least in this sample of young participants from the general population, the effect of sex on AVDs persists even when migraine is accounted for, suggesting that other factors, such as hormonal influences or inherent differences in visual processing, may contribute to these effects. In future research, it would be useful to explore these mechanisms in more detail, possibly by examining hormonal fluctuations, sex differences in sensory processing, or genetic predispositions. Additionally, studies including a more diverse age range and clinical populations could help clarify whether these effects extend beyond the current sample.
An intriguing question raised by this study is the inconsistent effect of stimulus order. Presenting a stimulus immediately after the target 3 cpd grating resulted in fewer AVDs being reported both for the high-frequency 14 cpd grating and the control stimuli, but only in cases when the overall number of endorsed AVDs was already low. This finding contrasts with the previously reported effect of stimulus order by Evans and Stevenson,2 who compared two age-matched groups (N = 30 and 27, age = 60 ± 6 and 7 years, respectively) and found that presenting a 12-cpd grating immediately after the 3-cpd grating led to an increase in AVDs on the subsequent stimulus. A significant effect of presentation order was also reported in the study by Wilkins et al.3; however, it did not influence their primary hypothesis and was not investigated further. In contrast, Monger et al.44 (N = 100, mean age = 21.4 ± 2.3 years) reported no effect of stimulus order, although specific group details were not provided. Although the use of high-frequency stimuli is no longer recommended,32 due to their strong dependence on viewing distance, our regression analysis of data from 184 subjects suggests that these stimuli may have some influence on lower thresholds of AVD reporting. However, this effect was not consistent across all response levels and the assumption of proportional odds has been violated, so we advise caution when interpreting this finding. Nevertheless, it points to the usefulness of controlling for stimulus order in experimental designs. It might be beneficial to further investigate this effect by examining whether the inclusion of neutral stimuli between irritable gratings or the introduction of longer time intervals between stimuli presentations improves the consistency of behavioral responses.
Regression modeling of single trials further revealed additional effects of intervening variables on the PGT. The effect of trial number indicates that the phenomena associated with pattern glare, both AVDs and discomfort, become more pronounced as the task progresses. Although the per-trial effect is small—each additional trial increases the odds of a higher AVD score by a factor of 1.012—this effect accumulates over multiple trials. Over the course of 24 trials, this results in an approximately 33% increase in the odds of reporting an additional visual distortion. Thus, although the effect size per trial is modest, it becomes statistically and perceptually relevant in longer experimental paradigms involving irritable gratings. Given the length of the present task, it was sufficient to capture this cumulative effect. The progressive increase in reported AVDs and visual discomfort across repeated trials suggests that prolonged stimulation may modulate cortical responsiveness over time. One plausible explanation is that repeated stimulation induces cortical hyperexcitability, whereby sustained activation of visual cortical networks may increase excitatory and reduce inhibitory neural activity. Such progressive alterations in cortical excitability balance could account for the heightened discomfort observed with repeated exposure to aversive visual stimuli. This mechanism may underlie the exacerbation of visual stress symptoms during prolonged near-vision activities, such as reading or digital screen use.50^,^51 Nonetheless, alternative factors may contribute. The trend could reflect visual or attentional fatigue, which may lower perceptual thresholds for discomfort, or response bias induced by repeated symptom reporting, potentially increasing suggestibility or expectancy effects. Future studies could address these processes by varying inter-trial intervals or including neutral stimuli already suggested above, or adjusting the frequency of subjective ratings to distinguish neural from cognitive factors. Neurophysiological measures (e.g., electroencephalogram [EEG] or function MRI [fMRI]) would further examine the neural mechanisms by directly assessing cortical excitability changes.
Our results suggest that illusory colors experienced during the PGT often overlap within single trials. This variability is likely attributable to the individual differences in subjective responding criteria, for example, some participants may report only the most prominent illusory color, whereas others may select all colors they perceive. To enhance reliability, we support using them as a combined single phenomenon, as it was recommended in the original PGT manual by Wilkins and Evans.4 This decision is supported by the high degree of overlap observed among individual color AVDs (all ≥0.46).
The relative distribution of experienced AVDs varied significantly across the four types of stimuli used in this study, suggesting that different mechanisms may underlie their generation. Some AVDs may be more prone to confabulation by highly suggestible participants, whereas others could be more directly linked to the stimulus processing. To reduce the influence of responses caused by suggestibility, methods such as using low-spatial frequency pattern as a screening tool for a response bias in suggestible individuals are sometimes used.2^,^37 Nevertheless, the current findings highlight the need for a more systematic investigation of AVD lists to better distinguish perceptually driven effects from those influenced by individual response tendencies.
An additional observation was the occurrence of lateralized distortions in a minority of trials (12.08%). However, further model inspection suggested that the proportional odds assumption may not hold for these coefficients, and therefore we recommend interpreting these effects with caution.
Limitations
Although we consider our results to be significant for the future development of the PGT, there are several factors that limit the generalizability of our study. Most notably, our sample consisted of subjects from a specific age range (18–40 years), with the age distribution in this range being skewed toward younger subjects. Additionally, a majority of the participants (71.7%) were university students, increasing the odds that the sample is not representative of the general population even in the given age range.
Next, we used a computerized version of the PGT, whereas the test is often presented in paper form.19^,^20^,^33^,^44 The mode of presentation may affect the test outcomes. Our analysis was naturally limited to the methodological factors that varied within the experimental design, while other parameters remained constant. Consequently, we could not examine the effects of factors such as presentation time, contrast, phrasing of questions, or interstimulus intervals.
Finally, there are limitations inherent to the methods of data analysis that were used. The separate binomial models indicated the violation of proportional odds assumption for some coefficients (i.e. lateralization and order effects), as we pointed out in the previous section. Further, our cluster analysis identified only a small group of outliers in its first iteration, before being recalculated on a sample with these subjects removed. This indicates that most of the variance between subjects in their responding patterns was represented by this outlying group, not by the clusters presented in the second iteration, after removing the outliers. These specific results should therefore be interpreted only cautiously.
Supplementary Material
Supplement 1
The reference list from the paper itself. Each links out to its DOI / PubMed record.
- 1Wilkins AJ. Visual Stress. In: Oxford Psychology Series. Oxford, England, UK: Oxford University Press; 1995. Available at: 10.1093/acprof:oso/9780198521747.001.0001. · doi ↗
- 2Evans BJW, Stevenson SJ. The Pattern Glare Test: a review and determination of normative values. Ophthalmic Physiol Opt. 2008; 28(4): 295–309.18565084 10.1111/j.1475-1313.2008.00578.x · doi ↗ · pubmed ↗
- 3Wilkins AJ, Nimmo-Smith I, Tait A, et al. A neurological basis for visual discomfort. Brain. 1984; 107(4): 989–1017.6509314 10.1093/brain/107.4.989 · doi ↗ · pubmed ↗
- 4Wilkins AJ, Evans BJW. Pattern Glare Test Instructions. i.O.O. Sales Ltd; 2001. Available at: https://www.yumpu.com/en/document/view/25026312/pattern-glare-test-instructions.
- 5Huang J, Cooper TG, Satana B, Kaufman DI, Cao Y. Visual distortion provoked by a stimulus in migraine associated with hyperneuronal activity. Headache. 2003; 43(6): 664–671.12786927 10.1046/j.1526-4610.2003.03110.x · doi ↗ · pubmed ↗
- 6Huang J, Zong X, Wilkins A, Jenkins B, Bozoki A, Cao Y. f MRI evidence that precision ophthalmic tints reduce cortical hyperactivation in migraine. Cephalalgia; 2011; 31(8): 925–936.21622479 10.1177/0333102411409076 PMC 3132147 · doi ↗ · pubmed ↗
- 7Adjamian P, Holliday IE, Barnes GR, Hillebrand A, Hadjipapas A, Singh KD. Induced visual illusions and gamma oscillations in human primary visual cortex. Eur J Neurosci. 2004; 20(2): 587–592.15233769 10.1111/j.1460-9568.2004.03495.x · doi ↗ · pubmed ↗
- 8Allen PM, Hussain A, Usherwood C, Wilkins AJ. Pattern-related visual stress, chromaticity, and accommodation. Invest Opthalmol Vis Sci. 2010; 51(12): 6843.10.1167/iovs.09-508620610842 · doi ↗ · pubmed ↗