A Comparative Analysis of Nutritional Composition in Acer truncatum Leaves and Seeds Over the Growing Stages
Xiangjun Ma, Rui Gao, Lei Gao, Xuexia Yuan, Tong Zhao, Haining Hao, Hongxia Du, Rongqi Zhai, Chan Zhang, Jingxiu Bi, Yutao Wang, Pingxiang Liu

TL;DR
This study shows when to best harvest Acer truncatum leaves and seeds to maximize their nutritional and bioactive compound content.
Contribution
The study provides a detailed, stage-specific analysis of phytochemical and fatty acid dynamics in Acer truncatum for optimized harvesting.
Findings
Leaves had highest flavonoids, chlorogenic acid, and gallic acid in May, while vitamin C and amino acids peaked in September.
Seeds showed optimal fatty acid composition on September 30, with total flavonoids and quercetin peaking in late September.
Multivariate analysis confirmed May as the best time for leaf harvest and September 30 for seeds.
Abstract
Acer truncatum is a valuable source of bioactive compounds, yet the dynamics of these components throughout its growth cycle remain poorly characterized, limiting the optimization of harvest timing for maximal yield. This study quantified key phytochemicals in leaves and seeds across growth stages. In leaves, total flavonoids, chlorogenic acid, and gallic acid reached their highest levels in May (5.62% ± 0.1%, 3.38 ± 0.31, and 6.87 ± 0.14 mg/g, respectively). Quercetin was highest in June (1.80 ± 0.17 mg/g), whereas vitamin C and free amino acids peaked in September (38.73 ± 1.40 and 85.76 ± 0.56 mg/g, respectively) and moisture content peaked in April (74.34% ± 0.17%). For seeds, total flavonoids and quercetin content were highest on September 30 and September 15, respectively, whereas total amino acids and moisture peaked on August 31. No significant temporal variation was detected in…
Genes, proteins, chemicals, diseases, species, mutations and cell lines named across the full text — each resolved to its canonical identifier and authoritative record.
Click any figure to enlarge with its caption.
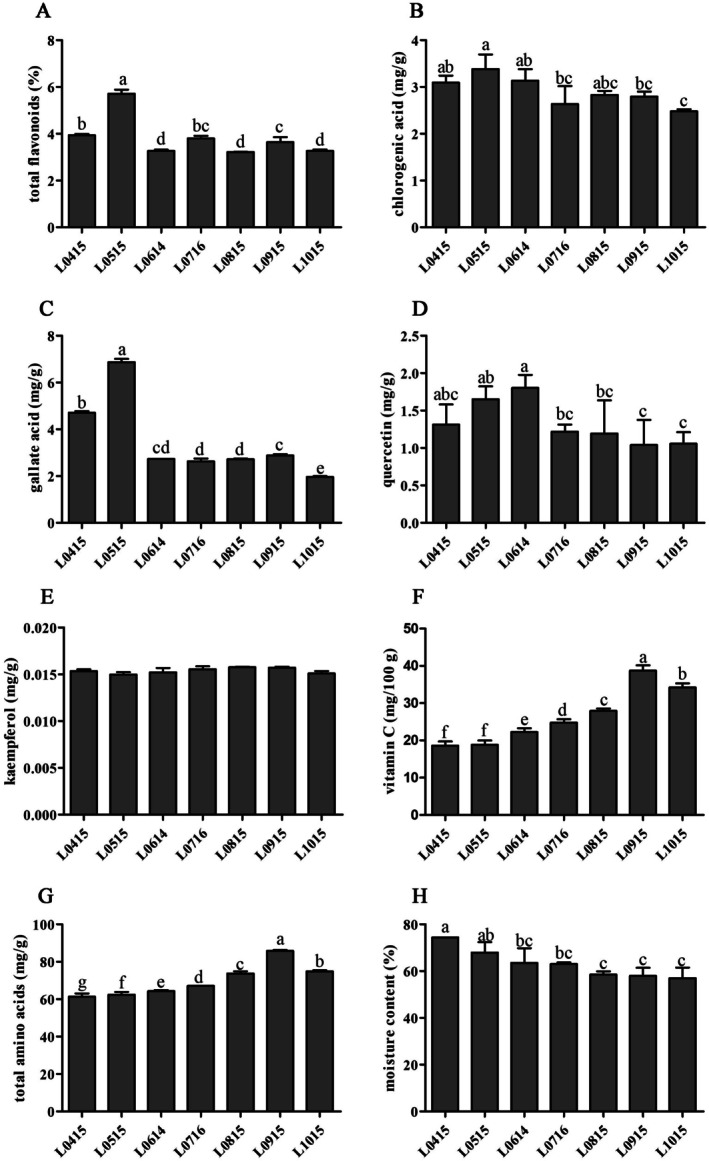 FIGURE 1
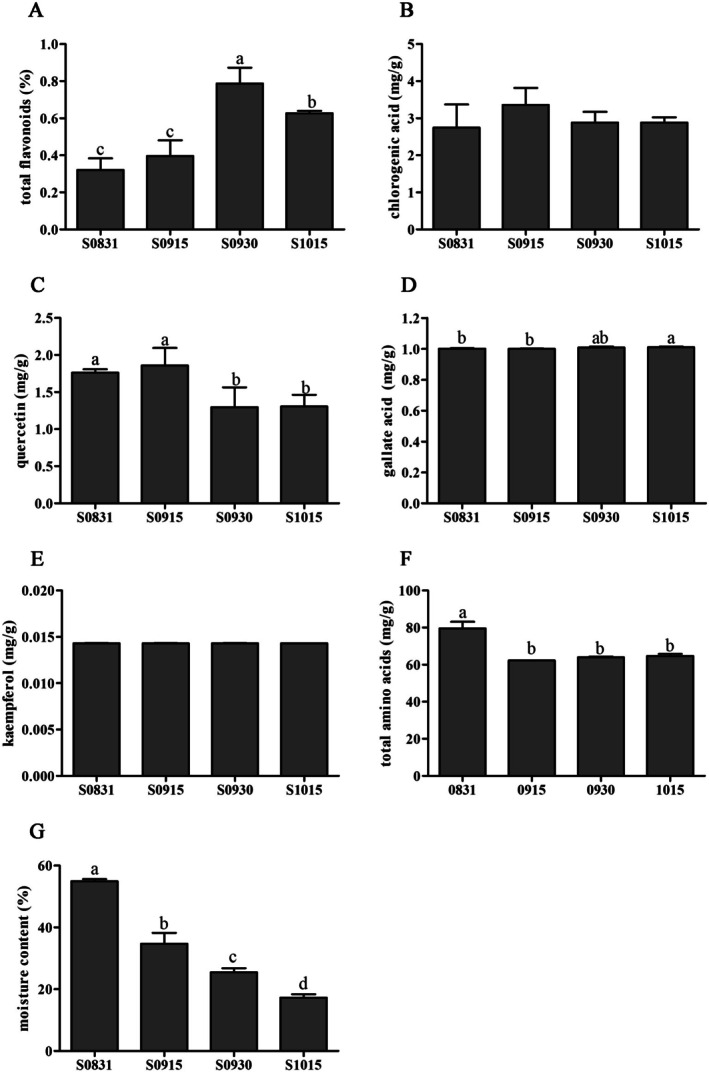 FIGURE 2
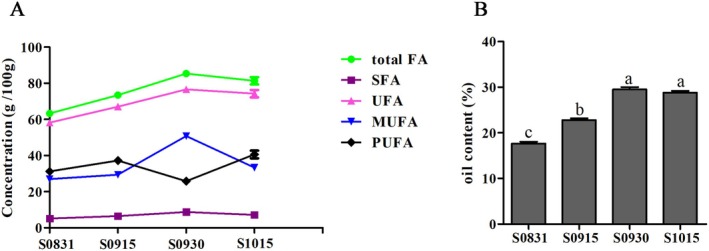 FIGURE 3
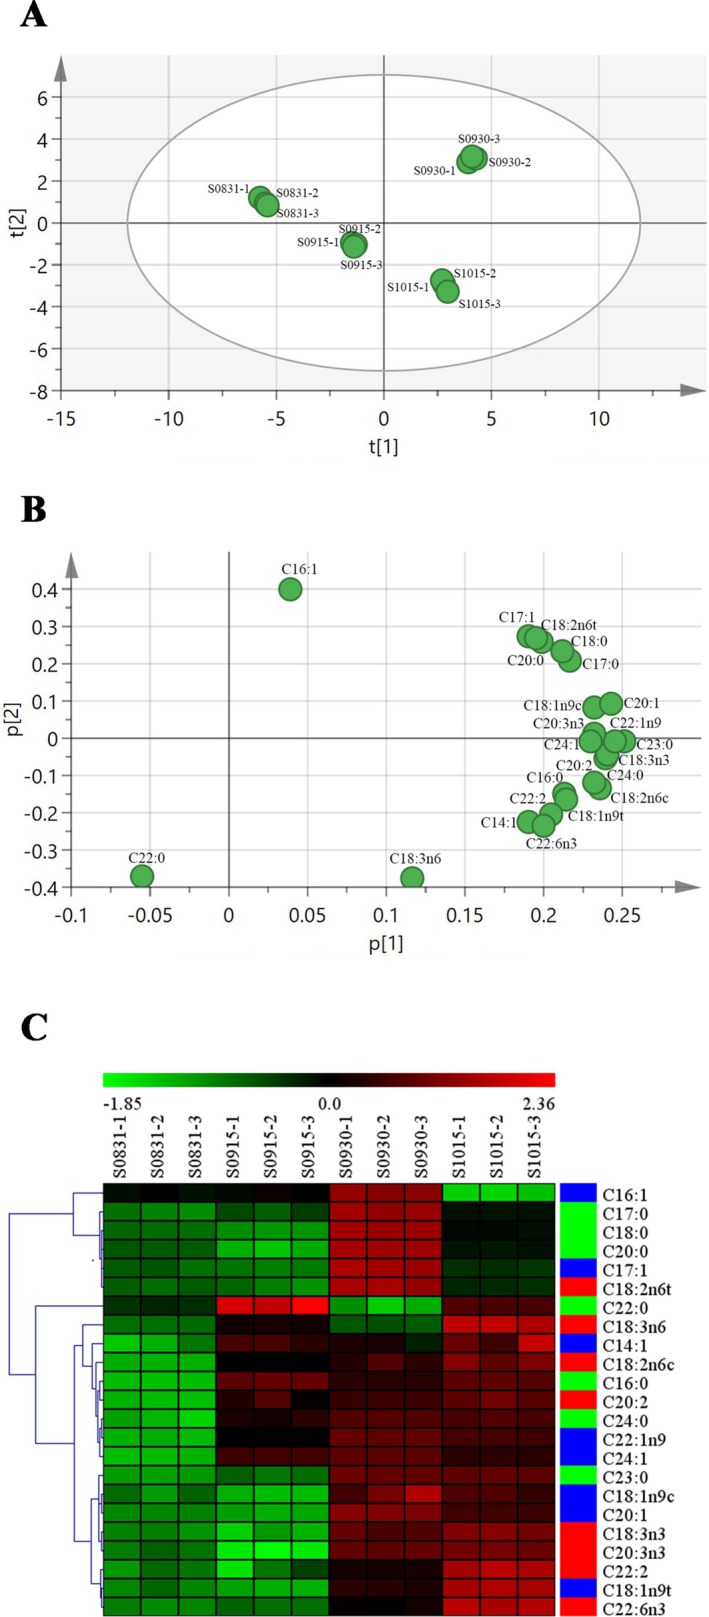 FIGURE 4
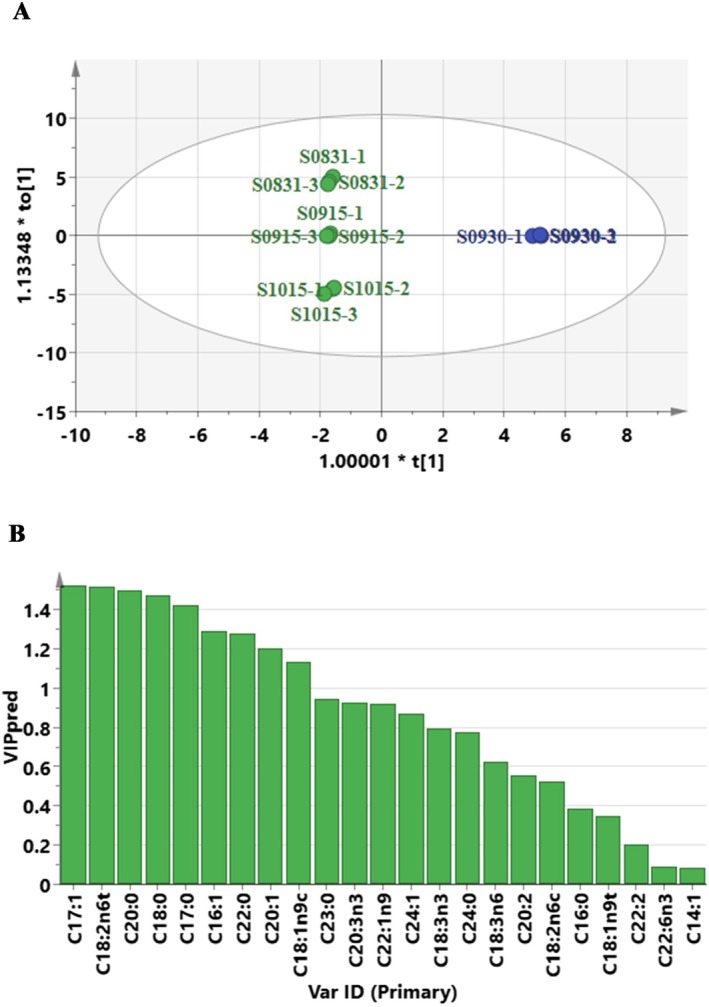 FIGURE 5
| No | P1 | P2 | P3 |
|---|---|---|---|
| X1: total flavonoids | 0.343 | 0.452 | 0.087 |
| X2: chlorogenic | 0.136 | 0.126 | −0.794 |
| X3: quercetin | 0.269 | −0.382 | 0.205 |
| X4: acid gallate | 0.373 | −0.039 | 0.134 |
| X5: kaempferol flavonoids | −0.238 | 0.311 | 0.529 |
| X6: Vc | −0.454 | 0.126 | −0.134 |
| X7: total 21 amino acids | −0.427 | 0.213 | −0.057 |
| X8: moisture | 0.120 | 0.659 | 0.004 |
| Eigenvalues | 4.144 | 1.957 | 1.127 |
| Proportion (%) | 57.334 | 27.073 | 15.592 |
| Cumulative (%) | 46.040 | 67.781 | 80.301 |
| No | F1 | F2 | F3 | U1 | U2 | U3 |
| Rank |
|---|---|---|---|---|---|---|---|---|
| L0415‐1 | 2.142 | −1.743 | −0.076 | 0.947 | 0.05 | 0.496 | 0.634 | 6 |
| L0415‐2 | 1.882 | −1.541 | 0.548 | 0.897 | 0.101 | 0.668 | 0.646 | 5 |
| L0415‐3 | 2.188 | −1.366 | 0.067 | 0.956 | 0.145 | 0.536 | 0.671 | 4 |
| L0515‐1 | 1.872 | 1.795 | 0.415 | 0.896 | 0.942 | 0.632 | 0.867 | 3 |
| L0515‐2 | 2.298 | 1.59 | 0.899 | 0.976 | 0.89 | 0.765 | 0.920 | 1 |
| L0515‐3 | 2.423 | 2.024 | −1.012 | 1 | 1 | 0.239 | 0.881 | 2 |
| L0614‐1 | 0.681 | −1.942 | −0.02 | 0.67 | 0 | 0.512 | 0.464 | 13 |
| L0614‐2 | 0.528 | −1.263 | 0.513 | 0.641 | 0.171 | 0.659 | 0.516 | 9 |
| L0614‐3 | 0.47 | −1.768 | 0.464 | 0.63 | 0.044 | 0.645 | 0.474 | 12 |
| L0716‐1 | 0.455 | −0.006 | −1.878 | 0.627 | 0.488 | 0 | 0.492 | 10 |
| L0716‐2 | −0.525 | 0.051 | 1.752 | 0.441 | 0.502 | 1 | 0.545 | 8 |
| L0716‐3 | −0.304 | 0.339 | 0.789 | 0.483 | 0.575 | 0.735 | 0.547 | 7 |
| L0815‐1 | −0.713 | −0.591 | −0.154 | 0.406 | 0.341 | 0.475 | 0.399 | 16 |
| L0815‐2 | −1.567 | 0.069 | 0.104 | 0.243 | 0.507 | 0.546 | 0.362 | 18 |
| L0815‐3 | −0.961 | 1.387 | −0.614 | 0.358 | 0.839 | 0.348 | 0.487 | 11 |
| L0915‐1 | −2.851 | 1.333 | 0.504 | 0 | 0.826 | 0.656 | 0.326 | 20 |
| L0915‐2 | −1.878 | 1.522 | 0.64 | 0.184 | 0.873 | 0.694 | 0.450 | 14 |
| L0915‐3 | −1.929 | 1.77 | −0.35 | 0.175 | 0.936 | 0.421 | 0.419 | 15 |
| L1015‐1 | −1.886 | −1.177 | 0.662 | 0.183 | 0.193 | 0.7 | 0.266 | 21 |
| L1015‐2 | −1.081 | −0.047 | −0.321 | 0.336 | 0.478 | 0.429 | 0.389 | 17 |
| L1015‐3 | −1.243 | −0.437 | −0.026 | 0.305 | 0.379 | 0.51 | 0.357 | 19 |
| Var ID (primary) fatty acid name | VIP value | FC value |
|---|---|---|
| C17:1 | 1.524 | 1.985***↑ |
| C18:2n6t | 1.516 | 2.087***↑ |
| C20:0 | 1.501 | 2.628***↑ |
| C18:0 | 1.474 | 2.665***↑ |
| C17:0 | 1.426 | 1.963***↑ |
| C16:1 | 1.293 | 2.260***↑ |
| C22:0 | 1.279 | 0.657 |
| C20:1 | 1.203 | 1.251***↑ |
| C18:1n9c | 1.134 | 1.161**↑ |
| C23:0 | 0.946 | 1.209* |
| C20:3n3 | 0.929 | 1.322* |
| C22:1n9 | 0.918 | 1.142* |
| C24:1 | 0.869 | 1.191* |
| C18:3n3 | 0.797 | 1.284* |
| C24:0 | 0.772 | 1.294* |
| C18:3n6 | 0.624 | 0.809 |
| C20:2 | 0.554 | 1.138 |
| C18:2n6c | 0.521 | 1.099 |
| C16:0 | 0.386 | 1.039 |
| C18:1n9t | 0.345 | 1.035 |
| C22:2 | 0.203 | 0.980 |
| C22:6n3 | 0.092 | 0.706 |
| C14:1 | 0.084 | 0.983 |
| No | P1 | P2 | P3 |
|---|---|---|---|
| X1: C16: 0 | 0.183 | −0.139 | 0.237 |
| X2: C17:0 | 0.181 | 0.201 | 0.100 |
| X3: C18:0 | 0.176 | 0.226 | −0.007 |
| X4: C20: 0 | 0.164 | 0.252 | −0.053 |
| X5: C22: 0 | −0.04 | −0.358 | 0.247 |
| X6: C23: 0 | 0.213 | 0.006 | −0.032 |
| X7: C24: 0 | 0.204 | −0.043 | 0.160 |
| X8: C14: 1 | 0.165 | −0.207 | 0.129 |
| X9: C16: 1 | 0.029 | 0.368 | 0.219 |
| X10: C17: 1 | 0.158 | 0.265 | 0.046 |
| X11: C18:1n9t | 0.182 | −0.142 | −0.230 |
| X12: C18:1n9c | 0.196 | 0.095 | −0.143 |
| X13: C18:2n6t | 0.161 | 0.258 | 0.034 |
| X14: C18:2n6c | 0.202 | −0.119 | 0.048 |
| X15: C18:3n6 | 0.104 | −0.344 | −0.077 |
| X16: C20: 1 | 0.204 | 0.101 | −0.082 |
| X17: C18:3n3 | 0.202 | −0.026 | −0.167 |
| X18: C20: 2 | 0.198 | −0.104 | 0.146 |
| X19: C22: 1n9 | 0.208 | −0.002 | 0.134 |
| X20: C20: 3n3 | 0.195 | 0.028 | −0.242 |
| X21: C22: 2 | 0.174 | −0.177 | −0.189 |
| X22: C24: 1 | 0.196 | −0.002 | 0.250 |
| X23: C22: 6n3 | 0.171 | −0.206 | −0.174 |
| X24: SFA | 0.195 | 0.157 | 0.057 |
| X25: UFA | 0.212 | −0.033 | 0.016 |
| X26: MUFA | 0.211 | 0.043 | 0.005 |
| X27: PUFA | 0.199 | −0.137 | 0.035 |
| X28: total flavonoids | 0.166 | 0.095 | −0.068 |
| X29: chlorogenic acid | 0.017 | −0.096 | 0.375 |
| X30: quercetin | −0.046 | −0.147 | −0.002 |
| X31: gallic acid | 0.149 | −0.038 | −0.295 |
| X32: kaempferol | −0.007 | 0.06 | 0.255 |
| X33: total amino acids | −0.166 | 0.095 | −0.353 |
| X34: moisture | −0.193 | 0.151 | 0.080 |
| Eigenvalues | 21.942 | 6.271 | 2.415 |
| Proportion (%) | 64.537 | 18.444 | 7.104 |
| Cumulative (%) | 64.537 | 82.981 | 90.085 |
| No | F1 | F2 | F3 | U1 | U2 | U3 |
| Rank |
|---|---|---|---|---|---|---|---|---|
| S0831‐1 | −1.67 | 0.216 | −0.99 | 0 | 0.468 | 0 | 0.089 | 11 |
| S0831‐2 | −1.651 | 0.083 | −0.934 | 0.006 | 0.413 | 0.035 | 0.085 | 12 |
| S0831‐3 | −1.57 | −0.006 | −0.911 | 0.033 | 0.376 | 0.049 | 0.097 | 10 |
| S0915‐1 | −0.222 | −0.917 | 0.48 | 0.473 | 0 | 0.904 | 0.380 | 8 |
| S0915‐2 | −0.257 | −0.879 | 0.431 | 0.462 | 0.016 | 0.874 | 0.373 | 9 |
| S0915‐3 | −0.224 | −0.913 | 0.515 | 0.473 | 0.002 | 0.926 | 0.381 | 7 |
| S0930‐1 | 1.367 | 1.317 | 0.021 | 0.993 | 0.922 | 0.622 | 0.879 | 2 |
| S0930‐2 | 1.388 | 1.494 | −0.111 | 1 | 0.995 | 0.541 | 0.891 | 1 |
| S0930‐3 | 1.271 | 1.506 | −0.114 | 0.962 | 1 | 0.539 | 0.867 | 3 |
| S1015‐1 | 0.483 | −0.592 | 0.514 | 0.704 | 0.134 | 0.925 | 0.560 | 5 |
| S1015‐2 | 0.441 | −0.512 | 0.463 | 0.69 | 0.167 | 0.894 | 0.555 | 6 |
| S1015‐3 | 0.642 | −0.797 | 0.636 | 0.756 | 0.049 | 1 | 0.584 | 4 |
- —Key R&D Program of Shandong Province, China
- —Key Technology Research and Development Program of Shandong Province10.13039/100014103
Peer Reviews
No public reviews on file for this paper yet. If you reviewed it on a platform where reviews are public (OpenReview, ICLR, NeurIPS, ICML), you can paste yours below so the community can read it here.
Videos
No videos yet. Explain this paper in a talk, walkthrough, or lecture? Add one.
Taxonomy
TopicsPlant-Derived Bioactive Compounds · Seed Germination and Physiology · Nuts composition and effects
Introduction
1
Acer truncatum Bunge (Purpleblow maple, 2n = 2x = 26), a species native to northern and western China, belongs to the genus Acer and is endemic to China. Its samara resembles an ancient Chinese ingot, hence the Chinese name “yuan bao feng”.
Valued for its exceptional greenery and ornamental qualities, A. truncatum exhibits vigorous growth, a dense shading canopy, an elegant tree structure, and attractive leaf morphology. The young leaves are red, whereas the autumn foliage turns orange‐yellow or red, making it a premium species for autumn scenery (Fan et al. 2022).
In traditional practices within its native range, the leaves of A. truncatum were used to produce maple tea, and its roasted seeds were consumed directly. The hard, durable timber has been widely employed for making utensils and construction materials (Huang et al. 2007; Zhao et al. 2011). Furthermore, traditional medical texts document the efficacy of its roots and leaves in dispelling wind and dampness and relieving waist and back pain (Soyolt and Pei 2001).
In modern applications, A. truncatum has been developed into value‐added products such as instant tea and health tea (Fan et al. 2022).
Maple leaves are known for their pharmacological properties and are highly valued for their development. Specifically, the leaves of A. truncatum exhibit notable antitumor properties. Studies have demonstrated that its leaf extract significantly inhibits the proliferation of various human cancer cells, including liver (BEL‐7402), esophageal (CAES‐17), breast (MCF‐7), and gastric (BGC‐823) cancer lines. At a concentration of 60 μg/mL, the inhibition rates of these cell lines reached or exceeded 50%, indicating substantial anticancer potential (Zhao et al. 2006). Further contributing to its bioactivity, flavonoids from A. truncatum leaves play a significant role in antitumor activity. For instance, these compounds can inhibit the proliferation of Gejiu lung squamous cell strain (YTMLC) and mouse colon cancer CT‐26 cells, demonstrating time‐ and concentration‐dependent effects. Beyond antitumor effects, A. truncatum leaves also possess notable fatty acid synthase (FAS) inhibitory activity. Bioactive constituents containing gallic groups and flavonoid structures are considered the primary functional components responsible for this effect. Additionally, an abundant array of polyphenolic compounds in the leaves imparts notable antioxidant and antibacterial effects (Li et al. 2004; Zhang et al. 2008).
Owing to these diverse properties, A. truncatum leaves are regarded as a low‐cost and multifunctional source of bioactive compounds, demonstrating significant potential for applications in the functional food, pharmaceutical, and health product industries. However, the full exploitation of this potential is challenging. Studies have shown that the bioactive composition of A. truncatum leaves varies significantly throughout their growth cycle under the influence of environmental and climatic factors (Yeasmen and Orsat 2023). Yet, current research has been limited to functional nutrient analysis at only isolated time points, making it impossible to track the dynamic changes of characteristic components over time. This lack of temporal resolution hinders the identification of the optimal harvesting and extraction period, thereby constraining efficient utilization of the leaves.
In addition to the pharmacological properties of its leaves, the seeds of A. truncatum show significant potential in the treatment of neurological disorders, owing to their high content of nervonic acid (NA; C24:1Δ15, 24:1ω‐9, cis‐tetracos‐15‐enoic acid, ~5%) (Fan et al. 2018; Gu et al. 2019; Qiao et al. 2019). Moreover, in 2011, the seed oil, which is rich in unsaturated fatty acids (UFA, ~92%) and NA, was approved as a novel food ingredient by the Chinese Ministry of Health (http://www.nhc.gov.cn/). UFAs maintain membrane fluidity by reducing lipid packing density, thereby enabling cells to adapt to rigidifying conditions such as low temperature (DeMendoza and Pilon 2019). They are classified into two main categories: monounsaturated fatty acids (MUFAs), which contain one double bond in the carbon chain—with oleic acid (C18:1) being a representative example, and polyunsaturated fatty acids (PUFAs), which possess two or more double bonds, such as linoleic acid (LA, C18:2), linolenic acid (C18:3), and arachidonic acid (Liu, Shen, et al. 2023). Among them, PUFAs play vital roles in inflammatory responses, cancer prevention, cellular function, and lipid metabolism (Delmas and Aires 2025). For example, LA exhibits neuroprotective effects by suppressing the secretion of pro‐inflammatory cytokines such as TNF‐α and IL‐1β, thereby inhibiting microglial activation (Tan et al. 2022). Dietary DHA exerts anticancer effects by promoting ROS production to reduce tumor cell metastasis and invasion, as well as by inhibiting serine 437 phosphorylation on AKT through the PI3K‐AKT pathway to induce apoptosis (Yin et al. 2017). Furthermore, the specific biological functions of fatty acids are closely linked to their relative proportions and overall composition. During the maturation process of A. truncatum seeds, the fatty acid profile undergoes dynamic changes, influencing both functional efficacy and nutritional value. However, critical data gaps remain regarding which maturation stage yields seeds with the highest functional activity for neurological support or optimal nutritional quality. This lack of temporally specific profiling hinders the targeted development of A. truncatum seed oil as a high‐value functional product.
In this study, the contents of total flavonoids, chlorogenic acid, gallic acid, quercetin, kaempferol, VC, total 21 amino acids, and moisture in A. truncatum leaves collected in different months were determined. In addition to the aforementioned parameters, we also determined the fatty acid content in A. truncatum seeds during the maturation process. Finally, we conducted a comprehensive evaluation of the nutritional quality of leaves and seeds at different times using the evaluation model. On the basis of the findings of this study, the nutritional dynamics of A. truncatum leaves and seeds can be effectively characterized across developmental stages, providing critical insights into their quality variations. This knowledge facilitates the optimized utilization of A. truncatum resources and supports the sustainable growth of the woody industry in China.
Materials and Methods
2
Plant Material and Reagents
2.1
The plant specimens of A. truncatum were acquired from a dedicated cultivation base in Liaocheng City, China, for the purposes of this study. Leaf samples of A. truncatum were collected monthly in mid‐April through mid‐October 2023, yielding seven samples identified by their collection dates (MMDD) as L0415, L0515, L0614, L0716, L0815, L0915, and L1015. Samaras were collected on four dates (August 31, September 15, September 30, and October 15), and the corresponding samples were labeled S0831, S0915, S0930, and S1015. All collected samples were immediately placed in a portable cooler box for transport to the laboratory. The collected specimens were immediately frozen in liquid nitrogen for cryopreservation. A quarter portion of each sample was freeze‐dried. The resulting lyophilized material was ground into a powder using a mixer mill at 22,000 rpm, homogenized through a 60‐mesh sieve, and stored at −80°C pending further analysis. Throughout the sampling process, strict random sampling principles were adhered to. To ensure comprehensiveness and representativeness, samples were collected from various positions within each tree canopy, including the upper, middle, and lower layers, as well as from all four cardinal directions: east, south, west, and north.
The acetonitrile and methanol (High Performance Liquid Chromatography, HPLC grade) were purchased from Merck (Darmstadt, Germany). Deionized water was prepared by a Milli‐Q water purification system (Millipore, France). The formic acid was obtained from Rhawn (Shanghai, China). The Folin Ciocalteu reagent was purchased from Sangon Biotech (Shanghai, China). Chlorogenic acid, quercetin, kaempferol, and other reference standards were purchased from Source Leaf Biotechnology Co. Ltd. (Shanghai, China). Other reagents used in our work were brought from Sinopharm Chemical Reagent Co. Ltd. (Shanghai, China).
Ultrasound‐Assisted Extraction of Oil From
A. truncatum Seeds
2.2
Twenty grams of A. truncatum seed powder was mixed with 400 mL of petroleum ether and extracted in a covered bottle using an ultrasonic device (250 W, 40 kHz, 40°C–60°C) for 45 min. Heat the mixture in an oven at 75°C overnight, and filter it using a Büchner funnel vacuum filtration apparatus with a 0.22 μm filter membrane. Preserve the filtrate. Remove the extraction solvent using a rotary evaporator (38°C, 85 rpm), and dry and concentrate the filtrate to a constant weight.
Determination of Several Nutritional Components
2.3
The total flavonoid content was analyzed according to NY/T 1295 and quantified using a calibration curve constructed with rutin as the standard. Chlorogenic acid, quercetin, gallic acid, kaempferol, and vitamin C (Vc) were determined using a modified HPLC with Ultraviolet Detection (HPLC‐UV) method on the basis of the procedure described by Yi et al. (2019). Free amino acids were analyzed by the ninhydrin colorimetric method using leucine as the standard, and their concentrations were expressed as mg per g DW. The moisture content of A. truncatum was determined by heating 10 g of chopped sample at 105°C for 6 h (Liu et al. 2024). Fatty acid composition in A. truncatum seed oil was analyzed according to the method specified in the China National Standards (GB 5009.168–2016) (Liang et al. 2019).
Data Processing and Statistical Analysis
2.4
All experiments were performed in triplicate, and results are expressed as mean ± standard deviation. Data were analyzed by one‐way ANOVA with Tukey's honestly significant difference (HSD) post hoc test for multiple comparisons using SPSS (SPSS Inc., Chicago, IL, USA). Differences were considered statistically significant at p < 0.05. Principal component analysis (PCA), hierarchical cluster analysis (HCA), and comprehensive quality evaluation modeling were conducted using SPSS. Orthogonal partial least squares‐discriminant analysis (OPLS‐DA) was performed using SIMCA software.
Results and Discussion
3
Temporal Dynamics of Eight Nutrient Compositions in
A. truncatum Leaves From April to October
3.1
As is well‐established, the nutritional composition of the same plant tissue can vary considerably across different growth stages (Zhou et al. 2024). According to Figure 1A, the total flavonoid content on May 15 was significantly higher than that in other months, reaching 5.62% ± 0.1%, and the total flavonoid content from June to October tended to be stable (3.55% ± 0.27%). This variation may be attributed to seasonal changes in environmental conditions and plant physiological priorities. During spring, the metabolic activity of newly emerged leaves is heightened, leading to substantial synthesis of total flavonoids as a protective mechanism against ultraviolet radiation and pathogens. In contrast, during summer, the metabolism of plant leaves tends to stabilize and resources are redirected toward growth, flowering, and fruiting activities, resulting in a decline in leaf flavonoid concentrations (Formato et al. 2022).
The levels of total flavonoids, chlorogenic, quercetin, gallic acid, kaempferol, VC, total 21 amino acids, and moisture content in different A. truncatum leaf samples. Significant differences are indicated by different letters (one‐way ANOVA with Tukey's test, p < 0.05) for multiple groups. Data are mean ± SD (n = 3).
Chlorogenic acid, which is a plant secondary metabolite, has become a versatile natural food additive with diverse industrial applications because of its multifunctional activities, including antioxidant, anti‐inflammatory, antimicrobial, anticancer, antidiabetic, and anti‐obesity properties (He et al. 2025; Niggeweg et al. 2004). The chlorogenic acid content in maple leaves was high on April 15, May 15, and June 14, with the peak concentration (3.38 ± 0.31 mg/g) observed on May 15 (Figure 1B). This is because maple leaves enter a rapid growth stage in spring (April and May), and photosynthesis is enhanced, leading to active metabolic activities. Chlorogenic acid is an important secondary metabolite, and its synthesis increases as the leaf grows and metabolic activities become more active, thus reaching its peak in May. However, gallic acid (Figure 1C) exhibited a “single‐peak” pattern, where its content peaked on May 15 (labeled as “a”) and then continued to decline. This suggests that the growth period is a key factor regulating its accumulation, and the subsequent decrease in expression levels may be involved in oxidative stress or the conversion into other components (such as tannins) (Gessler et al. 2004; Rawat et al. 2018).
Quercetin (Figure 1D) showed significantly higher accumulation levels on June 14 (1.80 ± 0.17 mg/g), whereas kaempferol (Figure 1E) maintained relatively stable concentrations across all growth stages with no significant differences. Quercetin and kaempferol, as flavonol compounds, exhibit distinct seasonal accumulation patterns in maple leaves. The observed delayed accumulation pattern of quercetin likely stems from its biosynthetic pathway's dependence on multi‐step enzymatic reactions (e.g., catalysis by flavonol synthase) (Ma et al. 2003). This process requires precursor flavonoids (including total flavonoids, particularly dihydroflavonols) to accumulate to a critical threshold before efficient initiation (Zhu et al. 2024). In contrast, the stable levels of kaempferol throughout the growth period are likely due to A. truncatum 's fundamental physiological requirement (e.g., functioning as an antioxidant, controlling physiological processes, and strengthening defenses against pests and diseases), resulting in a dynamic equilibrium state between its synthesis and degradation (Belkheir et al. 2016).
In A. truncatum leaves, Vc and total amino acids—as two additional nutritional components—exhibited synchronized accumulation patterns during the late growth phase. As shown in Figure 1F, Vc content peaked on September 15 (labeled “a”, p < 0.05). Concurrently, total amino acids (Figure 1G) also reached a significant accumulation maximum on September (labeled “a”, p < 0.05). This coordinated accumulation aligns with metabolic characteristics during leaf maturation: as leaves develop, photosynthetic products (e.g., glucose) are increasingly channeled into Vc biosynthesis primarily through the L‐galactose pathway of ascorbate synthesis. Simultaneously, enhanced nitrogen assimilation capacity—evidenced by elevated glutamine synthetase (GS) activity—drives the expansion of the amino acid pool. The temporally synchronized accumulation of these compounds serves as a key indicator for determining the onset of the “nutritional maturity stage” in A. truncatum leaves (occurring around September 15).
Leaf moisture decreased monotonically from 74.34% ± 0.17% in April 15 to 56.99% ± 0.17% by October 15 (Figure 1H), reflecting natural desiccation during senescence. This trend is directly related to both leaf structural development (e.g., thickening of the cuticle, lignification of cells) and environmental adaptation (e.g., water redistribution following summer transpiration) (Ji et al. 2025).
In a word, these results clarify the dynamic accumulation patterns of various nutritional components in A. truncatum leaves, providing critical insights for their refined development and high‐value applications in the food industry. For instance, May is the optimal period for extracting total flavonoids and chlorogenic acid, making it suitable for developing functional foods or natural additives with antioxidant and anti‐inflammatory properties. June stands out for its high quercetin content, which can be targeted for the extraction of specific health‐promoting compounds. By September, Vc and amino acids simultaneously reach their peaks, indicating that the leaves have entered a nutritionally mature stage, ideal for processing into dietary supplements or sports food ingredients. These temporal characteristics offer clear practical guidance for the extraction of functional components, selection of high‐quality raw materials, and seasonal adaptive utilization of A. truncatum leaves.
Comprehensive Quality Assessment of
A. truncatum Leaves in Different Growing Months
3.2
In addition to analyzing the main components of the leaves each month, we also need to evaluate their comprehensive nutritional value to fully leverage the potential of A. truncatum leaves. The comprehensive quality evaluation model, a mathematical approach developed from PCA, enables holistic multi‐indicator quality assessment while enhancing evaluation accuracy and efficiency (Liu, Wan, et al. 2023; Zhao et al. 2021). In this study, the original matrix (21 × 8) of quality indicators in A. truncatum leaves across different growth months was subjected to PCA. On the basis of the total eigenvalues (> 1) derived from the correlation coefficient matrix and the variance contribution rates of each principal component, principal components (P) were extracted. Ultimately, Principal Component 1 (P1), Principal Component 2 (P2), and Principal Component 3 (P3) were identified. As shown in Table 1, the eigenvalues corresponding to these principal components were 4.144, 1.957, and 1.127, respectively. P1 accounted for 57.334% of the total variance, representing over half of the information contained in the original variables. P2 contributed 27.073%, and P3 contributed 15.592%. The cumulative contribution rate of these three principal components reached 80.301%, indicating that they collectively represent 80.301% of the information from the measured quality indicators.
TABLE 1: Principal component analysis of A. truncatum leaves: Eigenvalues, variance explanation, and eigenvectors (components with eigenvalues > 1).
The eigenvectors associated with the eigenvalues elucidate the relationships between the principal components and the original variables. The strength of these relationships is proportional to the absolute value of the eigenvector loadings. According to Table 1, P1 exhibited strong correlations with gallic acid, Vc, and total 21 amino acids. P2 was strongly correlated with total flavonoids, quercetin, and moisture. P3 showed strong correlations with chlorogenic acid and kaempferol flavonoids. To further explain the relationship between the quality indicators of A. truncatum leaves and the principal component factors, the functional expressions of the three principal components F1, F2, and F3, were obtained as follows, and X1–X8 represent the standardized variables of the quality indicators.
As presented in Table 2, the membership values U1, U2, and U3 were calculated using the membership function U (Xj). Subsequent integration of these values with their corresponding weight values (Wj) yielded the comprehensive evaluation index (D‐value). The results indicate that the three leaf samples collected in May achieved the highest quality scores (0.867, 0.881, and 0.920), followed by the three April samples (0.634, 0.646, and 0.671). These findings suggest that young A. truncatum leaves harvested in spring, with peak quality observed in mid‐May, offer superior nutritional value and are highly suitable for product development. The relevant formulas are provided below.
TABLE 2: Comprehensive evaluation of A. truncatum leaves' quality on the basis of the growth cycle.
Temporal Dynamics of Seven Nutrient Compositions in A. truncatum Seeds From August to October
3.3
The plant growth and development stages have a significant impact on the formation of nutrients in oil seeds (Sambanthamurthi et al. 2000). To characterize A. truncatum seed nutrient compositions, the contents of total flavonoids, chlorogenic acid, quercetin, gallic acid, kaempferol, total amino acids (21 types), and moisture were analyzed across different months (Figure 2). The results revealed that total flavonoid (Figure 2A) and quercetin (Figure 2C) contents peaked on September 30 and September 15, respectively. The highest levels of total amino acids (Figure 2F) and moisture (Figure 2G) occurred on August 31. Conversely, chlorogenic acid (Figure 2B), gallic acid (Figure 2D), and kaempferol (Figure 2E) levels showed no statistically significant variation across the sampling period, indicating their potential role as constitutive defense compounds in A. truncatum seeds. These compounds likely maintain basal stress resistance functions, including pathogen defense and UV protection (Farhadi et al. 2025). Given the elevated total flavonoid content detected in late September, seeds harvested during this period may possess enhanced antioxidant potential and skin‐brightening properties, as supported by previous studies (Tohidi et al. 2017).
The levels of total flavonoids, chlorogenic, quercetin, gallic acid, kaempferol, total 21 amino acids, and moisture content in different A. truncatum seed samples. Significant differences are indicated by different letters (one‐way ANOVA with Tukey's test, p < 0.05) for multiple groups. Data are mean ± SD (n = 3).
The Dynamic Changes in the Content of Different Types of Fatty Acids in Seeds
3.4
During seed development of A. truncatum , the contents of total fatty acids (total FA), unsaturated fatty acids (UFA), and monounsaturated fatty acids (MUFA) increased significantly from August 31 to September 30, reaching peak values of 85.36 ± 1.67, 76.63 ± 1.65, and 50.83 ± 1.24 g/100 g, respectively, followed by a slight decline by October 15 (Figure 3A). In contrast, polyunsaturated fatty acids (PUFA) decreased sharply to their lowest level (25.80 ± 0.90 g/100 g) on September 30 before rising rapidly to 40.60 ± 2.13 g/100 g by mid‐October, whereas saturated fatty acids (SFA) remained stable throughout (Figure 3A). This pattern is consistent with other oil crops such as peanut and rapeseed, where total FA accumulation initially increases to a maximum and then slightly decreases during late maturation (Hills 2004; Liu et al. 2018; Zhang et al. 2023). The underlying reason may be that the vegetative organs of the plant begin to senesce at the later stages of development, leading to a rapid decline in photosynthetic capacity, whereas the synthesis of proteins and monosaccharides required for full maturity consumes part of the oil reserves (Baud et al. 2002; Hymowitz et al. 1972).
Total amount of SFA, UFA, MUFA, and PUFA during A. truncatum seed development (A), and (B) oil content at four sampling dates (S0831, S0915, S0930, and S1015). Significant differences are indicated by different letters (one‐way ANOVA with Tukey's test, p < 0.05) for multiple groups. Data are mean ± SD (n = 3).
The nutritional quality and storability of edible oil are largely determined by the fatty acid composition of the oilseed (García‐González and Quintero‐Flórez 2023; Yildiz et al. 2025). MUFA (primarily oleic acid) is widely recognized for its positive effects on cardiovascular health and oxidative stability, making it a desirable component in edible oils (Gershuni 2018; Schwingshackl and Hoffmann 2014). Conversely, PUFA, despite being essential fatty acids, is more susceptible to oxidation, which can reduce oil shelf‐life and lead to rancidity (Okubanjo et al. 2019). SFA, whereas necessary for energy and biological functions, should be consumed in moderation to avoid potential cardiovascular risks (Gillingham et al. 2011). Therefore, a high MUFA content, combined with moderate SFA and low PUFA levels, is generally considered ideal for edible oils (Hooper et al. 2020). The A. truncatum oil seed composition observed on September 30—characterized by high oil content of 29.50% ± 0.527% (Figure 3B), elevated levels of UFA and MUFA, along with low PUFA content—achieves an optimal balance between nutritional quality and oxidative stability. In contrast, the sharp rise in PUFA by October 15 significantly increases susceptibility to oxidation, compromising long‐term storage stability. Furthermore, the oil yield on August 31 was significantly lower than that on September 30, reinforcing the latter's advantage not only in fatty acid profile but also in extraction efficiency. Thus, considering the dynamic changes in fatty acid composition and their direct impact on oil quality and storability, September 30 is established as the optimal harvest time for A. truncatum seeds, providing the best combination of nutritional value and functional stability.
Multivariate Statistical Analysis of 23 Free Fatty Acids in Seeds
3.5
The PCA method has been widely used to evaluate the quality of agricultural products such as miscellaneous cassava tubers, kiwifruit, bayberry, and rice (Chen et al. 2024; Peng et al. 2023; Wei et al. 2017; Xu et al. 2022). By reducing the dimensionality of the data and eliminating overlapping information from numerous sources, the evaluation process is simplified, making it faster and more accurate than a single evaluation. In this study, PCA was used to analyze 23 free fatty acids in seeds to provide a comprehensive evaluation of nutritional quality differences in A. truncatum seeds across growth stages. As shown in Figure 4A, the 12 A. truncatum seed samples were divided into four regions on the basis of the first principal component (t [1]) and the second principal component (t [2]), which together accounted for nearly 80.8% of the total variance. In terms of sample distribution, the S0831 samples were primarily concentrated on the left side of the t [1] axis and within the 0–2 range of the t [2] axis. The S0915 and S1015 samples clustered in the −1 to −4 range of the t [2] axis, with a high degree of overlap between their distribution areas. In contrast, the S0930 samples were distinctly distributed on the right side of the t [1] axis and within the 2–4 range of the t [2] axis, showing clear separation from samples collected at the other three time points. This indicates that the S0930 samples have a significantly distinct nutritional composition compared to those from other months. The location of variables in the loading plot explains the reasons why certain observations form clusters in the score plot (Alkan et al. 2011). In the PCA loading plot (Figure 4B), components such as C17:1, C18:2n6, C20:0, C17:0, C18:0, and C20:1 exhibited positive and relatively high loading values. These components were primarily distributed on the right side of the p [1] axis, corresponding to the distribution area of the September 30 (S0930) samples in the score plot. This indicates that the contents of these components were higher in the A. truncatum seeds collected on September 30, and they are the key characteristic components responsible for the distinct separation of the samples from this time point from those of other stages.
The score plot (A) and loading plot (B) of PCA and heatmaps (C) of four A. truncatum seed samples for about 23 fatty acids.
HCA is another statistical method widely used in recent years. HCA classifies the research objects according to their degree of affinity in quality indicators, to analyze the similarity and difference between the nutritional quality of the samples (DeCarlo et al. 2019; Liu et al. 2024). Therefore, HCA (Figure 4C) was further conducted on the average contents of fatty acids in 12 A. truncatum seed samples. On the basis of their accumulation trends during the growth cycle, these fatty acids were clustered into three groups: Cluster 1 contained six fatty acids (including notable fatty acids such as C16:1, C17:0, C18:0, C20:0, C17:1 and C18:2n6t), whereas Cluster 2 (C18:3n6, C14:1, C18:2n6c, C16:0, C20:2, C24:0, C22:1n9 and C24:1) and Cluster 3 (C22:0, C23:0, C18:1n9c, C20:1, C18:3n3, C20:3n3, C22:2, C18:1n9t and C22:6n3) each contained eight. This demonstrates that fatty acids within the same group share similar accumulation patterns during growth.
To better identify the key fatty acids responsible for compositional differences in A. truncatum seed oil across developmental stages, an OPLS‐DA model was constructed on the basis of the four sample groups previously established by PCA and HCA. As a supervised method, OPLS‐DA effectively minimizes systemic noise and highlights variables that contribute most to group separation, offering improved classification efficiency over unsupervised PCA (Mais et al. 2018). The score plot of the OPLS‐DA model showed clear discrimination between the S0930 sample and samples from other time points (Figure 5A). The model exhibited high explanatory and predictive ability, with R ^2^ Y and Q ^2^ values of 0.925 and 0.998, respectively. On the basis of thresholds of VIP > 1 and fold change (FC) > 1, two groups of fatty acids were identified as significantly upregulated in S0930. The first group (VIP > 1 and FC > 1) included C17:1, C18:2n6t, C20:0, C18:0, C17:0, C16:1, C20:1, and C18:1n9c. A second group (FC > 1) consisted of C23:0, C20:3n3, C22:1n9, C24:1, C18:3n3, and C24:0 (Table 3). These results indicate that the S0930 oil possesses a functionally distinctive fatty acid profile. Notably, the high levels of nervonic acid (C24:1) suggest potential neuroprotective benefits (Yuan et al. 2023), whereas elevated oleic acid (C18:1n9c) may improve oxidative stability (Rodríguez‐Blázquez and Gómez‐Mejía 2023). The presence of essential fatty acids such as α‐linolenic acid (C18:3n3) further supports its nutritional value (Vinyard et al. 2025), collectively positioning S0930 A. truncatum seed oil as a promising functional ingredient.
The OPLS‐DA score plot (A) and VIP plot (B) between the S0930 sample and other samples (S0831, S0915, and S1015).
**TABLE 3: Variable importance in projection (VIP) and fold change (FC) of fatty acids in A. truncatum seed oil from multivariate models. The upward arrow (↑) indicates that the fatty acids content in sample S0930 is higher than in the other samples (S0831, S0915, and S1015). The asterisks denote significant differences based on Student’s t‐test (*P < 0.05, **P < 0.01, *P < 0.001) for comparisons between S0930 and the other samples.
Comprehensive Quality Assessment of
A. truncatum Seeds in Different Growing Months
3.6
Xu et al. utilized a comprehensive quality evaluation model to calculate the comprehensive quality scores of different varieties' rapeseed oil, evaluated the quality of the harvested rapeseed oil, and selected the best variety (Xu et al. 2025). To quantitatively assess the quality of A. truncatum seed oil across maturation stages, we developed a multivariate model on the basis of monthly variations in fatty acids (23 types), SFA, UFA, MUFA, PUFA, bioactive compounds (total flavonoids, chlorogenic acid, quercetin, gallic acid, kaempferol), total amino acids, and moisture content. PCA was conducted on the correlation coefficient matrix, extracting components on the basis of eigenvalues exceeding 2 and variance contribution rates. Three principal components were identified: P1 (eigenvalue = 21.942, variance contribution = 64.537%), P2 (eigenvalue = 18.444, cumulative variance = 82.981%), and P3 (eigenvalue = 7.104, cumulative variance = 90.085%). Collectively explaining 90.085% of the total variance, these components effectively captured 90.085% of the original quality indicators' information (Table 4).
TABLE 4: Principal component analysis of A. truncatum seeds: Eigenvalues, variance explanation, and eigenvectors (components with eigenvalues > 2).
To further elucidate relationships between A. truncatum seed quality indicators and principal component factors, we derived three principal component expressions (F1, F2, and F3) from characteristic vectors associated with 23 fatty acids, SFA, UFA, MUFA, PUFA, total flavonoids, chlorogenic acid, quercetin, gallic acid, kaempferol, total amino acids, and moisture content. Nutritional indicator concentrations were standardized to generate new variables (denoted X1‐X34) for this analysis. The comprehensive evaluation value D was obtained using the aforementioned method, as shown in Table 5. On the basis of the ranking of the comprehensive evaluation indicators, the top 3 samples were S0930‐1, S0930‐2, and S0930‐3, whereas the sample with the poorest ranking was S0831‐1, S0831‐2, and S0831‐3. This result indicates that the nutritional value of the A. truncatum seed on September 30 is the highest, so the collection of A. truncatum seeds should be carried out at this time point.
TABLE 5: Comprehensive evaluation of A. truncatum seed quality on the basis of the growth cycle.
Conclusions
4
This study investigates the dynamic changes in key bioactive compounds in the leaves and seeds of A. truncatum across different growth stages. The findings reveal that the accumulation of these phytochemicals is highly dependent on the plant's developmental phase. In leaves, the optimal harvest time was determined to be May 15, as it corresponded with peak levels of total flavonoids, chlorogenic acid, and gallic acid. For seeds, the optimal harvest date was September 30, characterized by the highest content of total flavonoids, total FA, UFA, and MUFA, despite a temporary dip in PUFA on that date, which subsequently increased. Multivariate analysis confirmed these time points as ideal for maximizing the yield of valuable components. The research provides crucial data on the temporal variation of characteristic compounds in A. truncatum , establishing a theoretical basis for optimizing harvest timing and developing targeted processing technologies to enhance the utilization of this bioactive‐rich plant.
Author Contributions
Xiangjun Ma: investigation, visualization, and writing – original draft. Rui Gao: investigation. Lei Gao: writing – review and editing. Xuexia Yuan: writing – review and editing. Tong Zhao: conceptualization. Haining Hao: formal analysis. Hongxia Du: methodology. Rongqi Zhai: investigation. Chan Zhang: investigation, methodology. Jingxiu Bi: investigation, methodology, formal analysis, visualization, writing – original draft, writing – review and editing. Yutao Wang: funding acquisition and writing – review and editing. Pingxiang Liu: funding acquisition and writing – review and editing.
Conflicts of Interest
The authors declare no conflicts of interest.
The reference list from the paper itself. Each links out to its DOI / PubMed record.
- 1Alkan, D. , F. Tokatli , and B. Ozen . 2011. “Phenolic Characterization and Geographical Classification of Commercial Extra Virgin Olive Oils Produced in Turkey.” Journal of the American Oil Chemists' Society 89: 261–268. 10.1007/s 11746-011-1917-6. · doi ↗
- 2Baud, S. , J. P. Boutin , M. Miquel , L. Lepiniec , and C. Rochat . 2002. “An Integrated Overview of Seed Development in Arabidopsis thaliana Ecotype WS.” Plant Physiology and Biochemistry 40: 151–160. 10.1016/S 0981-9428(01)01350-X. · doi ↗
- 3Belkheir, A. K. , M. Gaid , B. Liu , R. Hänsch , and L. Beerhues . 2016. “Benzophenone Synthase and Chalcone Synthase Accumulate in the Mesophyll of Hypericum perforatum Leaves at Different Developmental Stages.” Frontiers in Plant Science 7: 921. 10.3389/fpls.2016.00921.27446151 PMC 4926534 · doi ↗ · pubmed ↗
- 4Chen, L. , R. Chen , and E. M. Atwa . 2024. “Nutritional Quality Assessment of Miscellaneous Cassava Tubers Using Principal Component Analysis and Cluster Analysis.” Food 13: 1861. 10.3390/foods 13121861.PMC 1120326938928804 · doi ↗ · pubmed ↗
- 5De Carlo, A. , S. Johnson , K. I. Okeke‐Agulu , et al. 2019. “Compositional Analysis of the Essential Oil of Boswellia dalzielii Frankincense From West Africa Reveals Two Major Chemotypes.” Phytochemistry 164: 24–32. 10.1016/j.phytochem.2019.04.015.31071599 · doi ↗ · pubmed ↗
- 6Delmas, D. , and V. Aires . 2025. “Polyunsaturated Fatty Acids: New Molecular Mechanisms and Nutritional Therapeutic Challenges.” Nutrients 17: 588.39940446 10.3390/nu 17030588 PMC 11820617 · doi ↗ · pubmed ↗
- 7De Mendoza, D. , and M. Pilon . 2019. “Control of Membrane Lipid Homeostasis by Lipid‐Bilayer Associated Sensors: A Mechanism Conserved From Bacteria to Humans.” Progress in Lipid Research 76: 100996. 10.1016/j.plipres.2019.100996.31449824 · doi ↗ · pubmed ↗
- 8Fan, H. , L. Sun , L. Yang , et al. 2018. “Assessment of the Bioactive Phenolic Composition of Acer truncatum Seed Coat as a Byproduct of Seed Oil.” Industrial Crops and Products 118: 11–19. 10.1016/j.indcrop.2018.03.030. · doi ↗