Food Insecurity Associated With Higher Odds of Hypertriglyceridemic Waist Phenotype in Women: A Cross‐Sectional Study
Paria Jadidi, Atieh Mirzababaei, Faezeh Abaj, Azadeh Dehghani, Neda Valisoltani, Moloud Ghorbani, Cain C. T. Clark, Khadijeh Mirzaei

TL;DR
Food insecurity increases the risk of a metabolic condition called hypertriglyceridemic waist in overweight and obese Iranian women.
Contribution
This is the first study to directly link food insecurity to the hypertriglyceridemic waist phenotype in this population.
Findings
Food-insecure women had over twice the odds of having the HTGW phenotype compared to food-secure women.
The association remained significant after adjusting for age, BMI, energy intake, and physical activity.
The study highlights food insecurity as a social determinant of metabolic risk in overweight and obese women.
Abstract
Food insecurity has been linked to obesity, central adiposity, and dyslipidemia, with women particularly vulnerable. These consequences align with the hypertriglyceridemic waist (HTGW) phenotype, a determinant of visceral adiposity and cardiometabolic risk. Although prior studies suggest associations between FI, waist circumference, and triglyceride levels, direct evidence on FI and HTGW remains scarce, especially in Middle Eastern populations. The present investigation assessed the potential link between food insecurity and the hypertriglyceridemic waist phenotype among overweight and obese Iranian women. In this cross‐sectional study, 250 overweight and obese women dietary intake was assessed using a validated 147‐item (FFQ), and household food security was evaluated with the 18‐item USDA (HFSS). Anthropometric measures and body composition were obtained via bioelectrical impedance…
Genes, proteins, chemicals, diseases, species, mutations and cell lines named across the full text — each resolved to its canonical identifier and authoritative record.
Click any figure to enlarge with its caption.
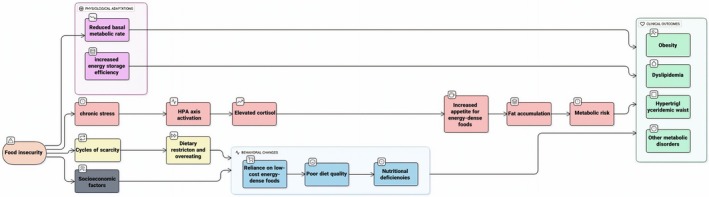 FIGURE 1
| Variables | Total | Normal | HTGW |
|
|
|---|---|---|---|---|---|
| Demographic variables | |||||
| Age (years) | 36.67 ± 9.19 | 36.46 ± 9.01 | 38.16 ± 9.67 | 0.25 | 0.28 |
| Anthropometric parameters | |||||
| Weight (kg) | 80.28 ± 11.05 | 79.74 ± 11.11 | 84.27 ± 9.77 |
|
|
| Height (cm) | 161.22 ± 5.87 | 161.04 ± 5.85 | 162.55 ± 5.90 | 0.100 | 0.170 |
| BMI (kg/m2) | 30.98 ± 3.90 | 30.84 ± 3.93 | 32.02 ± 3.52 |
|
|
| WHR (cm) | 1.16 ± 4.54 | 1.19 ± 4.85 | 0.95 ± 0.04 | 0.35 |
|
| WC (cm) | 99.16 ± 9.42 | 98.57 ± 9.41 | 103.40 ± 8.41 |
|
|
| Blood pressure | |||||
| SBP (mmHg) | 111.73 ± 13.62 | 110.81 ± 13.56 | 116.33 ± 13.10 |
| 0.11 |
| DBP (mmHg) | 77.60 ± 10.40 | 76.73 ± 10.54 | 81.97 ± 8.47 |
|
|
| Body composition | |||||
| BFM (kg) | 34.74 ± 8.75 | 34.50 ± 8.84 | 36.40 ± 7.93 | 0.12 |
|
| FFM (kg) | 46.52 ± 5.71 | 46.13 ± 5.64 | 49.33 ± 5.50 |
|
|
| SMM (kg) | 25.56 ± 3.44 | 25.32 ± 3.40 | 27.23 ± 3.27 |
|
|
| SLM (kg) | 43.77 ± 5.44 | 43.39 ± 5.37 | 46.53 ± 5.20 |
|
|
| BMR | 1377.56 ± 134.66 | 1369.48 ± 134.88 | 1435.57 ± 118.98 |
|
|
| Biochemical biomarkers | |||||
| FBS (mg/dL) | 87.49 ± 9.64 | 86.68 ± 8.71 | 90.91 ± 12.41 |
|
|
| TC (mg/dL) | 185.30 ± 35.77 | 180.08 ± 34.63 | 207.32 ± 32.22 |
|
|
| TG (mg/dL) | 118.10 ± 58.88 | 96.11 ± 35.37 | 209.63 ± 48.01 |
|
|
| HDL (mg/dL) | 46.58 ± 10.86 | 47.35 ± 10.75 | 43.32 ± 10.81 |
|
|
| LDL (mg/dL) | 95.30 ± 24.12 | 91.88 ± 23.20 | 109.73 ± 22.76 |
|
|
| Insulin (mlU/mL) | 1.21 ± 0.23 | 1.19 ± 0.22 | 1.30 ± 0.24 |
|
|
| AST (mg/dL) | 18.05 ± 7.75 | 17.55 ± 7.26 | 20.18 ± 9.33 | 0.07 |
|
| ALT (mg/dL) | 19.49 ± 13.83 | 18.41 ± 12.82 | 24.08 ± 16.88 |
|
|
| Inflammatory biomarkers | |||||
| hs‐CRP (mg/dL) | 4.34 ± 4.62 | 3.86 ± 4.29 | 6.43 ± 5.40 |
|
|
| HOMA Index | 3.35 ± 1.27 | 3.17 ± 1.12 | 4.14 ± 1.56 |
|
|
| Marital status | |||||
| Single | 73 (29.2) | 58 (36.5) | 15 (16.5) | 0.14 | 0.16 |
| Married | 177 (70.8) | 101 (63.5) | 76 (83.5) | ||
| Education | |||||
| Illiterate | 33 (13.1) | 12 (7.5) | 21 (23.1) | 0.28 | 0.25 |
| Diploma | 95 (37.9) | 59 (37.1) | 36 (39.6) | ||
| Bachelor | 122 (46.8) | 88 (55.3) | 34 (37.4) | ||
| Job | |||||
| Unemployed | 143 (57.2) | 92 (57.9) | 51 (56.0) | 0.11 | 0.12 |
| Employed | 107 (42.8) | 67 (42.1) | 40 (44.0) | ||
| Normal | HTGW |
| |
|---|---|---|---|
| Energy (kcal/day) | 2640.32 ± 818.93 | 2584.11 ± 745.69 | 0.62 |
| Protein (g/day) | 87.91 ± 30.04 | 89.67 ± 26.88 | 0.69 |
| Carbohydrate (g/day) | 364.72 ± 116.50 | 379.56 ± 120.61 | 0.20 |
| Fat (g/day) | 94.31 ± 33.84 | 89.96 ± 31.06 | 0.17 |
| Subtypes of fatty acids | |||
| Cholesterol (g/day) | 250.60 ± 108.22 | 257.20 ± 98.58 | 0.65 |
| SFA (g/day) | 27.82 ± 11.25 | 26.60 ± 10.39 | 0.26 |
| MUFA (g/day) | 31.69 ± 12.41 | 29.15 ± 10.30 | 0.09 |
| PUFA (g/day) | 20.30 ± 9.65 | 18.80 ± 7.48 | 0.26 |
| Trans fatty acid (g/day) | 0.001 ± 0.002 | 0.001 ± 0.001 | 0.88 |
| Micronutrients | |||
| Minerals | |||
| Calcium (mg/day) | 1152.75 ± 437.72 | 1142.15 ± 365.90 | 0.66 |
| Iron (mg/day) | 18.26 ± 5.96 | 19.39 ± 6.02 |
|
| Magnesium (mg/day) | 449.98 ± 145.06 | 482.84 ± 160.00 | 0.05 |
| Zinc (mg/day) | 12.65 ± 4.19 | 13.36 ± 4.40 | 0.09 |
| Selenium (mg/day) | 117.25 ± 42.14 | 126.50 ± 45.88 | 0.12 |
| Phosphor (mg/day) | 1617.01 ± 539.78 | 1648.80 ± 468.79 | 0.77 |
| Vitamins | |||
| C (mg/day) | 185.13 ± 105.51 | 201.40 ± 117.48 | 0.32 |
| D (μg/day) | 2.06 ± 1.75 | 1.57 ± 1.19 | 0.05 |
| E (mg/day) | 18.01 ± 9.85 | 14.59 ± 5.59 |
|
| B1 (mg/day) | 2.04 ± 0.65 | 2.17 ± 0.68 | 0.07 |
| B2 (mg/day) | 2.15 ± 0.80 | 2.22 ± 0.74 | 0.49 |
| B3 (mg/day) | 25.10 ± 9.68 | 25.91 ± 8.58 | 0.57 |
| B6 (mg/day) | 2.14 ± 0.72 | 2.21 ± 0.73 | 0.55 |
| B9 (mg/day) | 591.89 ± 174.81 | 634.70 ± 197.36 |
|
| B12 (mg/day) | 4.32 ± 2.49 | 4.57 ± 2.55 | 0.41 |
| Other nutrients | |||
| Fiber (g/day) | 44.20 ± 18.91 | 47.88 ± 19.26 | 0.18 |
| Sugar (g/day) | 139.35 ± 56.55 | 141.58 ± 58.17 | 0.99 |
| Glucose (g/day) | 20.66 ± 11.95 | 20.02 ± 10.20 | 0.51 |
| Galactose (g/day) | 2.78 ± 1.96 | 2.49 ± 1.83 | 0.35 |
| Fructose (g/day) | 24.92 ± 13.83 | 24.28 ± 12.53 | 0.54 |
| Sucrose (g/day) | 31.83 ± 18.62 | 33.45 ± 23.65 | 0.61 |
| Models | OR | 95% Cl |
|
|---|---|---|---|
| Crude model | |||
| Normal | Reference group | ||
| HTGW phenotype | 2.24 | 1.19–4.20 |
|
| Adjusted model | |||
| Normal | Reference group | ||
| HTGW phenotype | 2.13 | 1.06–4.28 |
|
- —Tehran University of Medical Sciences and Health Services10.13039/501100004484
Peer Reviews
No public reviews on file for this paper yet. If you reviewed it on a platform where reviews are public (OpenReview, ICLR, NeurIPS, ICML), you can paste yours below so the community can read it here.
Videos
No videos yet. Explain this paper in a talk, walkthrough, or lecture? Add one.
Taxonomy
TopicsFood Security and Health in Diverse Populations · Obesity, Physical Activity, Diet · Smoking Behavior and Cessation
Introduction
1
Inadequate access to food combined with unbalanced dietary habits represents a global health challenge, leaving billions of people at risk of malnutrition (Abbade and Dewes 2015). Food insecurity (FI) is defined as the uncertainty or restriction in obtaining adequate, safe, and nutritious food necessary to maintain health (IFAD UN 2017). The severity of FI can vary, from declines in food quality and quantity to recurrent hunger and skipped meals, and is largely influenced by socioeconomic and demographic factors such as unemployment, age, ethnicity, and limited education (Tabibian et al. 2018; Dave et al. 2009). Current global estimates indicate that more than one billion people fail to meet minimum energy and macronutrient needs, while nearly two billion individuals experience deficiencies in essential micronutrients (Barrett 2010). Women remain especially vulnerable to FI due to gender‐related disparities and the increasing number of households headed by women (Ivers and Cullen 2011). Data from Iran further underscore the seriousness of this issue, with a systematic review reporting FI prevalence rates of 49% among adolescents and 61% among mothers, levels notably higher than those observed in many other regions (Behzadifar et al. 2016). The impact of FI extends far beyond individual nutrition, playing a role in the development of long‐term health conditions and societal burdens. Persistent FI contributes to cardiovascular disease, type 2 diabetes, depression, and poor quality of life, underscoring its multidimensional impact on public health and the healthcare system (Zierath et al. 2023). Moreover, the economic costs of FI extend beyond individuals, placing a substantial strain on healthcare expenditures and social welfare programs (Chang et al. 2022).
In addition to its established role in undernutrition, FI can lead to increases in body weight, an effect frequently labeled the “food insecurity–obesity paradox” (Parker et al. 2010; Rasmusson et al. 2019). This pattern is most consistently observed among women, who appear more vulnerable to weight increases when experiencing food insecurity (Crespo‐Bellido et al. 2021). The earliest report of such a connection was provided by Dietz (1995), suggesting that recurring cycles of food scarcity may trigger both behavioral and physiological responses, including greater fat storage and poorer food choices (El Zein et al. 2020). These processes together offer a plausible explanation for the heightened prevalence of obesity in food‐insecure groups.
When access to affordable, nutrient‐dense foods like fruits and vegetables is limited, individuals often turn to cheaper, calorie‐dense options such as fast foods and sugar‐sweetened beverages. This dietary shift creates metabolic conditions that contribute to central obesity and elevated TG levels (Parikh and Mohan 2012). In contrast to conventional indicators such as BMI, which are unable to differentiate between fat mass and lean mass, the HTGW phenotype offers a more accurate reflection of visceral adiposity (Janghorbani et al. 2017; Zheng et al. 2022). Because of its simplicity, affordability, and strong predictive ability, HTGW is especially practical for both epidemiological research and clinical practice, particularly in low‐ and middle‐income settings where advanced diagnostic methods may not be available (Zheng et al. 2022).
The physiological changes described above significantly contribute to the onset of metabolic syndrome (MetS), which involves a cluster of metabolic abnormalities, including elevated blood pressure, impaired fasting glucose, high triglycerides, lowered HDL, and expansion of waist circumference (Wang et al. 2020). Within this context, the hypertriglyceridemic waist (HTGW) phenotype, defined by the simultaneous occurrence of enlarged waist circumference and raised triglyceride levels, serves as a validated marker of visceral fat accumulation and an enhanced cardiometabolic risk profile (Fernández‐García et al. 2020). Because FI, obesity, and lifestyle behaviors are modifiable risk factors, their role in shaping the HTGW phenotype warrants particular attention. Importantly, recent evidence highlights HTGW as a reliable predictor of cardiovascular disease, further underscoring its clinical relevance (Zheng et al. 2022). Evidence from Iran further illustrates the complex role of FI in influencing obesity‐related outcomes. In a cross‐sectional study of Tehran households, Mohammadi et al. (2013) indicated that severe FI contributed to a higher prevalence of central obesity, whereas moderate FI showed an inverse relationship with overweight in women. Similar associations have been reported elsewhere: women living in households with very low food security displayed significantly higher TG levels (Mohajeri and Mohajery 2022), while an analysis of U.S. women indicated a greater prevalence of waist circumference above 88 cm in low food security settings (Park and Strauss 2020). Comparable findings have also been documented in Asian populations, reinforcing the potential contribution of FI to adverse metabolic profiles (Mohajeri and Mohajery 2022).
Despite these observations, direct evidence linking FI to the HTGW phenotype in overweight and obese women remains limited, particularly within Middle Eastern populations. While several systematic reviews have documented associations between FI and cardiometabolic risk, to date, no research has explicitly examined the association between FI and HTGW among overweight Iranian women (Salinas‐Roca et al. 2022; Te Vazquez et al. 2021). Addressing this gap, the present study was designed to investigate the association between FI and the HTGW phenotype in a cohort of overweight and obese women.
Materials and Methods
2
Participants
2.1
This cross‐sectional investigation involved 250 women who were overweight or obese, enrolled from health centers in Tehran, Iran, between 2016 and 2017. Participants were females aged between 18 and 48 years, who possessed a BMI within the twenty‐five to forty kg/m^2^ range, who provided voluntary consent, and had no history of chronic conditions such as cancer, liver or kidney dysfunction, uncontrolled thyroid disorders, hypertension, or impaired glucose metabolism. Exclusion criteria encompassed the use of vitamin or mineral supplements, hormonal treatments, herbal medications, or steroids, as well as extreme energy intakes (< 800 kcal/day or > 4200 kcal/day). The study protocol received approval from the Ethics Committee of Tehran University of Medical Sciences (IR.TUMS.MEDICINE.REC.1402.172), ensuring that all participants gave written informed consent before being enrolled.
Anthropometric and Body Composition
2.2
Body weight was recorded to the nearest 0.1 kg using a digital calibrated scale (Seca, Hamburg, Germany), and height was measured using a wall‐mounted stadiometer (Seca, Hamburg, Germany) with a precision of 0.5 cm. Body mass index (kg/m^2^) was then calculated from these measurements. WC was determined at the midpoint between the lower rib margin and the iliac crest by a trained professional. Body composition parameters, including SLM, FFM, BFM, SMM, and BMR, were assessed using a multi‐frequency bioelectrical impedance analyzer (InBody 770, Seoul, South Korea). Fasting, absence of recent exercise, and removal of metallic items were required prior to the test.
Dietary Intake, Physical Activity, and Food Security
2.3
Participants' year‐long food consumption was evaluated by trained nutritionists employing a validated 147‐item FFQ. Nutrient intakes were calculated in grams using Nutritionist IV software. Physical activity was measured with the IPAQ, expressed in MET‐h/week and categorized as low (< 600), moderate (600–3500), or high (> 3500) (Craig et al. 2003; Moghaddam et al. 2012). Over the past year, trained staff collected information on households' access to sufficient food using the 18‐item USDA HFSS (Mohammadi et al. 2012), which had been tailored and validated for the Iranian population. It categorized households as secure or insecure (Savari et al. 2021). Scoring followed Gray and Bickel's methodology (Bickel et al. 2000), with total scores classifying participants into food‐secure or food‐insecure groups.
Biochemical and Clinical Measurements
2.4
A 10–12 h overnight fast preceded blood collection; samples were then centrifuged to separate the serum, which was maintained at −80°C for subsequent evaluation. Serum TG, TC, LDL, HDL, and FBS were assessed via enzymatic colorimetric kits (Pars Azmoon, Tehran, Iran). Serum insulin was determined via radioimmunoassay (DRG Pharmaceuticals, Germany), and high‐sensitivity C‐reactive protein (hs‐CRP) was quantified using an immunoturbidimetric assay. Aspartate aminotransferase (AST) and alanine aminotransferase (ALT) levels were measured following IFCC protocols. Insulin resistance was estimated using the HOMA‐IR formula: [Fasting plasma glucose (mmol/L) × Fasting plasma insulin (mIU/L)]/22.5 (Heshmati et al. 2020). Blood pressure and pulse were measured twice by a trained physician using a standardized sphygmomanometer (Omron, Germany) after a 15‐min rest. Hypertension was defined as systolic blood pressure ≥ 130 mmHg or diastolic blood pressure ≥ 85 mmHg (Bergler‐Klein 2019). Demographic data, including age, marital status, occupation, and educational level, were collected via structured interviews.
HTGW Phenotype
2.5
Participants were grouped based on waist circumference and triglyceride levels. Those with WC < 88 cm and TG < 150 mg/dL were classified as having a normal waist, normal triglyceride (NWNT). In contrast, those with WC ≥ 88 cm and TG ≥ 150 mg/dL were identified as having the HTGW phenotype (Amini et al. 2011).
Statistical Analysis
2.6
The Kolmogorov–Smirnov test assessed the normality of continuous variables. Between‐group differences were analyzed with independent t‐tests for numerical data and Chi‐square tests for categorical data. Adjusted comparisons of dietary intake were performed using ANCOVA, controlling for total caloric intake. Logistic regression analysis was employed to estimate the odds of having the HTGW phenotype in relation to food insecurity, controlling for age, BMI, energy intake, and physical activity. Analyses were performed in SPSS version 25, with p < 0.05 considered significant.
Results
3
Study Population Characteristics
3.1
This cross‐sectional study enrolled 250 women with overweight or obesity, with an average age of 36.67 ± 9.19 years. Participants had a mean body weight of 80.28 ± 11.05 kg and a body mass index (BMI) of 30.98 ± 3.90 kg/m^2^, with an average waist‐to‐hip ratio of 1.16 ± 4.54. Most participants (70.8%) were married, 46.8% held a bachelor's degree or higher, 39.9% reported favorable economic conditions, and 27.2% were employed. Based on phenotype classification, 91 women (36.4%) were identified with the HTGW phenotype, and 28.2% experienced food insecurity.
HTGW Phenotype and Participant Profile
3.2
As detailed in Table 1, unadjusted analyses revealed that the HTGW group had notably elevated levels for multiple parameters relative to the reference group, including body weight, BMI, waist circumference (WC), basal metabolic rate (BMR), fat‐free mass (FFM), skeletal muscle mass (SMM), soft lean mass (SLM), fasting blood sugar (FBS), insulin, HOMA‐IR, triglycerides (TG), total cholesterol (TC), low‐density lipoprotein (LDL), systolic blood pressure (SBP), alanine aminotransferase (ALT), and high‐sensitivity C‐reactive protein (hs‐CRP) (all p < 0.05). Conversely, the reference group was characterized by a significantly elevated average level of HDL (p = 0.02).
With adjustments for age, BMI, total energy intake, and physical activity, most differences remained significant. Specifically, the HTGW group continued to show elevated levels of body weight, BMR, WC, FFM, SMM, SLM, FBS, insulin, HOMA‐IR, TC, TG, LDL, diastolic blood pressure (DBP), and hs‐CRP (all p ≤ 0.05). Additionally, body fat mass (BFM; p = 0.004) and aspartate aminotransferase (AST; p = 0.001) were notably higher in the HTGW group post‐adjustment, while HDL cholesterol persisted at greater levels among the reference group (p = 0.009).
Dietary Intake Among the HTGW Phenotype
3.3
Comparisons of dietary intake, shown in Table 2, indicated significant differences in the consumption of specific nutrients. The HTGW group reported significantly higher intakes of iron (p = 0.04) and folate (p = 0.03), whereas the reference group had significantly higher vitamin E intake (p = 0.01). No meaningful differences were found for total energy intake or other macro‐ and micronutrients (p > 0.05).
Food Insecurity and the Odds of the HTGW Phenotype
3.4
As presented in Table 3, experiencing food insecurity was strongly associated with higher odds of exhibiting the HTGW phenotype. In the unadjusted model, women with food insecurity demonstrated over twice the odds of presenting with the HTGW phenotype compared to their food‐secure counterparts (OR: 2.24; 95% CI: 1.19–4.20; p = 0.01). This association persisted after adjusting for age, BMI, total energy intake, and physical activity, with food‐insecure women exhibiting significantly higher odds of the HTGW phenotype (OR: 2.13; 95% CI: 1.06–4.28; p = 0.03).
Discussion
4
This cross‐sectional investigation explored whether household food insecurity is linked to the hypertriglyceridemic waist (HTGW) phenotype among Iranian women with overweight or obesity. Women reporting food insecurity were over twice as likely to present with HTGW relative to women in food‐secure households. Previous research has not explicitly focused on this link within overweight and obese Iranian women, making the present study novel in this regard.
Multiple studies have reported a persistent link between food insecurity and detrimental health effects, including impaired weight regulation and elevated risks of diabetes, hypertension, dyslipidemia, coronary heart disease, stroke, and cardiovascular mortality (Li and Rosenthal 2021). The HTGW phenotype, meanwhile, serves as a practical clinical marker for a cluster of metabolic disturbances such as hyperinsulinemia, elevated apolipoprotein B (Apo B), and high LDL cholesterol frequently associated with insulin resistance (Esmaillzadeh and Azadbakht 2010). Prior evidence suggests that nearly one‐third of Iranian women (32%) present with this phenotype (Amini et al. 2011). Our findings correspond with studies showing that food insecurity is linked to central adiposity and lipid abnormalities. For instance, a cross‐sectional analysis reported that adolescents from food‐insecure households had significantly higher waist circumference (WC) z‐scores compared with their food‐secure peers (Poulsen et al. 2019). In another study, Myers et al. (2019) demonstrated that food‐insecure women exhibited higher BMI and WC, while no significant association was observed among men. This gender disparity may reflect women's greater propensity to consume energy‐dense foods in response to food insecurity–related stress (Li and Rosenthal 2021; Habhab et al. 2009). In addition, women may be more inclined to adopt unhealthy eating patterns when they perceive household food shortages (Li and Rosenthal 2021). Evidence from NHANES (2007–2014) further indicated that women with low food security were significantly more likely to have a WC ≥ 88 cm and TG ≥ 150 mg/dL (Park and Strauss 2020). Consistent findings were also reported by Maldonado et al. (2022), who showed that Hispanic/Latino children experiencing food insecurity had higher TG levels, while U.S. data revealed that food‐insecure women without hunger were more likely to exhibit abnormal TG concentrations (Tayie and Zizza 2009).
Nevertheless, the literature remains inconclusive. Several studies have reported no significant association between food insecurity and indicators of metabolic risk. A recent meta‐analysis reported no significant association between food insecurity and dyslipidemia in adults (Arenas et al. 2022). Similarly, Theodoridis et al. (2018) found no relationship between levels of food insecurity and WC among university students, and comparable inconsistencies were noted in Inuit populations (Huet et al. 2012). Likewise, Faramarzi et al. (2019) did not detect significant links between food insecurity, WC, and TG. In contrast, Shariff et al. (2014) suggested an inverse association, observing a lower prevalence of abdominal obesity or TG abnormalities in food‐insecure groups.
Several explanations may account for these heterogeneous findings. Variations in food insecurity measurement tools, study designs, participant characteristics, and physical activity levels are likely contributors (Jafari et al. 2017). Second, mental health plays a mediating role: food insecurity often coexists with psychological distress, which in turn can drive unhealthy dietary patterns (Bruening et al. 2016). Moreover, alterations in lipid profiles may require prolonged exposure to food insecurity, meaning short‐term studies could fail to capture these outcomes (Arenas et al. 2022).
Multiple mechanisms may underlie the observed relationship between food insecurity and HTGW (Figure 1). Periods of scarcity alternating with relative adequacy may lead to cycles of restriction and overeating (Shariff et al. 2014). Food insecurity often leads individuals to rely on low‐cost, energy‐dense foods, resulting in poorer diet quality and a greater risk of chronic diseases (Castro et al. 2022; Angeles‐Agdeppa et al. 2021). Additionally, adaptive physiological responses to scarcity, such as reductions in basal metabolic rate, may enhance energy storage efficiency (Faramarzi et al. 2019). Chronic stress induced by food insecurity can activate the hypothalamic–pituitary–adrenal axis, leading to increased cortisol secretion, which in turn enhances appetite for energy‐dense foods, promotes fat accumulation, and elevates metabolic risk (Crowder et al. 2021; Bateson and Pepper 2023; Jaschke and Wang 2023). Together, these pathways contribute to the development of obesity, dyslipidemia, and other metabolic disorders.
Conceptual model of mechanisms underlying the association between food insecurity and HTGW phenotype.
Although earlier studies have reported links between food insecurity and cardiometabolic risk factors (Zierath et al. 2023), including central adiposity and lipid abnormalities, in diverse populations (Poulsen et al. 2019), this investigation is the first to specifically examine the relationship between food insecurity and the HTGW phenotype among overweight and obese Iranian women. It is further strengthened by an adequate sample size and adjustment for several potential confounders. However, certain constraints of the study should be noted. The cross‐sectional design precludes causal inference. In addition, the relatively small sample size restricted our analysis to a simplified two‐group classification of the HTGW phenotype and its reference group. Consistent with this approach, He et al. (52) also categorized participants into only two groups, HTGW and non‐HTGW, when examining the risk of future diabetes, thereby supporting the validity of such dichotomous grouping. Dietary intake was assessed using an FFQ, which is subject to recall bias. Measurement errors cannot be entirely ruled out, and residual confounding remains a possibility despite adjustments. Moreover, the study was limited to overweight and obese women in Tehran, which restricts the external validity of the findings. Specifically, our participants had a BMI between 25 and 40 kg/m^2^, so the results may not be directly applicable to normal‐weight individuals.
In addition, because all participants were women, the observed association between food insecurity and the HTGW phenotype might not apply to men. Previous studies have also reported gender differences in the food insecurity–obesity paradox, with stronger associations often seen in women. Moreover, despite adjusting our ANCOVA models for major confounders, including age, BMI, total energy intake, and physical activity, we did not apply statistical corrections for multiple comparisons across the specific nutrient intakes presented in Table 2. Consequently, the precise p‐values observed for certain nutrients, such as iron (p = 0.04) and folate (p = 0.03), should be interpreted cautiously.
Finally, as participants were recruited from health centers in Tehran, the findings may not represent populations from other geographic regions or countries with different cultural or socioeconomic contexts. Future studies with more diverse and representative samples are warranted to confirm these results.
Conclusion
5
Our findings reveal a meaningful relationship between food insecurity and the HTGW phenotype among overweight and obese Iranian women. Food insecurity emerges as an important social factor contributing to metabolic disturbances, adding new evidence to the discussion on the food insecurity–obesity paradox within non‐Western populations. These results emphasize the importance of implementing context‐specific nutritional, behavioral, and policy measures to confront the combined challenges of food insecurity and cardiometabolic disorders. At the same time, the cross‐sectional design restricts causal interpretation. Future prospective and interventional research is needed to substantiate these observations, clarify underlying biological and behavioral pathways, and support the development of evidence‐based strategies to mitigate the metabolic consequences of food insecurity in diverse settings.
Author Contributions
P.J. and A.M. conceived and coordinated the project. P.J., A.D., N.V., and M.G. contributed to writing and experimental procedures. F.A. carried out statistical analyses. C.C.T.C. handled editing and revision of the manuscript. K.M. and A.M. supervised the study and reviewed and approved the final manuscript. All authors reviewed, revised, and approved the final manuscript.
Funding
This work was supported by Tehran University of Medical Sciences and Health Services, 1402‐1‐125‐64675.
Ethics Statement
Ethical approval was granted by the Ethics Committee of Tehran University of Medical Sciences (IR.TUMS.MEDICINE.REC.1402.172). We confirm that all procedures conducted in this study were carried out in accordance with applicable guidelines and regulations.
Consent
All participants provided written informed consent before enrollment.
Conflicts of Interest
The authors declare no conflicts of interest.
The reference list from the paper itself. Each links out to its DOI / PubMed record.
- 1Abbade, E. B. , and H. J. F. S. Dewes . 2015. “Food Insecurity Worldwide Is Derived From Food Supply Patterns.” 7, no. 1: 109–120.
- 2Amini, M. , A. Esmaillzadeh , M. Sadeghi , N. Mehvarifar , M. Amini , and M. Zare . 2011. “The Association of Hypertriglyceridemic Waist Phenotype With Type 2 Diabetes Mellitus Among Individuals With a First‐Degree Relative History of Diabetes.” Journal of Research in Medical Sciences: The Official Journal of Isfahan University of Medical Sciences 16, no. 2: 156.22091225 PMC 3214297 · pubmed ↗
- 3Angeles‐Agdeppa, I. , M. B. Toledo , and J. A. T. Zamora . 2021. “Moderate and Severe Level of Food Insecurity Is Associated With High Calorie‐Dense Food Consumption of Filipino Households.” Journal of Nutrition and Metabolism 2021, no. 1: 5513409.34777860 10.1155/2021/5513409 PMC 8580648 · doi ↗ · pubmed ↗
- 4Arenas, D. J. , S. Beltrán , M. Pharel , I. López‐Hinojosa , G. Vilá‐Arroyo , and H. M. De Lisser . 2022. “A Systematic Review and Meta‐Analysis of Food Insecurity and Dyslipidemia.” Journal of the American Board of Family Medicine 35, no. 4: 656–667.35896471 10.3122/jabfm.2022.04.210413 · doi ↗ · pubmed ↗
- 5Barrett, C. B. J. S. 2010. “Measuring Food Insecurity.” Science 327, no. 5967: 825–828.20150491 10.1126/science.1182768 · doi ↗ · pubmed ↗
- 6Bateson, M. , and G. V. Pepper . 2023. “Food Insecurity as a Cause of Adiposity: Evolutionary and Mechanistic Hypotheses.” Philosophical Transactions of the Royal Society, B: Biological Sciences 378, no. 1888: 20220228.10.1098/rstb.2022.0228 PMC 1047587637661744 · doi ↗ · pubmed ↗
- 7Behzadifar, M. , M. Behzadifar , S. Abdi , et al. 2016. “Prevalence of Food Insecurity in Iran: A Systematic Review and Meta‐Analysis.” Archives of Iranian Medicine 19: 288–294.27041526 · pubmed ↗
- 8Bergler‐Klein, J. J. W. K. W. 2019. “What's New in the ESC 2018 Guidelines for Arterial Hypertension: The Ten Most Important Messages.” Wiener Klinische Wochenschrift 131, no. 7–8: 180–185.30715608 10.1007/s 00508-018-1435-8PMC 6459798 · doi ↗ · pubmed ↗