Evaluating safety and quality of robotic-assisted gastric cancer surgery: meta-analysis and meta-regression
Riadh Salem, Wing K Chou, Lorenzo Giorgi, Sivesh K Kamarajah, Sheraz R Markar

TL;DR
A review of 90 studies suggests robotic-assisted gastric cancer surgery may be safer and more effective than traditional methods, but evidence is weak and more high-quality research is needed.
Contribution
This study provides a comprehensive meta-analysis and meta-regression of robotic-assisted gastrectomy safety and quality compared to conventional methods.
Findings
Robotic-assisted gastrectomy was associated with lower odds of Clavien–Dindo grade ≥ II complications.
Meta-regression identified industry funding as a significant source of heterogeneity in study outcomes.
Evidence certainty for both safety and quality outcomes was rated as very low due to poor study quality and bias.
Abstract
Robotic-assisted surgery is expanding globally. The UK’s National Institute for Health and Care Excellence recently cautioned due to a paucity of high-quality evidence. To address this, a systematic review, meta-analysis, and meta-regression were undertaken to evaluate the quality and safety of robotic-assisted gastrectomy (RAG) versus conventional approaches for gastric cancer. Systematic searches were conducted on MEDLINE, Embase, Web of Science, and Scopus (2 May 2025) for studies comparing RAG to open or laparoscopic gastrectomy up to 30 April 2025. Primary outcomes were Clavien–Dindo grade ≥ II complications (CD ≥ II; safety) and margin-positive resections (quality). Risk of bias was assessed using the Risk Of Bias In Non-randomized Studies of Interventions and Cochrane Risk of Bias v2.0 tools. Heterogeneity and evidence certainty were evaluated using meta-regression and GRADE…
Genes, proteins, chemicals, diseases, species, mutations and cell lines named across the full text — each resolved to its canonical identifier and authoritative record.
Click any figure to enlarge with its caption.
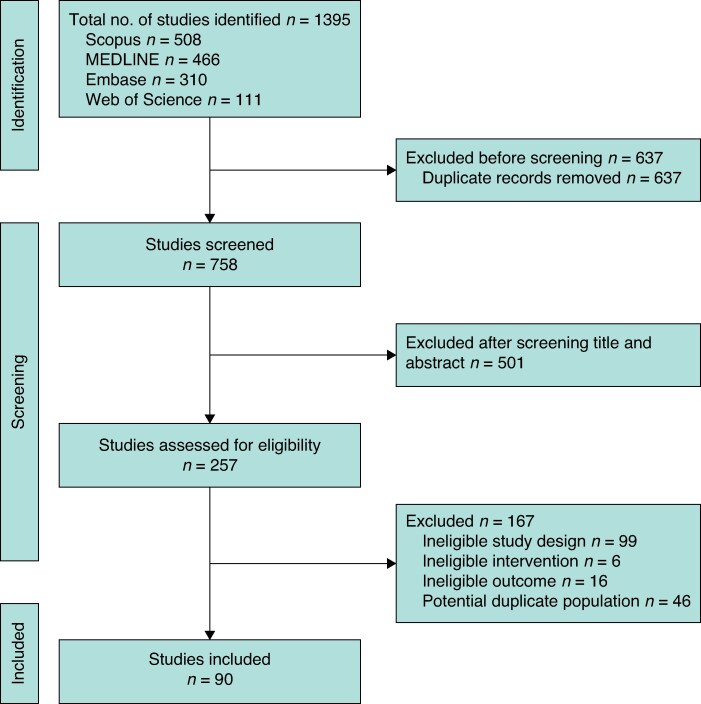 Fig. 1
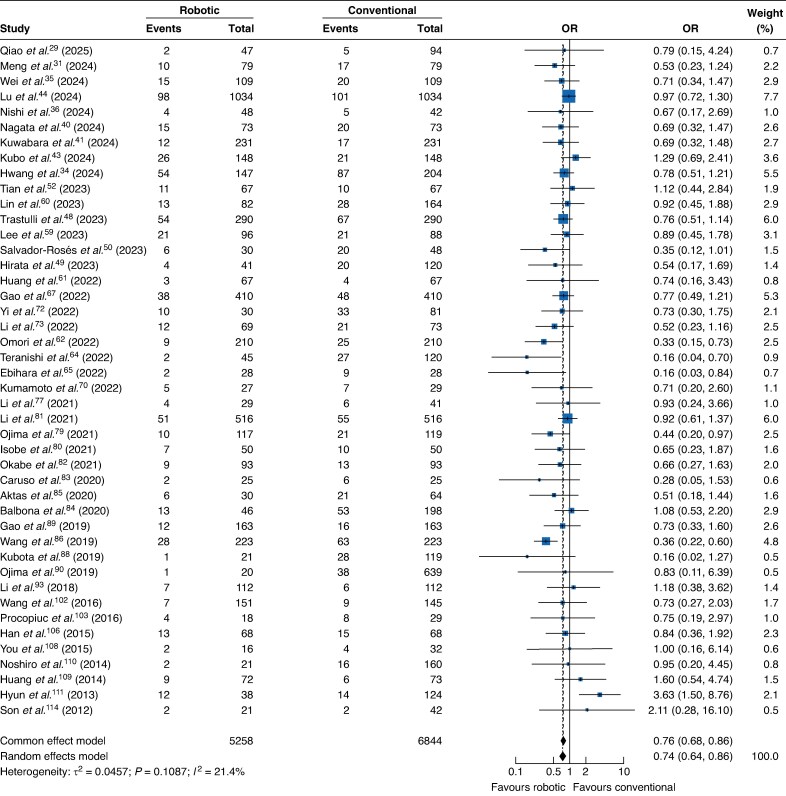 Fig. 2
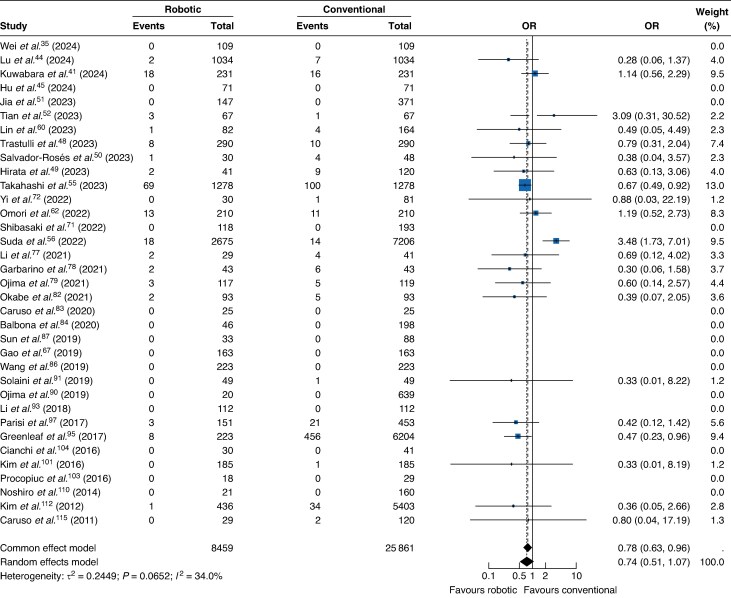 Fig. 3
| Study | Country | Study period | Design | Industry support | Study groups | No. of patients |
|---|---|---|---|---|---|---|
| Qiao | China | January 2015–April 2021 | Retrospective study | No | RAG | 47 |
| LG | 94 | |||||
| Zhang | China | January 2016–January 2018 | Retrospective study | No | RAG | 104 |
| LG | 104 | |||||
| Meng | China | October 2014–September 2022 | Retrospective study | No | RAG | 79 |
| LG | 79 | |||||
| Nishibeppu | Japan | November 2018–March 2023 | Retrospective study | No | RAG | 38 |
| LG | 71 | |||||
| Hondo | Japan | April 2018–October 2022 | Retrospective study | No | RAG | 988 |
| LG | 3173 | |||||
| Hwang | Korea | March 2007–December 2020 | Retrospective study | Yes | RAG | 147 |
| LG | 204 | |||||
| Wei | China | August 2016–December 2019 | Retrospective study | No | RAG | 109 |
| LG | 109 | |||||
| Nishi | Japan | 2007–2023 | Retrospective study | No | RAG | 48 |
| LG | 42 | |||||
| Wang | China | NR | Retrospective study | No | RAG | 66 |
| LG | 76 | |||||
| Zheng | China | January 2016–June 2021 | Retrospective study | No | RAG | 121 |
| LG | 363 | |||||
| Zheng | China | January 2018–June 2023 | Retrospective study | No | RAG | 97 |
| LG | 97 | |||||
| Nagata | Japan | January 2014–December 2022 | Retrospective study | No | RAG | 73 |
| LG | 73 | |||||
| Kuwabara | Japan | December 2013–June 2023 | Retrospective study | No | RAG | 231 |
| LG | 231 | |||||
| Kitazono | Japan | 2016–2020 | Retrospective study | No | RAG | 32 |
| LG | 32 | |||||
| Kubo | Japan | January 2015–July 2022 | Retrospective study | No | RAG | 148 |
| LG | 148 | |||||
| Lu | China | January 2015–June 2019 | Retrospective study | No | RAG | 1034 |
| LG | 1034 | |||||
| Hu | Japan | July 2009–June 2023 | Retrospective study | No | RAG | 71 |
| LG | 71 | |||||
| Dias | Brazil | 2009–2022 | Retrospective study | No | RAG | 48 |
| LG | 48 | |||||
| Song | China | January 2019–October 2021 | Retrospective study | No | RAG | 135 |
| LG | 155 | |||||
| Trastulli | International | January 2005–December 2017 | Retrospective study | No | RAG | 290 |
| OG | 290 | |||||
| Hirata | USA | January 2018–December 2021 | Retrospective study | Yes | RAG | 41 |
| OG | 120 | |||||
| Salvador-Rosés | Spain | 2014–2021 | Retrospective study | No | RAG | 30 |
| OG | 48 | |||||
| Jia | China | October 2014–October 2021 | Retrospective study | No | RAG | 147 |
| LG | 371 | |||||
| Tian | China | February 2020–March 2021 | Retrospective study | No | RAG | 67 |
| LG | 67 | |||||
| Tian | China | January 2019–December 2020 | Retrospective study | No | RAG | 73 |
| LG | 73 | |||||
| Shen | China | April 2020–October 2021 | Retrospective study | No | RAG | 67 |
| LG | 46 | |||||
| Takahashi | USA | 2010–2017 | Retrospective study | No | RAG | 1278 |
| LG | 1278 | |||||
| Suda | Japan | October 2014–January 2017 | Retrospective study | Yes | RAG | 326 |
| LG | 757 | |||||
| Li | China | March 2010–October 2019 | Retrospective study | No | RAG | 1776 |
| LG | 1776 | |||||
| Miyai | Japan | April 2015–December 2022 | Retrospective study | No | RAG | 90 |
| LG | 90 | |||||
| Lee | Korea | May 2021–May 2022 | Prospective study | No | RAG | 96 |
| LG | 88 | |||||
| Lin | China | January 2005–September 2016 | Retrospective study | No | RAG | 82 |
| LG | 164 | |||||
| Huang | China | 2016–2019 | Retrospective study | No | RAG | 67 |
| LG | 67 | |||||
| Omori | Japan | January 2014–December 2019 | Retrospective study | No | RAG | 210 |
| LG | 210 | |||||
| Kostov | Bulgaria | January 2018–August 2022 | Retrospective study | No | RAG | 38 |
| LG | 72 | |||||
| Teranishi | Japan | 2017–2020 | Retrospective study | No | RAG | 45 |
| LG | 120 | |||||
| Ebihara | Japan | July 2014–August 2020 | Retrospective study | No | RAG | 28 |
| LG | 28 | |||||
| Hikage | Japan | January 2012–December 2020 | Retrospective study | No | RAG | 394 |
| LG | 882 | |||||
| Gao | China | January 2015–October 2021 | Retrospective study | No | RAG | 410 |
| LG | 410 | |||||
| Li | China | July 2018–February 2022 | Retrospective study | No | RAG | 16 |
| LG | 110 | |||||
| Li | China | July 2016–July 2018 | Retrospective study | No | RAG | 221 |
| LG | 663 | |||||
| Kumamoto | Japan | June 2017–July 2021 | Retrospective study | No | RAG | 27 |
| LG | 29 | |||||
| Shibasaki | Japan | January 2009–June 2021 | Retrospective study | No | RAG | 118 |
| LG | 193 | |||||
| Yi | China | September 2016–December 2018 | Prospective study | No | RAG | 30 |
| LG | 81 | |||||
| Li | China | March 2018–July 2021 | Prospective study | No | RAG | 69 |
| LG | 73 | |||||
| Suda | Japan | October 2018–December 2019 | Retrospective study | Yes | RAG | 2671 |
| LG | 7671 | |||||
| Kaida | Japan | January 2011–December 2020 | Retrospective study | No | RAG | 34 |
| LG | 34 | |||||
| Choi | Korea | March 2009–June 2018 | Retrospective study | Yes | RAG | 54 |
| LG | 62 | |||||
| OG | 69 | |||||
| Li | China | May 2006–October 2019 | Retrospective study | No | RAG | 29 |
| LG | 41 | |||||
| Garbarino | Italy | September 2012–March 2017 | Retrospective study | No | RAG | 43 |
| OG | 43 | |||||
| Ojima | Japan | April 2018–October 2020 | RCT | No | RAG | 117 |
| LG | 119 | |||||
| Isobe | Japan | February 2018–August 2020 | Retrospective study | No | RAG | 50 |
| LG | 50 | |||||
| Li | China | March 2010–August 2019 | Retrospective study | No | RAG | 516 |
| LG | 516 | |||||
| Okabe | Japan | January 2012–March 2020 | Retrospective study | No | RAG | 93 |
| LG | 93 | |||||
| Caruso | Spain | November 2016–February 2019 | Prospective study | No | RAG | 25 |
| OG | 25 | |||||
| Balbona | USA | January 2000–May 2018 | Retrospective study | No | RAG | 46 |
| OG | 198 | |||||
| Aktas | Turkey | December 2013–March 2018 | Retrospective study | No | RAG | 30 |
| LG | 64 | |||||
| Wang | China | January 2016–May 2018 | Retrospective study | No | RAG | 223 |
| LG | 223 | |||||
| Sun | China | January 2016–April 2018 | Retrospective study | Yes | RAG | 33 |
| LG | 88 | |||||
| Kubota | Japan | February 2015–February 2019 | Retrospective study | No | RAG | 21 |
| LG | 119 | |||||
| Gao | China | January 2011–December 2014 | Retrospective study | No | RAG | 163 |
| LG | 163 | |||||
| Ojima | Japan | January 2013–December 2017 | Retrospective study | No | RAG | 20 |
| LG | 639 | |||||
| Solaini | Italy | June 2008–January 2018 | Retrospective study | No | RAG | 49 |
| OG | 49 | |||||
| Wang | China | April 2012–July 2017 | Retrospective study | No | RAG | 35 |
| LG | 140 | |||||
| Li | China | August 2013–March 2017 | Retrospective study | No | RAG | 112 |
| LG | 112 | |||||
| Lu | China | July 2016–June 2017 | Retrospective study | No | RAG | 101 |
| LG | 303 | |||||
| Greenleaf | USA | January 2010–December 2012 | Retrospective study | No | RAG | 223 |
| LG | 1487 | |||||
| OG | 4717 | |||||
| Pan | China | January 2015–August 2016 | RCT | No | RAG | 102 |
| LG | 61 | |||||
| Parisi | International | Retrospective study | No | RAG | 151 | |
| LG | 151 | |||||
| OG | 302 | |||||
| Hong | Korea | October 2008–December 2015 | Retrospective study | No | RAG | 232 |
| LG | 232 | |||||
| Kim | Korea | February 2009–September 2011 | Retrospective study | No | RAG | 87 |
| LG | 288 | |||||
| Park | Korea | May 2011–December 2012 | Prospective study | No | RAG | 223 |
| LG | 211 | |||||
| Kim | Korea | May 2011–December 2012 | Prospective study | No | RAG | 185 |
| LG | 185 | |||||
| Wang | China | May 2012–December 2014 | RCT | No | RAG | 151 |
| OG | 145 | |||||
| Procopiuc | Romania | January 2004–December 2013 | Retrospective study | No | RAG | 18 |
| OG | 29 | |||||
| Cianchi | Italy | June 2008–September 2015 | Retrospective study | No | RAG | 30 |
| LG | 41 | |||||
| Glenn | USA | January 2008–December 2013 | Retrospective study | No | RAG | 223 |
| LG | 789 | |||||
| OG | 8585 | |||||
| Han | Korea | June 2008–December 2013 | Retrospective study | No | RAG | 68 |
| LG | 68 | |||||
| Seo | Korea | June 2004–March 2009 | Retrospective study | No | RAG | 40 |
| LG | 40 | |||||
| You | Korea | January 2014–February 2015 | Retrospective study | No | RAG | 16 |
| LG | 20 | |||||
| OG | 12 | |||||
| Huang | Taiwan | July 2008–August 2014 | Prospective study | No | RAG | 72 |
| LG | 73 | |||||
| Noshiro | Japan | April 2010–November 2012 | Prospective study | No | RAG | 21 |
| LG | 160 | |||||
| Hyun | Korea | February 2009–November 2010 | Retrospective study | No | RAG | 38 |
| LG | 83 | |||||
| OG | 41 | |||||
| Kim | Korea | January 2005–December 2010 | Retrospective study | No | RAG | 436 |
| LG | 861 | |||||
| OG | 4542 | |||||
| Huang | Taiwan | January 2006–02–2012 | Retrospective study | No | RAG | 39 |
| LG | 64 | |||||
| OG | 586 | |||||
| Son | Korea | December 2007–December 2011 | Retrospective study | No | RAG | 21 |
| LG | 42 | |||||
| Caruso | Italy | January 2005–June 2010 | Retrospective study | No | RAG | 29 |
| OG | 120 | |||||
| Kim | Korea | December 2007–June 2008 | Retrospective study | No | RAG | 16 |
| LG | 11 | |||||
| OG | 12 | |||||
| Pugliese | Italy | June 2000–October 2009 | Retrospective study | No | RAG | 18 |
| LG | 52 | |||||
| Song | Korea | May 2003–November 2006 | Retrospective study | No | RAG | 20 |
| LG | 40 |
| Study | Groups | No. of patients | Age (years) | Sex | Gastrectomy | Cancer stages | Stage 3 | BMI (kg/m2) | ||
|---|---|---|---|---|---|---|---|---|---|---|
| Male | Female | Total | Subtotal | |||||||
| Qiao | RAG | 47 | 40 | 24 (51%) | 23 (49%) | NR | NR | Early and advanced | 44 (31%) | 22.2 |
| LG | 94 | 40 | 60 (64%) | 34 (36%) | 22.8 | |||||
| Zhang | RAG | 104 | 56.9 | 63 (61%) | 41 (39%) | 13 (6%) | 195 (94%) | Early and advanced | 31 (15%) | 21.7 |
| LG | 104 | 57.3 | 59 (57%) | 45 (43%) | 21.6 | |||||
| Meng | RAG | 79 | 63.6 | 64 (81%) | 15 (19%) | 119 (75%) | 39 (25%) | Early and advanced | 40 (25%) | 31.6 |
| LG | 79 | 63.6 | 55 (70%) | 24 (30%) | 31.4 | |||||
| Nishibeppu | RAG | 38 | NR | NR | NR | 9 (8%) | 100 (92%) | Early and advanced | 8 (7%) | NR |
| LG | 71 | |||||||||
| Hondo | RAG | 988 | NR | 632 (64%) | 356 (36%) | NR | NR | Early and advanced | NR | NR |
| LG | 3173 | 2023 (64%) | 1150 (36%) | |||||||
| Hwang | RAG | 147 | 53.1 | 78 (53%) | 69 (47%) | 351 (100%) | Advanced | 133 (38%) | 23 | |
| LG | 204 | 59.3 | 136 (67%) | 68 (33%) | 23.5 | |||||
| Wei | RAG | 109 | 63 | 83 (76%) | 26 (24%) | 110 (50%) | 108 (50%) | Early and advanced | 73 (33%) | 26.75 |
| LG | 109 | 61 | 78 (72%) | 31 (28%) | 26.75 | |||||
| Nishi | RAG | 48 | 72 | 30 (83%) | 6 (17%) | NR | NR | Early and advanced | 39 (43%) | 22.9 |
| LG | 42 | 67.5 | 17 (53%) | 15 (47%) | 22.4 | |||||
| Wang | RAG | 66 | 58.6 | 48 (73%) | 18 (27%) | NR | NR | Early and advanced | 48 (34%) | NR |
| LG | 76 | 60 | 50 (66%) | 26 (34%) | ||||||
| Zheng | RAG | 121 | 69 | 98 (81%) | 23 (19%) | 292 (60%) | 192 (40%) | Advanced | 227 (47%) | 23.6 |
| LG | 363 | 69.7 | 270 (74%) | 93 (26%) | 23.4 | |||||
| Zheng Y | RAG | 97 | 57.9 | 66 (68%) | 31 (32%) | 99 (44%) | 128 (56%) | Early and advanced | 78 (40%) | 23 |
| LG | 97 | 58.6 | 67 (69%) | 30 (31%) | 23 | |||||
| Nagata | RAG | 73 | 68 | 48 (66%) | 25 (34%) | 146 (100%) | Early and advanced | 36 (25%) | 21.9 | |
| LG | 73 | 68 | 50 (68%) | 23 (32%) | 22.4 | |||||
| Kuwabara | RAG | 231 | 71 | 150 (65%) | 81 (35%) | 69 (15%) | 393 (85%) | Early and advanced | 91 (24%) | 22.8 |
| LG | 231 | 69 | 145 (63%) | 86 (37%) | 22.7 | |||||
| Kitazono | RAG | 32 | 67.6 | 21 (66%) | 11 (34%) | 64 (100%) | Early and advanced | 5 (8%) | 23.7 | |
| LG | 32 | 69.1 | 23 (72%) | 9 (28%) | 23.4 | |||||
| Kubo | RAG | 148 | 67.7 | 96 (65%) | 52 (35%) | 32 (11%) | 261 (89%) | Early and advanced | 49 (16%) | 21 |
| LG | 148 | 66.8 | 94 (64%) | 54 (36%) | 20.9 | |||||
| Lu | RAG | 1034 | 59.9 | 731 (71%) | 303 (29%) | 644 (31%) | 1424 (69%) | Early and advanced | 791 (38%) | 22.2 |
| LG | 1034 | 59.8 | 742 (72%) | 292 (28%) | 22.3 | |||||
| Hu | RAG | 71 | 68 | 54 (76%) | 17 (24%) | 142 (100%) | Early and advanced | NR | 23.1 | |
| LG | 71 | 67 | 60 (85%) | 11 (15%) | 23.5 | |||||
| Dias | RAG | 48 | 58.3 | 25 (52%) | 23 (48%) | 27 (28%) | 69 (72%) | Early and advanced | 34 (35%) | 23.7 |
| LG | 48 | 53 | 26 (54%) | 22 (46%) | 23.9 | |||||
| Song | RAG | 135 | 63.8 | 83 (72%) | 32 (28%) | 290 (100%) | Early and advanced | 117 (4%) | 24.1 | |
| LG | 155 | 65.5 | 95 (61%) | 60 (39%) | 24 | |||||
| Trastulli | RAG | 290 | 68.7 | 165 (57%) | 125 (43%) | 216 (37%) | 364 (63%) | Early and advanced | 176 (3%) | 24.1 |
| OG | 290 | 68.1 | 172 (59%) | 118 (41%) | 24.2 | |||||
| Hirata | RAG | 41 | 60 | 24 (59%) | 17 (41%) | 83 (52%) | 78 (48%) | Early and advanced | 114 (71%) | 25 |
| OG | 120 | 64 | 82 (68%) | 38 (32%) | 26 | |||||
| Salvador-Rosés | RAG | 30 | 68 | 23 (77%) | 7 (23%) | 78 (100%) | Early and advanced | 52 (67%) | 26 | |
| OG | 48 | 64 | 40 (83%) | 8 (17%) | 27 | |||||
| Jia | RAG | 147 | 62.9 | 118 (80%) | 29 (20%) | NR | NR | Early and advanced | 220 (42%) | 24.9 |
| LG | 371 | 62.5 | 294 (79%) | 77 (21%) | 24.5 | |||||
| Tian | RAG | 67 | 59.2 | 45 (67%) | 22 (33%) | NR | NR | Advanced | 79 (59%) | 24.1 |
| LG | 67 | 57.4 | 47 (70%) | 20 (30%) | 25.4 | |||||
| Tian | RAG | 73 | 55.9 | 49 (67%) | 24 (33%) | NR | NR | Early and advanced | 30 (21%) | 23.8 |
| LG | 73 | 54.8 | 46 (63%) | 27 (37%) | 23.8 | |||||
| Shen | RAG | 67 | 65.7 | 43 (64%) | 24 (36%) | NR | NR | Early and advanced | 45 (40%) | 22.9 |
| LG | 46 | 64.2 | 25 (54%) | 21 (46%) | 22.1 | |||||
| Takahashi | RAG | 1278 | 65 | 914 (71%) | 364 (29%) | 236 (18%) | 1082 (82%) | Early and advanced | 650 (25%) | NR |
| LG | 1278 | 65 | 899 (70%) | 379 (30%) | ||||||
| Suda | RAG | 326 | 66 | 201 (62%) | 125 (38%) | 231 (21%) | 852 (79%) | Early | NR | 22.4 |
| LG | 757 | 68 | 506 (67%) | 251 (33%) | 22.3 | |||||
| Li | RAG | 1776 | 57.6 | 1276 (72%) | 500 (28%) | 994 (28%) | 2558 (72%) | Early and advanced | 1894 (53%) | 22.5 |
| LG | 1776 | 57.8 | 1279 (72%) | 497 (28%) | 22.4 | |||||
| Miyai | RAG | 90 | 70.2 | 62 (69%) | 28 (31%) | 56 (31%) | 124 (69%) | Early and advanced | 63 (35%) | 22.5 |
| LG | 90 | 70.1 | 65 (72%) | 25 (28%) | 22.6 | |||||
| Lee | RAG | 96 | 61.8 | 57 (59%) | 39 (41%) | 31 (17%) | 153 (83%) | Early and advanced | 36 (20%) | 24 |
| LG | 88 | 64.3 | 53 (60%) | 35 (40%) | 23.9 | |||||
| Lin | RAG | 82 | 61.6 | 69 (84%) | 13 (16%) | NR | NR | Early and advanced | 160 (65%) | 22.7 |
| LG | 164 | 61.6 | 138 (84%) | 26 (16%) | 22.6 | |||||
| Huang | RAG | 67 | 49.3 | 43 (64%) | 24 (36%) | NR | NR | Early and advanced | 41 (31%) | 22.5 |
| LG | 67 | 49.1 | 47 (70%) | 20 (30%) | 22.3 | |||||
| Omori | RAG | 210 | 66 | 152 (72%) | 58 (28%) | 80 (19%) | 340 (81%) | Early and advanced | 104 (25%) | 22.8 |
| LG | 210 | 65.5 | 153 (73%) | 57 (27%) | 22.7 | |||||
| Kostov | RAG | 38 | 63.1 | 24 (63%) | 14 (37%) | NR | NR | Early and advanced | 59 (54%) | 23.6 |
| LG | 72 | 62.1 | 33 (46%) | 39 (54%) | 23.9 | |||||
| Teranishi | RAG | 45 | 69 | 31 (69%) | 14 (31%) | NR | NR | Early and advanced | NR | 22.5 |
| LG | 120 | 72 | 82 (68%) | 38 (32%) | 22.4 | |||||
| Ebihara | RAG | 28 | 72.5 | 17 (61%) | 11 (39%) | NR | NR | Early and advanced | 2 (4%) | 22.1 |
| LG | 28 | 71 | 17 (61%) | 11 (39%) | 22.2 | |||||
| Hikage | RAG | 394 | 68 | 251 (64%) | 143 (36%) | 96 (8%) | 1180 (92%) | Early | NR | 21.3 |
| LG | 882 | 70 | 620 (70%) | 262 (30%) | 21.1 | |||||
| Gao | RAG | 410 | 59.8 | 284 (69%) | 126 (31%) | 820 (100%) | Early and advanced | 483 (59%) | 23.1 | |
| LG | 410 | 59.7 | 301 (73%) | 109 (27%) | 23.1 | |||||
| Li | RAG | 16 | 54.4 | 10 (63%) | 6 (38%) | 52 (41%) | 74 (59%) | Early and advanced | 22 (17%) | 24.14 |
| LG | 110 | 56.9 | 77 (70%) | 33 (30%) | 23.1 | |||||
| Li | RAG | 221 | 58.4 | 165 (75%) | 56 (25%) | 482 (55%) | 402 (45%) | Early and advanced | 382 (43%) | 23 |
| LG | 663 | 58.7 | 509 (77%) | 154 (23%) | 22.9 | |||||
| Kumamoto | RAG | 27 | 69 | 19 (70%) | 8 (30%) | NR | NR | Early and advanced | 20 (36%) | 23.2 |
| LG | 29 | 70 | 19 (66%) | 10 (34%) | 22.4 | |||||
| Shibasaki | RAG | 118 | 69 | 69 (69%) | 31 (31%) | NR | NR | Early and advanced | NR | 23 |
| LG | 193 | 68 | 67 (67%) | 33 (33%) | 23.1 | |||||
| Yi | RAG | 30 | 57.8 | 18 (60%) | 12 (40%) | NR | NR | Early and advanced | 82 (74%) | 23.6 |
| LG | 81 | 58.3 | 48 (59%) | 33 (41%) | 23.9 | |||||
| Li | RAG | 69 | 59.36 | 48 (70%) | 21 (30%) | NR | NR | Early and advanced | 77 (54%) | 22.6 |
| LG | 73 | 58.9 | 52 (71%) | 21 (29%) | 22.8 | |||||
| Suda | RAG | 2671 | NR | 1760 (66%) | 911 (34%) | 776 (25%) | 4566 (85%) | NR | 1131 (11%) | NR |
| LG | 7671 | 1754 (66%) | 917 (34%) | |||||||
| Kaida | RAG | 34 | 69 | 19 (56%) | 15 (44%) | 19 (28%) | 49 (72%) | Early | NR | 23.1 |
| LG | 34 | 69 | 18 (53%) | 16 (47%) | 23.2 | |||||
| Choi | RAG | 54 | 59 | 40 (74%) | 14 (26%) | 33 (23%) | 109 (77%) | Early and advanced | 59 (32%) | 26.5 |
| LG | 62 | 63 | 45 (73%) | 17 (27%) | 26.6 | |||||
| OG | 69 | 66 | 47 (68%) | 22 (32%) | 26.5 | |||||
| Li | RAG | 29 | 60.3 | 22 (76%) | 7 (24%) | 70 (100%) | Early and advanced | 43 (61%) | 19.4 | |
| LG | 41 | 58.2 | 31 (76%) | 10 (24%) | 20.4 | |||||
| Garbarino | RAG | 43 | 77.7 | 23 (53%) | 20 (47%) | 21 (24%) | 65 (76%) | Early and advanced | 39 (45%) | 23.3 |
| OG | 43 | 78.5 | 22 (51%) | 21 (49%) | 23.8 | |||||
| Ojima | RAG | 117 | 71 | 73 (62%) | 44 (38%) | 58 (25%) | 172 (75%) | Early and advanced | 45 (19%) | 22.4 |
| LG | 119 | 72 | 77 (65%) | 42 (35%) | 21.9 | |||||
| Isobe | RAG | 50 | 69.2 | 31 (62%) | 19 (38%) | 100 (100%) | Early and advanced | 13 (13%) | 23 | |
| LG | 50 | 69.3 | 34 (68%) | 16 (32%) | 22.9 | |||||
| Li | RAG | 516 | 55.1 | 354 (69%) | 162 (31%) | 1032 (100%) | Early and advanced | 342 (33%) | NR | |
| LG | 516 | 54.6 | 333 (65%) | 183 (35%) | ||||||
| Okabe | RAG | 93 | 69 | 62 (67%) | 31 (33%) | 60 (32%) | 126 (68%) | Early and advanced | 78 (42%) | 23.6 |
| LG | 93 | 70 | 57 (61%) | 36 (39%) | 22.9 | |||||
| Caruso | RAG | 25 | 64 | NR | NR | 50 (100%) | Early and advanced | 19 (38%) | 21.8 | |
| OG | 25 | 68.7 | 22 | |||||||
| Balbona | RAG | 46 | 61.9 | 26 (57%) | 20 (43%) | 45 (40%) | 67 (60%) | Early and advanced | 55 (23%) | NR |
| OG | 198 | 65.5 | 65 (42%) | 91 (58%) | ||||||
| Aktas | RAG | 30 | 55 | 18 (60%) | 12 (40%) | 50 (43%) | 44 (47%) | Early and advanced | 51 (54%) | 26 |
| LG | 64 | 59 | 41 (64%) | 23 (36%) | 24 | |||||
| Wang | RAG | 223 | 57.7 | 183 (81%) | 43 (19%) | 193 (43%) | 253 (57%) | Early and advanced | 172 (39%) | 22.1 |
| LG | 223 | 57.4 | 180 (81%) | 43 (19%) | 22.2 | |||||
| Sun | RAG | 33 | 55.6 | 24 (73%) | 9 (27%) | NR | NR | Early and advanced | 22 (18%) | 22.38 |
| LG | 88 | 54.7 | 65 (74%) | 23 (26%) | 22.5 | |||||
| Kubota | RAG | 21 | 59.8 | 11 (52%) | 10 (48%) | NR | NR | Early and advanced | NR | 20.9 |
| LG | 119 | 67 | 72 (61%) | 47 (39%) | 22.3 | |||||
| Gao | RAG | 163 | 60.27 | 121 (74%) | 42 (26%) | 122 (37%) | 204 (63%) | Early and advanced | 206 (63%) | 23.7 |
| LG | 163 | 59.8 | 125 (77%) | 38 (23%) | 23.3 | |||||
| Ojima | RAG | 20 | 71 | 13 (65%) | 7 (35%) | NR | NR | Early and advanced | 89 (19%) | 21.5 |
| LG | 639 | 70 | 430 (67%) | 209 (33%) | 22 | |||||
| Solaini | RAG | 49 | NR | 29 (59%) | 20 (41%) | 98 (100%) | Early and advanced | 68 (69%) | 24.2 | |
| OG | 49 | 28 (57%) | 21 (43%) | 24.8 | ||||||
| Wang | RAG | 35 | 55.3 | 29 (83%) | 6 (17%) | 175 (100%) | Early and advanced | 91 (52%) | 23 | |
| LG | 140 | 55.1 | 123 (88%) | 17 (12%) | 23.1 | |||||
| Li | RAG | 112 | 55.6 | 78 (70%) | 34 (30%) | NR | NR | Early and advanced | 98 (44%) | 23.6 |
| LG | 112 | 56.1 | 79 (71%) | 33 (29%) | 23.6 | |||||
| Lu | RAG | 101 | NR | 73 (72%) | 28 (28%) | 170 (42%) | 234 (58%) | Early and advanced | 154 (38%) | NR |
| LG | 303 | 212 (70%) | 91 (30%) | |||||||
| Greenleaf | RAG | 223 | 63.7 | 157 (70%) | 66 (30%) | 2187 (35%) | 4048 (65%) | Early and advanced | 3351 (52%) | NR |
| LG | 1487 | 63.9 | 1038 (70%) | 449 (30%) | ||||||
| OG | 4717 | 63.7 | 3245 (69%) | 1472 (31%) | ||||||
| Pan | RAG | 102 | 65.13 | 65 (64%) | 37 (36%) | 98 (60%) | 65 (40%) | Early and advanced | 48 (29%) | 24.12 |
| LG | 61 | 65.6 | 45 (74%) | 16 (26%) | 23.9 | |||||
| Parisi | RAG | 151 | 68.81 | 81 (54%) | 70 (46%) | 186 (31%) | 418 (69%) | Early and advanced | 152 (25%) | 24.58 |
| LG | 151 | 65.8 | 85 (56%) | 66 (44%) | 24 | |||||
| OG | 302 | 67.2 | 185 (61%) | 117 (39%) | 24.3 | |||||
| Hong | RAG | 232 | 53.7 | 154 (66%) | 78 (34%) | NR | NR | Early and advanced | 40 (9%) | 23.8 |
| LG | 232 | 55 | 156 (67%) | 76 (33%) | 23.8 | |||||
| Kim | RAG | 87 | 54.1 | 46 (53%) | 41 (47%) | NR | NR | Early and advanced | 3 (1%) | 21.1 |
| LG | 288 | 60.5 | 170 (59%) | 118 (41%) | 24 | |||||
| Park | RAG | 223 | 52.6 | 131(59%) | 92 (41%) | 72 (17%) | 362 (83%) | Early and advanced | NR | NR |
| LG | 211 | 55.8 | 126 (60%) | 85 (40%) | ||||||
| Kim | RAG | 185 | 53.3 | 113 (61%) | 72 (39%) | 60 (16%) | 310 (84%) | Early and advanced | 16 (4%) | 23.8 |
| LG | 185 | 56 | 113 (61%) | 72 (39%) | 23.6 | |||||
| Wang | RAG | 151 | 57.5 | 109 (72%) | 42 (28%) | NR | NR | Early and advanced | 143 (48%) | 22.1 |
| OG | 145 | 55.9 | 89 (61%) | 56 (39%) | 21.3 | |||||
| Procopiuc | RAG | 18 | 59.17 | 13 (72%) | 5 (28%) | 33 (70%) | 14 (30%) | Advanced | 23 (49%) | 26.5 |
| OG | 29 | 60.1 | 21 (72%) | 8 (28%) | 24.8 | |||||
| Cianchi | RAG | 30 | 73 | 14 (47%) | 16 (53%) | 71(100%) | Early and advanced | 20 (28%) | 27 | |
| LG | 41 | 74 | 19 (46%) | 22 (54%) | 26 | |||||
| Glenn | RAG | 223 | NR | 153 (69%) | 70 (31%) | NR | NR | NR | NR | NR |
| LG | 789 | 499 (63%) | 290 (37%) | |||||||
| OG | 8585 | 5899 (69%) | 2686 (31%) | |||||||
| Han | RAG | 68 | 50.6 | 31 (46%) | 37 (54%) | 136 (100%) | Early and advanced | 1 (1%) | 22.7 | |
| LG | 68 | 49.8 | 32 (47%) | 36 (53%) | 22.8 | |||||
| Seo | RAG | 40 | 51.6 | 19 (48%) | 21 (53%) | 80 (100%) | Early and advanced | 2 (3%) | 23.6 | |
| LG | 40 | 55.1 | 20 (50%) | 20 (50%) | 23.8 | |||||
| You | RAG | 16 | 57.7 | 10 (63%) | 6 (38%) | NR | NR | Early and advanced | 5 (1%) | 23 |
| LG | 20 | 67.1 | 14 (70%) | 6 (30%) | 22.8 | |||||
| OG | 12 | 61.8 | 8 (67%) | 4 (33%) | 25.4 | |||||
| Huang | RAG | 72 | 67.7 | 40 (56%) | 32 (44%) | 18 (12%) | 127 (88%) | Early and advanced | 12 (8%) | 24.1 |
| LG | 73 | 66 | 42 (58%) | 31 (42%) | 24.2 | |||||
| Noshiro | RAG | 21 | 66 | 14 (67%) | 7 (33%) | 181 (100%) | Early and advanced | NR | 22.8 | |
| LG | 160 | 69 | 102 (64%) | 58 (36%) | 21.8 | |||||
| Hyun | RAG | 38 | 54.2 | 25 (66%) | 13 (34%) | NR | NR | Early and advanced | 10 (6%) | 23.8 |
| LG | 83 | 60.3 | 55 (66%) | 28 (34%) | 23.8 | |||||
| OG | 41 | 57.7 | 28 (68%) | 13 (32%) | 22.7 | |||||
| Kim | RAG | 436 | 54.2 | 266 (61%) | 171(39%) | 1499 (26%) | 4339 (74%) | Early and advanced | 1388 (24%) | 23.6 |
| LG | 861 | 58.8 | 550 (64%) | 311(36%) | 23.5 | |||||
| OG | 4542 | 57.7 | 3008 (66%) | 1534 (34%) | 23.3 | |||||
| Huang | RAG | 39 | 65.1 | 19 (49%) | 20 (51%) | 193 (28%) | 496 (72%) | Early and advanced | 285 (41%) | 24.2 |
| LG | 64 | 65.6 | 43 (67%) | 21 (33%) | 24.7 | |||||
| OG | 586 | 67.9 | 406 (69%) | 180 (31%) | 23.7 | |||||
| Son | RAG | 21 | 52.3 | 14 (67%) | 7 (33%) | 3 (4%) | 69 (96%) | Early and advanced | 9 (14%) | 23.7 |
| LG | 42 | 52.8 | 26 (76%) | 8 (24%) | 22.6 | |||||
| Caruso | RAG | 29 | 64.8 | 18 (62%) | 11 (38%) | 49 (33%) | 100 (67%) | Early and advanced | 37 (25%) | 27 |
| OG | 120 | 65.1 | 65 (54%) | 55 (46%) | 28 | |||||
| Kim | RAG | 16 | 53.8 | 10 (63%) | 6 (38%) | 27 (100%) | Early and advanced | 3 (8%) | 21.3 | |
| LG | 11 | 57.9 | 10 (91%) | 1 (9%) | 25.3 | |||||
| OG | 12 | 56 | 9 (75%) | 3 (25%) | 25.2 | |||||
| Pugliese | RAG | 18 | NR | 7 (39%) | 11 (61%) | 70 (100%) | Early and advanced | NR | NR | |
| LG | 52 | 35 (67%) | 17 (33%) | |||||||
| Song | RAG | 20 | 51.6 | 8 (48%) | 12 (60%) | 60 (100%) | Early | NR | 23.4 | |
| LG | 40 | 55 | 27 (68%) | 13 (33%) | 23 | |||||
| Certainty assessment | No. of patients | Effect | Certainty | ||||||||
|---|---|---|---|---|---|---|---|---|---|---|---|
| No. of studies | Study design | Risk of bias | Inconsistency | Indirectness | Imprecision | Other considerations | Robotic gastrectomy | Conventional gastrectomy† | Relative | Absolute | |
|
| |||||||||||
| 44 | Non-randomized studies | Serious‡ | Not serious | Not serious | Not serious | All plausible residual confounding would reduce the demonstrated effect | 324 of 5258 (6.2%) | 587 of 6844 (8.6%) | OR 0.74 (0.64 to 0.86) | 21 fewer per 1000 (from 29 fewer to 11 fewer) | ⨁◯◯◯ |
|
| |||||||||||
| 35 | Non-randomized studies | Serious‡ | Not serious | Not serious | Serious§ | All plausible residual confounding would reduce the demonstrated effect | 156 of 8459 (18.5%) | 712 of 25 861 (2.8%) | OR 0.74 (0.51 to 1.07) | 7 fewer per 1000 (from 13 fewer to 2 more) | ⨁◯◯◯ |
- —Royal College of Surgeons of England10.13039/501100000297
- —National Institute for Health Research10.13039/501100000272
Peer Reviews
No public reviews on file for this paper yet. If you reviewed it on a platform where reviews are public (OpenReview, ICLR, NeurIPS, ICML), you can paste yours below so the community can read it here.
Videos
No videos yet. Explain this paper in a talk, walkthrough, or lecture? Add one.
Taxonomy
TopicsGastric Cancer Management and Outcomes · Minimally Invasive Surgical Techniques · Surgical Simulation and Training
Introduction
Globally, there has been rapid expansion of robotic platforms, driven largely by the surgical robotics industry^1^. Recent evidence suggests an almost eight-fold increase in the use of robotic platforms between 2012 and 2018^2^. Despite this growing adoption in large tertiary centres, health systems around the world struggle to adopt such practices owing to debates on the potential benefits and return on substantial investment^3–5^. Recently, the National Institute for Heath and Care Excellence (NICE) based in the UK undertook a health technology assessment of robotic surgery in soft tissue procedures, including colorectal, upper gastrointestinal, and urological cancer surgeries^6^. However, uncertainty remains around these areas, which require high-quality evidence to justify the widespread use of robotic surgery in the National Health Service (NHS). This evidence includes robust clinical and health economic evaluation, as well as surgical quality assurance with learning curve assessment^7^.
Among soft tissue procedures, surgery for gastric cancers is particularly challenging. With gastric cancers being the fifth most common cancer around the world and one of the leading causes of cancer-related death^8^, improving quality and safety of cancer surgery is crucial^9^. Globally, the standard of care for curative surgery is gastrectomy with D2 lymphadenectomy, most commonly through a traditional open approach^10^. In recent years, laparoscopic gastrectomy (LG) has gained popularity, following large randomized clinical trials (RCTs) demonstrating non-inferior oncological outcomes compared with open surgery^11–13^. However, the majority of evidence has been from East Asia, resulting in geographical difference in the adoption of LG. In East Asia, minimally invasive approaches accounted for over 70% of gastrectomies in Korea^14^, and similar rates in Japan, by 2019^15^. Meanwhile, LG adoption has been slower in Europe and North America. In Italy, rates of LG increased from 10.8% in 2015 to 26.3% in 2020^16^, and in the Netherland reached 80.6% by 2021^17^; however, in the UK and USA, adoption remains low^18,19^. Gastrectomy with D2 lymphadenectomy remains technically demanding, requiring meticulous dissection and advanced operative skill^20^.
In contrast, robotic-assisted surgery offers technical and ergonomic advantages, and has been postulated to be associated with better clinical outcomes^21^. However, current assessment of the benefits of robotic-assisted gastrectomy (RAG) compared to open or laparoscopic approaches have been limited, due to lack of robust evaluation from published systematic reviews and meta-analyses, including GRADE assessment of certainty^22^. Therefore, the aim of the present study was to evaluate the quality and safety of curative-intent RAG compared to conventional approaches for gastric cancers.
Methods
Search strategy and selection criteria
This systematic review and meta-analysis was conducted and reported in accordance with the PRISMA 2020 statement^23^ (Appendix S1). The study protocol was registered with PROSPERO (ID: CRD420251034915). An initial systematic search was performed on the MEDLINE (via PubMed), Embase (via Ovid), Web of Science, and Scopus databases from inception to 29 February 2025. The same search was repeated on 2 May 2025 to capture studies published in March and April 2025. No additional studies were included. No publication date restrictions were imposed beyond the final search date. The search strategies used combinations of controlled vocabulary (for example, MeSH) and keywords pertinent to the condition (gastric cancer), intervention (robotic gastrectomy), comparators (laparoscopic gastrectomy, open gastrectomy), and appropriate study designs. The comprehensive search strategy implemented for MEDLINE is detailed in Appendix S2. In addition, reference lists of identified studies and relevant systematic reviews were manually scrutinised to identify further eligible studies.
Inclusion and exclusion criteria
The inclusion criteria for this systematic review were comparative studies (that is, cohort studies or RCTs) including adult (age ≥ 18 years) patients undergoing primary total or subtotal gastrectomy for gastric adenocarcinoma. Eligible studies compared robotic gastrectomy (either totally robotic or robotic-assisted procedures using standardized licensed robotic platforms) with standard of care approaches such as LG or open gastrectomy (OG). The exclusion criteria were: non-comparative studies; inclusion of non-cancer surgery, such as gastrointestinal stromal tumours; and studies evaluating hybrid or hand-assisted surgical procedures.
Titles and abstracts identified through the search were screened by two independent reviewers (RS, WKC) against the predefined eligibility criteria. Full texts of potentially eligible studies were retrieved and assessed independently by the same two reviewers. Disagreements arising at any stage (screening, eligibility assessment, or data extraction) were resolved via discussion and consensus among the reviewers, with arbitration by senior authors (SKK, SRM) implemented when necessary.
Studies excluded after full-text review, along with the reasons for exclusion, are listed in Appendix S3.
Outcome measures
The co-primary outcomes were safety and quality. Safety was assessed based on postoperative complications, defined as the proportion of patients experiencing any complication classified as Clavien–Dindo grade II or higher (CD ≥ II)^24^. Quality was measured according to margin-positive resection (R1), defined according to criteria reported in the included studies. Odds ratios (OR) with their corresponding 95% confidence interval (c.i.) were calculated for these binary outcomes. Studies with zero events in both robotic and conventional arms were included in the forest plots for transparency, but were excluded from the pooled effect estimates.
Secondary outcomes included overall complications (CD ≥ I), major complication (CD ≥ III)^24^, and anastomotic leak. Anastomotic leaks were defined according to criteria reported in the included studies.
Data extraction
Data extraction was executed independently by two authors (RS, WKC) using a standardized data-extraction form in an Excel (Microsoft, Bellevue, WA, USA) spreadsheet (Appendix S4). Two different reviewers (LG, SKK) verified the extracted data for accuracy and completeness. Only summary-level data, as reported in the source publications, were extracted; individual patient data were not sought. To prevent data duplication from overlapping patient cohorts or study periods from the same institution, the most comprehensive or most recent publication presenting unique data was selected as the primary source. Extracted variables were on: study characteristics (that is, industry funding, study design, recruitment period, geographic region); sample size; patient demographics (that is, age, sex, body mass index); tumour characteristics (stage and grade); type of gastrectomy (total, subtotal); and outcome measures such as resection margin status (R0 versus R1), postoperative complications, and readmission. Where reported, details of industry funding or support were also extracted.
Risk of bias
The studies included in this assessment were evaluated for risk of bias using validated, design-specific instruments, namely the Risk Of Bias In Non-randomized Studies of Interventions (ROBINS-I) tool for non-randomized studies^25^ and the Cochrane Risk of Bias tool (RoB 2.0) for RCTs^26^. Two authors (RS, WKC) independently assessed the methodological quality of all the studies with the provided instruments. If consensus was not reached, consensus was reached through discussion with a third independent person (SKK or SRM).
Statistical analysis
Descriptive data were tabulated to summarize key study characteristics, including sample size, patient demographics, tumour stage distribution, intervention (robotic) and comparator (conventional gastrectomy) groups, outcome definitions, and methodological factors. Both primary and secondary outcomes were binary and analysed by calculating an OR with its 95% c.i. from reported event counts. Where necessary, log(OR) and corresponding standard errors were calculated from raw event data for statistical modelling. Continuous variables were summarized as the mean(standard deviation) or median with interquartile range, as appropriate); categorical variables were summarized as frequencies with percentages. All available studies reporting a given outcome were included in the relevant meta-analysis; missing covariate values were not imputed in meta-regression analyses. Random-effects meta-analyses were performed for each outcome using the restricted maximum likelihood (REML) estimator, which provides a robust approach to estimating between-study variance (τ^2^) when heterogeneity is anticipated. Study-level heterogeneity was quantified using the I^2^ statistic and τ^2^; I^2^ values of 25, 50, and 75% were interpreted as low, moderate, and high heterogeneity, respectively. Forest plots were generated to visualise study-specific and pooled effect sizes, 95% c.i., study weights, and heterogeneity indices.
Planned meta-regression analyses were conducted to explore potential sources of variation in effect estimates. Prespecified moderators included the proportion of patients with stage III cancer, industry support, the extent of surgical resection (proportion of total gastrectomies), and adoption year, which was defined as the calendar year in which patient recruitment commenced for each study. Studies initiating recruitment before 2015 were classified as early adopters (2015 corresponds to when Intuitive Surgical data demonstrated a sustained increase in global robotic-assisted surgical volume^2,27^). For stage III cancer, an additional exploratory analysis was performed stratifying studies by whether > 50 or ≤ 50% of patients had stage III disease. A subgroup analysis also compared studies from Eastern and Western centres to account for differences in patient populations, disease patterns, and technology adoption. Univariable models were constructed; only studies with complete moderator information were included. Publication bias and small-study effects were assessed for all outcomes using contour-enhanced funnel plots and Egger's regression test for asymmetry. All statistical analyses were conducted in R version 4.3.2 (R Foundation for Statistical Computing, Vienna, Austria) using the meta, metafor, dplyr, and ggplot2 packages.
Assessing certainty of evidence
The certainty of evidence for each outcome was assessed according to the GRADE approach; GRADEpro^28^ was used to facilitate this process. For each outcome, pooled effect estimates were rated as high, moderate, low, or very low certainty based on five criteria: risk of bias; inconsistency; indirectness; imprecision; and publication bias. Evidence from RCTs was initially classified as high certainty, whereas evidence from non-randomized studies began at low certainty. The certainty rating could be reduced if there were concerns regarding risk of bias, inconsistency, indirectness, imprecision, or small-study effects.
Results
Study characteristics
The search identified 1395 articles. After removing duplicates, the titles and abstracts were screened for 758 articles, with 501 articles excluded for not meeting eligibility criteria. This left 257 full-text articles that were assessed for eligibility, of which 167 were excluded. Thus, 90 studies meeting the inclusion criteria were included in the study (Fig. 1). Characteristics of the 90^29–118^ included studies are summarized in Table 1. The studies encompassed three RCTs and 87 non-randomized studies, with publication dates ranging from 2009 to 2025. The majority of studies originated from China, with 72 studies conducted in East Asia and 17 in Europe and America; 7% of the studies were industry supported.
Flow chart of the systematic review
Patient characteristics
In all, 65 296 patients were included across all studies, with 16 580 undergoing RAG, 28 783 undergoing LG, and 19 933 undergoing OG. The weighted mean proportion of patients undergoing total gastrectomy was 39%, whereas the pooled proportion of patients with pathological stage III disease was 32% across all studies. The characteristics of patients in the included studies are summarized in Table 2.
Safety of robotic-assisted surgery
The co-primary outcome for safety was postoperative complications, defined as CD ≥ II. Data were available from 44 studies (2 RCTs), encompassing 12 102 patients and 911 events. RAG was associated with significantly lower odds of complications compared with conventional approaches (OR 0.74; 95% c.i. 0.64 to 0.86; Fig. 2). Between-study heterogeneity was low (I^2^=21.4%; τ^2^=0.045; P = 0.10). Seven studies were assessed as low risk of bias. Meta-regression was performed to explore sources of heterogeneity using four study-level covariates. None was significantly associated with the effect estimates for CD ≥ II. A subgroup analysis by geographic region confirmed this consistency, showing a benefit for RAG in both Eastern (37 studies; OR 0.75; 95% c.i. 0.64 to 0.89) and Western (7 studies; OR 0.69; 95% c.i. 0.52 to 0.94) cohorts, with no significant subgroup difference (P = 0.65; Fig. S1). Funnel plot inspection did not reveal considerable asymmetry, and Egger’s linear regression test was non-significant (t = −1.42; d.f. = 42; P = 0.16), suggesting a low likelihood of small-study effects, including potential publication bias (Fig. S2). The certainty of evidence was rated as very low according to GRADE criteria (Table 3).
Forest plot showing a random-effects meta-analysis of safety, measured by Clavien–Dindo grade ≥ II complications, comparing robotic-assisted and conventional gastrectomyValues in parentheses are 95% confidence intervals. OR, odds ratio.
Quality of robotic-assisted surgery
Margin status was reported in 35 studies, comprising 34 320 patients and 868 events. RAG was associated with lower odds of R1 resection compared with conventional approaches (OR 0.74; 95% c.i. 0.51 to 1.07; Fig. 3), although the difference was not statistically significant. Between-study heterogeneity was moderate (I^2^ = 34.0%; τ^2^ = 0.24; P = 0.06). Three studies were assessed as low risk of bias. Meta-regression revealed that early adoption had a borderline correlation with effect size (P = 0.0635), accounting for 41.1% of heterogeneity. Subgroup analysis demonstrated lower rates of R1 resection for RAG performed before 2015 (P = 0.0017), but no change in later studies when compared to conventional approaches (P = 0.83; Fig. S3). Meta-regression also demonstrated that industry funding was strongly linked to more favourable effect estimates (P < 0.0001) and fully explained the observed heterogeneity. Subgroup analysis demonstrated a significant effect in non-industry-supported studies (P = 0.0005), but non-significant effects and marked heterogeneity among industry-supported studies (P = 0.51; Fig. S4). Robotic surgery was associated with lower rates of R1 resection in studies with ≥ 50% stage III patients (P = 0.05) and accounted for 49.4% of heterogeneity between studies (Fig. S5). A complementary subgroup analysis comparing studies with > 50 and ≤ 50% stage III patients supported this finding, with a clearer treatment effect observed in groups with a higher proportion of patients with stage III cancer (Fig. S6). Subgroup analysis by region revealed no significant subgroup difference (P = 0.18). In Eastern studies (12 studies), RAG was not associated with R1 rates (OR 0.94; 95% c.i. 0.54 to 1.64), whereas in Western studies (9 studies), RAG was associated with significantly lower R1 rates (OR 0.62; 95% c.i. 0.47 to 0.80; Fig. S7). Funnel plot inspection did not reveal considerable asymmetry, and Egger’s linear regression test was non-significant (t = −0.73; d.f. = 19; P = 0.47), suggesting a low likelihood of small-study effects, including potential publication bias (Fig. S8). The certainty of evidence was rated as very low according to GRADE criteria (Table 3).
Forest plot showing a random-effects meta-analysis of quality, measured by positive margin resection (R1), comparing robotic-assisted and conventional gastrectomyValues in parentheses are 95% confidence intervals. OR, odds ratio.
Secondary outcome measures
Data on major complications (CD ≥ III) were available from 58 studies, encompassing 36 952 patients and 1519 events. RAG was associated with significantly lower odds of major complications compared with conventional approaches (OR 0.74; 95% c.i. 0.60 to 0.90; Fig. S9). Heterogeneity was substantial (I^2^ = 65.1%; τ^2^ = 0.21; P < 0.0001). Meta-regression revealed that industry support was significantly associated with more favourable effect estimates in favour of RAG (P = 0.0013), accounting for 39.3% of the between-study heterogeneity (Fig. S10). Subgroup analysis confirmed a statistically significant benefit of RAG among non-industry-supported studies (P < 0.0001; I^2^ = 0%). In contrast, among industry-supported studies, effect estimates were not statistically significant (P = 0.46) and showed substantial heterogeneity (I^2^ = 84.6%).
Data on anastomotic leak were available from 69 studies, including 41 444 patients and 687 events. There was no significant difference in the odds of anastomotic leak between robotic and conventional gastrectomy (OR 1.06; 95% c.i. 0.90 to 1.25; Fig. S11). Heterogeneity across studies was low (I^2^ = 8.8%; τ^2^ = 0.0136; P = 0.27).
Data on overall complications were available from 44 studies, encompassing 33 245 patients. RG was associated with significantly lower odds of overall complications compared with conventional approaches (OR 0.83; 95% c.i. 0.73 to 0.94; Fig. S12). Heterogeneity was moderate (I^2^ = 30.6%; τ^2^ = 0.0422; P = 0.0319). This heterogeneity was not explained by a multivariable meta-regression because no included study-level covariates were significantly associated with the effect estimate.
Discussion
This systematic review and meta-analysis provides evidence around the safety and quality of RAG compared with conventional OG or LG. Evidence from 90 studies and over 65 000 patients demonstrates that robotic surgery is associated with lower postoperative complications and a trend towards fewer R1 resections. However, the direction of these estimates was influenced by studies with industry involvement or early adoption. Taken together, the certainty of evidence according to GRADE for quality and safety is very low. This emphasises an urgent need for better evaluation of current robotic-assisted platforms for gastrectomies and other surgeries, before the widespread scaling of these technologies across health systems.
This study represents the most comprehensive and methodologically rigorous synthesis of the available evidence to date. Although other systematic reviews and meta-analyses have previously assessed robotic surgery for gastric cancer^21–28,119–129^, the majority have been limited by methodological shortcomings, including inadequate handling of heterogeneity, lack of systematic risk-of-bias assessments, and the absence of GRADE evaluation. In contrast, this review used comprehensive analyses and meta-regression techniques to systematically explore heterogeneity, ensuring a greater reliability and robustness of the findings. Moreover, this is one of the first systematic reviews to explicitly address potential sources of bias associated with industry involvement, providing a more balanced interpretation of clinical outcomes compared with previous publications.
RAG has demonstrated several technical advantages, likely underpinning its improved outcomes compared with conventional approaches. The enhanced visualization provided by high-definition, three-dimensional imaging enables superior anatomical delineation and precise lymphadenectomy, potentially reducing surgical trauma^130^. The robotic platform’s increased dexterity, instrument stability, and tremor filtration also facilitate meticulous dissection and suturing, particularly in technically challenging areas such as the splenic hilum and perigastric vessels^131^. These technical refinements may explain observed reductions in postoperative complications and potentially improved margin status. Furthermore, ergonomically superior robotic platforms may minimize surgeon fatigue, indirectly contributing to consistently higher surgical quality^132^. Despite overall benefit, considerable heterogeneity was observed across the included studies. Meta-regression analyses identified key contributors to this variability. Notably, temporal trends had a significant effect: studies conducted in earlier periods tended to report more favourable outcomes for robotic gastrectomy, particularly regarding R1 resection rates. This pattern likely reflects more selective patient inclusion in the early adoption phase, rather than learning curve effects alone. Furthermore, R1 interpretation also depends heavily on the margin's specific location^133^, a detail unavailable in the aggregated data from the included studies. As robotic techniques became more widely adopted and indications broadened, the apparent benefits diminished, suggesting that changes in patient selection criteria over time played a major role in outcome heterogeneity.
A particularly salient finding of this review was the significant association between industry sponsorship and more favourable outcomes for RAG, which explained a substantial portion of heterogeneity for both R1 resection rates and major complications. However, the 7% of studies declaring direct industry support likely represents only the tip of the iceberg. Undeclared financial conflicts of interest are prevalent in the surgical literature^134,135^, and they extend beyond direct research funding to include consulting fees, speaker honoraria, and paid proctorship roles. In the context of robotic surgery, proctoring by experienced surgeons is a key component of training, yet these proctors are often paid independent contractors, with their services coordinated by the device manufacturer^136^. Such financial relationships are frequently not disclosed as a conflict of interest within subsequent research publications, yet they have been shown to correlate with the publication of pro-industry findings^137^. This unmeasured confounding from undeclared financial ties may have significantly biased the existing evidence base in favour of the robotic platform.
Implications for practice and policy
The findings of this review have important implications for health system leaders, surgical policymakers, and clinicians considering the adoption or scale-up of robotic platforms for gastric cancer surgery. The results indicate that robotic-assisted gastrectomy is associated with lower rates of postoperative complications and a trend towards improved oncological quality indicators, suggesting that, when performed in appropriate settings, robotic surgery can enhance the safety and technical quality of complex gastrointestinal cancer operations. These benefits, if realised consistently across health systems, have the potential to translate into downstream improvements in patient recovery, reductions in postoperative morbidity, shorter hospital stays, and lower rates of readmission, each of which carries implications for hospital efficiency and cost containment. However, these potential advantages must be carefully balanced against the substantial capital and maintenance costs associated with robotic systems^138,139^. In publicly funded health systems such as the UK NHS, where surgical innovation competes for limited resources, clear evidence of clinical and economic benefit is essential to justify investment. This review adds important clinical context to recent health technology assessments, such as those led by NICE, which have highlighted the need for robust evidence not only on comparative safety and effectiveness but also on cost-effectiveness and learning curve requirements. Centralization of complex oncological procedures to high-volume centres with demonstrated outcomes may also be warranted to optimize clinical benefit and resource utilization^140^. Equity in access must also be a central consideration. At present, robotic systems are more likely to be deployed in tertiary centres and affluent regions, raising the risk of widening disparities in access to high-quality surgical care^141,142^. Policymakers must consider mechanisms such as national procurement strategies, coordinated workforce training, and outcome-based funding models that promote equitable access while maintaining high standards of care^143^. Lastly, the integration of robotic surgery into cancer care pathways should be embedded within ongoing quality assurance frameworks and prospective registries. This would enable real-time monitoring of outcomes, benchmarking of institutional performance, and iterative learning across the system, aligning innovation with accountability and continuous improvement.
Implications for research
Future research should address the key evidence gaps that remain following this review. First, high-quality, multicentre RCTs directly comparing RAG and LG are needed, with rigorous surgical quality assurance, long-term oncological outcomes, and stratification by tumour stage and procedure type. Second, robust health economic evaluations across a range of health systems, particularly in low- and middle-income countries, are essential to determine the context-specific value and affordability of robotic platforms, incorporating capital, maintenance, and training costs alongside clinical benefits. Third, future studies should expand beyond traditional clinical endpoints to include patient-reported outcomes^144^, such as quality of life, postoperative functional recovery, and return to work, as well as assessments of surgical ergonomics^145^ and team dynamics, to ensure a holistic understanding of the impact of robotic surgery in routine clinical practice.
Strengths and limitations
The major strength of this systematic review and meta-analysis is the methodological robustness in its assessment of 90 studies encompassing over 65 000 patients, enabling precise effect estimates across a broad range of populations and practice settings. This review adhered to rigorous methodological standards throughout, in accordance with the GRADE framework, to assess the certainty of evidence for each outcome, strengthening the interpretability and clinical utility of the findings. The present analysis went beyond simple effect estimation by using a random-effects model that explicitly accounted for anticipated clinical and methodological heterogeneity. Importantly, extensive meta-regression and subgroup analyses were conducted to explore sources of heterogeneity, including industry support, disease stage, patient characteristics, and temporal effect. These efforts enabled plausible sources of variability to be identified and contextual interpretation of the results to be provided.
Despite these strengths, several limitations must be acknowledged. Most notably, the body of evidence is dominated by non-randomized observational studies, which are inherently susceptible to confounding, selection bias, and reporting bias. Although robust methodological tools were used to assess and mitigate these risks, residual confounding from unmeasured variables, such as surgeon experience, institutional volume, and perioperative protocols, remains a possibility and may have influenced the observed associations. Second, although RAG was associated with improved outcomes, these benefits may partly reflect centre- or surgeon-level expertise rather than the intrinsic superiority of the robotic platform itself. High-volume, technologically advanced centres are more likely to adopt robotic systems, and outcomes in such centres may not be generalizable to lower-volume or resource-constrained settings^146,147^. Furthermore, a small number of studies declared industry funding or support, which may have introduced sponsorship bias. In addition, by design, the analysis combined laparoscopic and open procedures into a single ‘conventional approach’ comparator to reflect current standard of care. A limitation of this approach is that it cannot distinguish whether the observed benefits of robotic surgery are more pronounced against open or laparoscopic techniques. Third, substantial variation in outcome definitions, reporting standards, and complication grading systems limited data harmonization across studies. For example, definitions of anastomotic leak were inconsistently reported, and follow-up durations varied, precluding reliable analysis of long-term outcomes such as disease-free or overall survival. In addition, the meta-regression addressed the mix of total and subtotal gastrectomies at a study level, but a key limitation remains the pooling of these clinically distinct procedures. Furthermore, the data extraction protocol did not include the use of neoadjuvant chemotherapy and, as such, its role as a potential confounder could not be directly assessed. This lack of standardization may have introduced outcome misclassification and contributed to between-study heterogeneity. To maintain a focused scope, this review deliberately excluded outcomes such as lymph node yield, operative time, and medium-term metrics (for example, readmission and reoperation rates). Fourth, although declared industry support was identified as a significant source of heterogeneity, it was not possible to fully account for undisclosed financial or non-financial conflicts of interest. Given the widespread prevalence of such undisclosed relationships among surgeons, as documented by systems like Open Payments^134^, the true influence of industry likely exceeds what the present analysis captured, introducing substantial unmeasured confounding. Thus, the findings of this study highlight the critical need for structured, independent training and credentialing programs. As previously discussed, industry-led training is inherently conflicted due to its primary goal of promoting platform adoption rather than objectively assessing competency. To safeguard patient safety and quality, training and assessment programs should instead be designed and governed independently by professional surgical societies and healthcare institutions, emphasizing proficiency-based progression and ongoing quality assurance.
Finally, although evaluation of learning curve effects and temporal trends was attempted, individual-level data were not available to rigorously model surgeon or institutional learning trajectories. Similarly, cost data were variably reported or absent, precluding formal assessment of cost-effectiveness, which is essential for health policy decision-making, particularly in publicly funded health systems.
Supplementary Material
zraf126_Supplementary_Data
The reference list from the paper itself. Each links out to its DOI / PubMed record.
- 1Noyes K, Myneni AA, Hoffman AB, Boccardo JD, Towle-Miller LM, Brophy T et al Trends in industry payments and volume and distribution of robot-assisted surgeries. Surg Endosc 2025;39:3215–322340216626 10.1007/s 00464-025-11724-2PMC 12041063 · doi ↗ · pubmed ↗
- 2Sheetz KH, Claflin J, Dimick JB. Trends in the adoption of robotic surgery for common surgical procedures. JAMA Netw Open 2020;3:e 191891131922557 10.1001/jamanetworkopen.2019.18911 PMC 6991252 · doi ↗ · pubmed ↗
- 3Abitbol J, Munir A, How J, Lau S, Salvador S, Kogan L et al The shifting trends towards a robotically-assisted surgical interface: clinical and financial implications. Health Policy Technol 2020;9:157–165
- 4Maynou L, Mc Guire A, Serra-Sastre V. Efficiency and productivity gains of robotic surgery: the case of the English National Health Service. Health Econ 2024;33:1831–185638733282 10.1002/hec.4838 · doi ↗ · pubmed ↗
- 5Ikoma N . What defines the ‘value’ of robotic surgery for patients with gastrointestinal cancers? Perspectives from a U.S. Cancer Center. Ann Gastroenterol Surg 2024;8:566–57938957558 10.1002/ags 3.12792 PMC 11216793 · doi ↗ · pubmed ↗
- 6National Institute for Heath and Care Excellence (NICE) . Robotic-assisted surgery for Oesophageal and Gastric Cancer: Early Value Assessment (HTE 21). NICE, 2025. https://www.nice.org.uk/guidance/HTE 21 (accessed 9 September 2025)
- 7Marcus HJ, Ramirez PT, Khan DZ, Layard Horsfall H, Hanrahan JG, Williams SC et al The IDEAL framework for surgical robotics: development, comparative evaluation and long-term monitoring. Nat Med 2024;30:61–7538242979 10.1038/s 41591-023-02732-7PMC 13157720 · doi ↗ · pubmed ↗
- 8Sung H, Ferlay J, Siegel RL, Laversanne M, Soerjomataram I, Jemal A et al Global cancer statistics 2020: GLOBOCAN estimates of incidence and mortality worldwide for 36 cancers in 185 countries. CA Cancer J Clin 2021;71:209–24933538338 10.3322/caac.21660 · doi ↗ · pubmed ↗