Fecal Contamination in Point of Use (POU) Drinking Water and Its Associated Factors in Ethiopia: Systematic Review and Meta‐Analysis; “Implications for SDG 6 and WASH Interventions”
Gashaw Melkie Bayeh, Abathun Temesgen, Almaw Genet Yeshiwas, Tilahun Degu Tsega, Sintayehu Simie Tsega, Asaye Alamneh Gebeyehu, Getaneh Atikilt Yemata, Rahel Mulatie Anteneh, Getasew Yirdaw, Chalachew Yenew, Amare Genetu Ejigu, Ahmed Fentaw Ahmed, Zeamanuel Anteneh Yigzaw

TL;DR
This study finds that over 65% of drinking water at the household level in Ethiopia is contaminated with feces, highlighting the need for better water, sanitation, and hygiene practices to meet global health goals.
Contribution
The study provides the first pooled estimate of fecal contamination in POU drinking water in Ethiopia and identifies key associated factors.
Findings
The pooled prevalence of fecal contamination in POU drinking water in Ethiopia is 65.02%.
Unimproved sanitation and water sources significantly increase contamination risk.
Household water treatment absence and unsafe handling practices are major behavioral risk factors.
Abstract
Access to safe drinking water is a fundamental human right and a critical component of public health, particularly in developing countries like Ethiopia. This systematic review and meta‐analysis aimed to assess the prevalence of fecal contamination in Point of Use (POU) drinking water and identify its associated factors within the Ethiopian context, with implications for achieving sustainable development goal (SDG) 6 and enhancing water, sanitation, and hygiene (WASH) interventions. A comprehensive search across multiple databases yielded 12 studies, encompassing 5285 drinking water samples. Funnel plot and I² test assessed publication bias and heterogeneity. The DerSimonian and Laird random‐effects model estimated the pooled prevalence of fecal contamination in POU drinking water. Eggers and Beggs tests evaluated the small study effect, while subgroup and sensitivity analyses…
Genes, proteins, chemicals, diseases, species, mutations and cell lines named across the full text — each resolved to its canonical identifier and authoritative record.
Click any figure to enlarge with its caption.
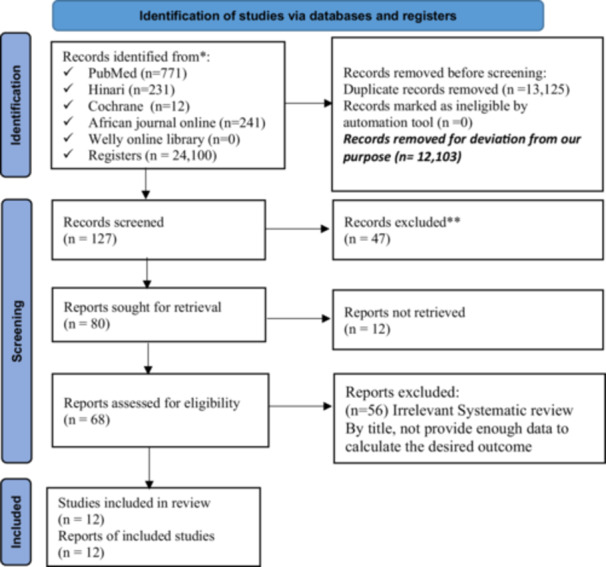 Figure 1
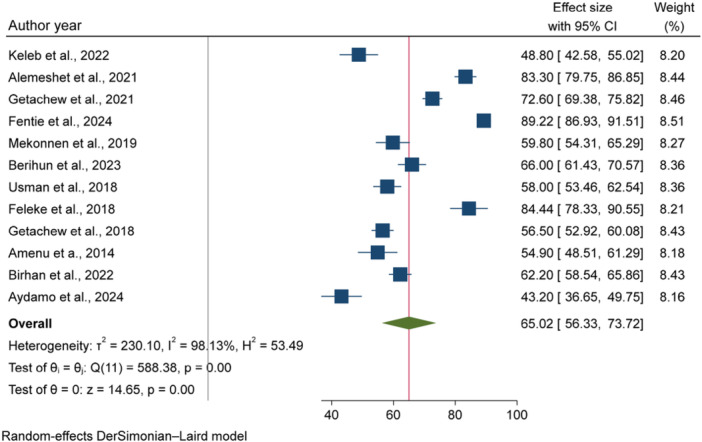 Figure 2
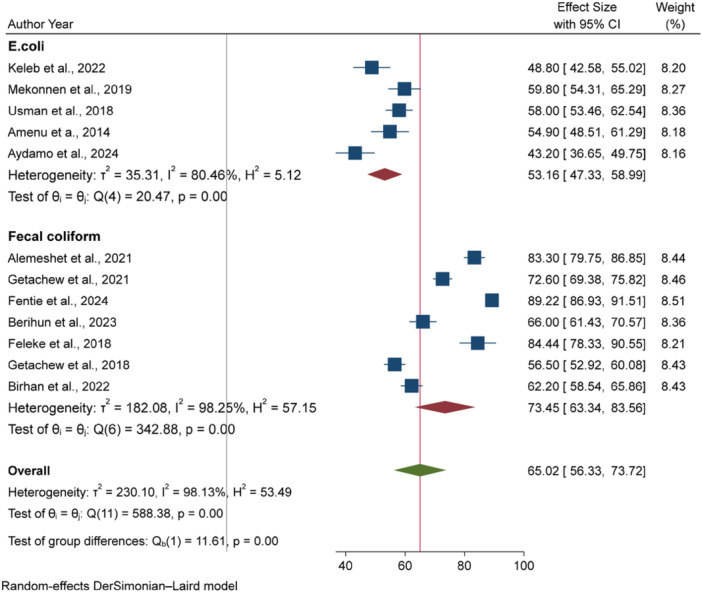 Figure 3
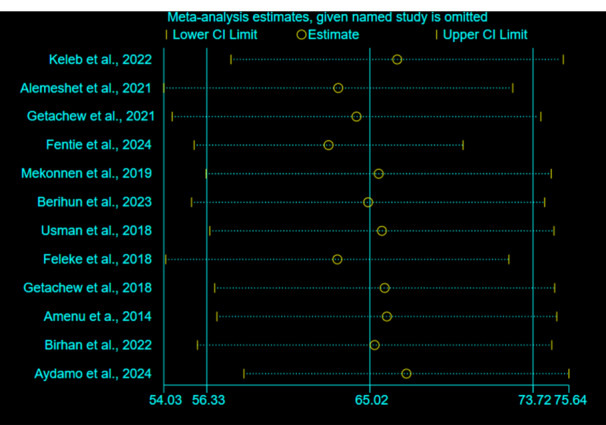 Figure 4
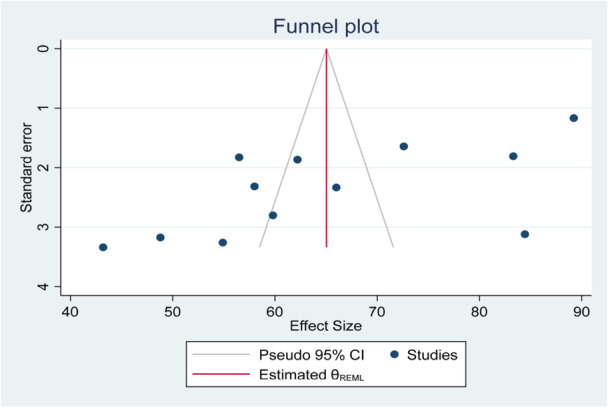 Figure 5
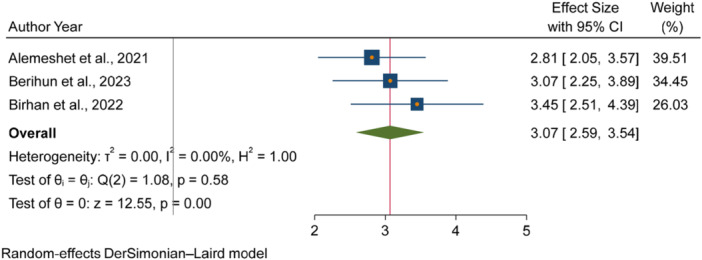 Figure 6
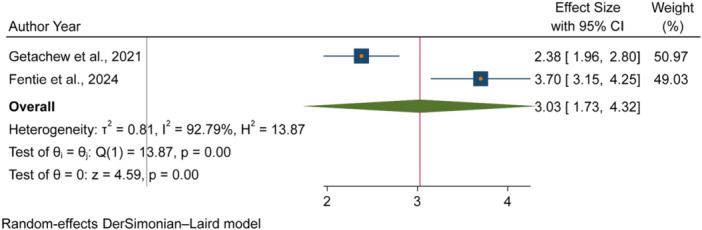 Figure 7
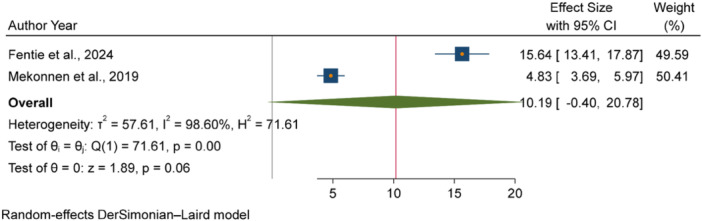 Figure 8
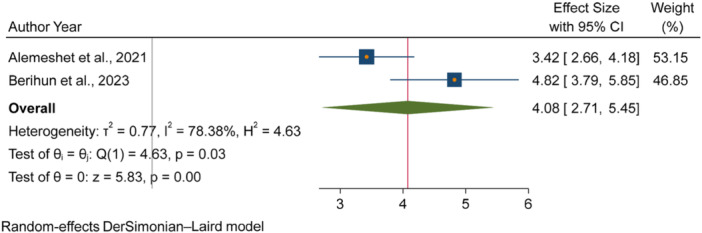 Figure 9
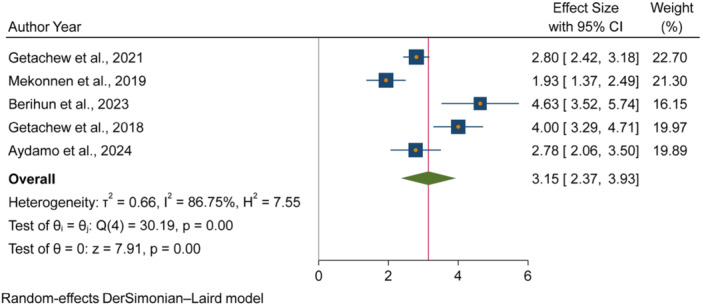 Figure 10
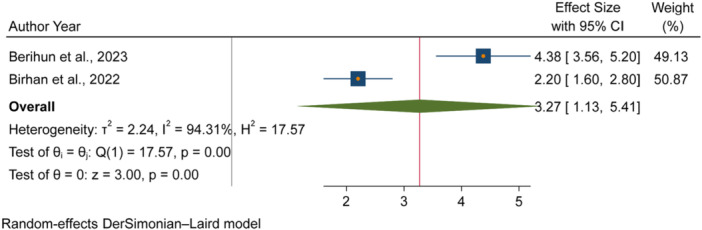 Figure 11
| No. | Author year | JBI quality assessment checklist for analytical studies | ||||||||
|---|---|---|---|---|---|---|---|---|---|---|
| Q1 = Were the criteria for inclusion in the sample clearly defined? | Q2 = Were the study subjects and the setting described in detail? | Q3 = Was the exposure measured in a valid and reliable way? | Q4 = Were objective, standard criteria used for measurement of the condition? | Q5 = Were confounding factors identified? | Q6 = Were strategies to deal with confounding factors stated? | Q7 = Were the outcomes measured in a valid and reliable way? | Q8 = Was appropriate statistical analysis used? | Quality score (%) | ||
| 1. | Alemeshet et al. 2021 [ | Yes | Yes | Yes | Yes | Yes | Yes | Yes | Yes | 100 |
| 2. | Getachew et al. 2021 [ | Yes | Yes | Yes | Yes | Yes | Yes | Yes | Yes | 100 |
| 3. | Fentie et al. 2024 [ | Yes | Yes | Yes | Yes | Yes | Yes | Yes | Yes | 100 |
| 4. | Mekonnen et al. 2019 [ | Yes | Yes | Yes | Yes | Yes | Yes | Yes | Yes | 100 |
| 5. | Berihun et al. 2023 [ | Yes | Yes | Yes | Yes | Yes | Yes | Yes | Yes | 100 |
| 6. | Getachew et al. 2018 [ | Yes | Yes | Yes | Yes | Yes | Yes | Yes | Yes | 100 |
| 7. | Birhan et al. 2022 [ | Yes | Yes | Yes | Yes | Yes | Yes | Yes | Yes | 100 |
| 8. | Aydamo et al. 2024 [ | Yes | Yes | Yes | Yes | Yes | Yes | Yes | Yes | 100 |
| No. | Author year | JBI quality assessment checklist for prevalence studies | |||||||||
|---|---|---|---|---|---|---|---|---|---|---|---|
| Q1 = Was the sample frame appropriate to address the target population? | Q2 = Were study participants sampled in an appropriate way? | Q3 = Was the sample size adequate? | Q4 = Were the study subjects and the setting described in detail? | Q5 = Was the data analysis conducted with sufficient coverage of the identified sample? | Q6 = Were valid methods used for the identification of the condition? | Q7 = Was the condition measured in a standard, reliable way for all participants? | Q8 = Was there appropriate statistical analysis? | Q9 = Was the response rate adequate, and if not, was the low response rate managed appropriately? | Quality score | ||
| 1. | Keleb et al. 2022 [ | Yes | Yes | No | Yes | No | Yes | Yes | Yes | Yes | 77.78 |
| 2. | Usman et al. 2018 [ | Yes | Yes | Yes | Yes | Yes | Yes | Yes | Yes | Yes | 100 |
| 3. | Feleke et al. 2018 [ | Yes | Yes | No | Yes | Yes | Yes | Yes | Yes | Yes | 88.89 |
| 4. | Amenu et al. 2014 [ | Yes | Yes | No | Yes | Yes | Yes | Yes | Yes | Yes | 88.89 |
| Std. Eff | Coefficient | Std. err |
|
| [95% Confidence interval] | |
|---|---|---|---|---|---|---|
| Slope | 101.0576 | 9.804731 | 10.31 | 0.000 | 79.21134 | 122.9039 |
| Bias | −15.33897 | 4.801726 | −3.19 | 0.010 | −26.03789 | −4.640062 |
| Meta estimate variables | Coefficient | Std. errs. |
|
| [95% Confidence interval] | |
|---|---|---|---|---|---|---|
| LCI | UCI | |||||
| Season of sampling | ||||||
| Dry | Ref | Ref | Ref | Ref | Ref | Ref |
| Wet | 12.1859 | 12.99075 | 0.94 | 0.348 | −13.27549 | 37.6473 |
| Dry & Wet | 8.985191 | 7.113522 | 1.26 | 0.207 | −4.957055 | 22.92744 |
| Water source type | ||||||
| Improved | Ref | Ref | Ref | Ref | Ref | Ref |
| Improved & Unimproved | −2.966077 | 7.199991 | −0.41 | 0.680 | −17.0778 | 11.14565 |
| Test type | ||||||
|
| Ref | Ref | Ref | Ref | Ref | Ref |
| Fecal coliform | 19.87291 | 7.561199 | 2.63 | 0.009 | 5.053234 | 34.69259 |
| Constant | 50.58018 | 7.042315 | 7.18 | 0.000 | 36.77749 | 64.38286 |
- —The authors received no specific funding for this work.
Peer Reviews
No public reviews on file for this paper yet. If you reviewed it on a platform where reviews are public (OpenReview, ICLR, NeurIPS, ICML), you can paste yours below so the community can read it here.
Videos
No videos yet. Explain this paper in a talk, walkthrough, or lecture? Add one.
Taxonomy
TopicsChild Nutrition and Water Access · Fecal contamination and water quality · Wastewater Treatment and Reuse
Introduction
1
Water is the most abundant resource on earth and it should be available to everyone, ensuring that no one is left behind [1]. Access to safe drinking water is acknowledged as a basic human right [2, 3], and the sustainable development goals (SDGs) emphasize the need for universal and equitable access to safe drinking water for every populations in member countries, including Ethiopia [4]. Ethiopia has successfully incorporated the SDGs into its Second Growth and Transformation Plan (GTP II), which was implemented from 2015/16 to 2019/20. Furthermore, the Ethiopian government has developed a 10‐year development plan for 2019/20 to 2029/30, ensuring complete alignment with the 2030 Agenda and the SDGs [4].
Despite the situation, millions in Ethiopia still rely on water sources that are untreated or poorly managed, creating major health risks [5]. About 32.5% of the Ethiopian population uses unimproved water sources, and 13.5% get their drinking water from surface water [6]. This highlights an urgent need for water treatment within HHs. Sadly, only less than 10% of Ethiopian HHs utilize effective water treatment methods [7, 8]. These circumstances contribute to a substantial burden of diarrheal diseases, which have serious implications for public health.
According to the global burden of disease (GBD), between 1990 and 2019, the number of deaths by diarrheal diseases related to unsafe water was decreased by 50%, while the rate of disability‐adjusted life years (DALYs) was declined by 59% [9]. Despite this progress, diarrheal diseases were still very common in areas with low Socio‐Demographic Index (SDI) levels, particularly in Africa. This is mainly due to interconnected problems, with about 69% of diarrhea cases attributed to poor water, sanitation, and hygiene (WASH) practices [10]. Diarrheal diseases are a significant concern for public health in Ethiopia, greatly impacting the rates of illness and death, particularly among children under 5 years old. They are the second leading cause of DALYs, with a rate of 2592.5 per 100,000, following lower respiratory infections [11].
The quality of drinking water is a crucial element in the spread of diarrheal diseases linked to WASH problems, particularly in developing nations like Ethiopia [12, 13]. The contamination of drinking water throughout its journey from the source to the Point of Use (POU) in HHs is responsible for the deterioration of its microbial quality, posing serious challenges to the realization of the SDGs in the country [14]. The microbial quality of drinking water at the POU is influenced by various factors, including environmental, behavioral, infrastructural, and socioeconomic conditions [15]. Drinking water source contamination can occur from runoff during heavy rains [16], and when water sources are near livestock or septic systems [17]. Poor sanitation in rural areas increases risks of contaminations [18]. Additionally, how people collect, store, and treat water can either reduce or increase contamination [19, 20, 21]. Practices like using unclean storage containers, leaving water uncovered and withdrawing water by dipping with unclean cans can lead to microbial contamination at home [14, 15, 22].
Despite improvements in access to water and sanitation, drinking water in many Ethiopian HHs remains vulnerable to contamination, resulting in higher rates of waterborne diseases. The water that has been treated both at the source and at the HH level often becomes re‐contaminated due to poor storage and handling practices. Therefore, monitoring water quality at the point of consumption is essential for accurately evaluating the immediate public health risks associated with drinking contaminated water [23]. This complements source water monitoring by providing a more complete picture of potential exposure and ensuring safety where it matters most. This is a critical step in achieving SDG 6 by designing appropriate interventions to ensure that water is safe for drinking, considering the potential for contamination during transport and storage.
Several studies have examined HH water treatment methods, handling practices, and drinking water quality within the Ethiopian context. Some of these studies highlighted that microbial contamination at the point of consumption is a significant problem in Ethiopia. However, ineffective and fragmented interventions have been implemented due to a lack of summarized data that could inform evidence‐based targeted interventions. Therefore, considering the importance of synthesis of existing evidence, this systematic review and meta‐analysis aimed to identify and analyze the key risk factors affecting the microbial quality of drinking water at the POU in Ethiopia, which may have an input in ensuring SDGs in the country.
Methods
2
Review Question
2.1
We have used CoCoPop as mnemonics review questions, where, The Condition (Co): Point of drinking water microbial quality; The Context (Co): in Ethiopia; The Population (Pop): Household level.
Protocol Registration
2.2
This study has been promptly registered with the International Prospective Register of Systematic Reviews (PROSPERO) to enhance transparency and reduce the risk of bias. The PRISMA checklist guideline was used to ensure study's quality and result validity, enhancing its credibility [24].
Search Strategy and Database
2.3
A comprehensive search strategy was used across multiple databases, including PubMed, Web of Science, Scopus, Cochrane Library, Google Scholar, and African Journals Online (AJOL). The search strategy used keywords and phrases connected with Boolean operators as follows: (((((((((((Drinking water) OR (Water)) AND (Microbial quality)) OR (Bacteriological quality)) OR (Fecal contamination)) OR (E. coli contamination)) AND (Associated factors)) OR (Risk Factors)) OR (Determinant Factors)) AND (Point of use)) AND (Ethiopia)). Inclusion and exclusion criteria were set to maintain the quality of included studies. Additionally, a manual search of reference lists and online repositories from the University of Gondar (UoG) and Addis Ababa University was done to find more literatures (Supporting Information S1: File S1).
Study Selection
2.4
The search strategy of the review was managed and arranged by EndNote version 8. Three authors (GM, AG, and AT) conducted an independent review of the included studies, during which duplicates of the articles were identified and removed. The titles and abstracts of the remaining articles were then reviewed to see if they satisfied the established inclusion and exclusion criteria. The full texts of the articles were also examined to determine the best and most pertinent literatures that were eventually included in this review. Disagreements among the reviewing authors during the article selection process were discussed and resolved by considering the relevance of the studies, their alignment with the goals of this review, and their adherence to the inclusion requirements. Additionally, if the disputes are not resolved through conversation based on objective standards, expert advice was sought. Finally, the three authors agreed upon the articles that were included in this review. The processes of article selection tried to include a rigorous, unbiased selection process and ensured the inclusion of high‐quality studies in the review.
Eligibility Criteria (Inclusion and Exclusion Criteria)
2.5
Inclusion Criteria
2.5.1
This review included full‐text articles that were published in English to avoid problems of inconsistencies during interpretation of results. Full‐text articles provided sufficient data, such as proportions, incidence rates, and odds ratios (ORs) related to the microbial quality of water at the POU. Time period restrictions was not made so that all relevant articles were included.
Exclusion Criteria
2.5.2
This review excluded articles that were not in full‐text format after the corresponding authors repeatedly declined our requests for full‐text access. Studies with insufficient data for key results such as the number of participants, and high risk of bias, or unclear methods for outcome assessment were also excluded.
Operational Definitions
2.6
POU Drinking Water
2.6.1
Water collected from various sources and made available for immediate drinking in HHs.
Fecal Contamination in POU Drinking Water
2.6.2
The presence of specific microbial indicators, i.e., either E. coli or thermo‐tolerant bacteria in a water that is made available for immediate drinking in HHs [25].
Data Extraction
2.7
Rigorous data extraction and reconciliation methods was used to ensure its accuracy, consistency, and reliability. A structured data extraction format was developed using Microsoft Excel 2016. Two authors (GM and AG) independently utilized this tool to record details including the primary authors’ names, publication year, study year, season of the study, sampling method, study setting, sample size, response rate, prevalence of fecal coliform indicator bacteria at the drinking point, and the ORs with their confidence intervals (CIs) for relevant factors. Disagreements in the results of data extraction process were handled by discussions between the two authors, with the third author (AT) verifying if needed. The prevalence of fecal coliform indicator bacteria at point of drinking was extracted or calculated by dividing the number of samples tested positive for fecal coliforms with the total number of samples tested from the included studies. The adjusted odds ratios (AOR) were directly extracted from the included studies (Supporting Information S2: File S2).
Quality Assessment (Criticism and Evaluation of Quality)
2.8
The Joanna Briggs Institute (JBI) quality appraisal checklist designed for cross‐sectional and prevalence studies was used to evaluate the methodological quality of included studies. Two authors (GM & AG) independently evaluated all studies for their quality, research comparability, and strength of statistical analysis. The authors discussed disagreements on quality evaluation results and reached a consensus on study inclusion. A quality evaluation score of 50% or higher was needed for a study to be included in this review, as it indicated an acceptable lower risk of bias (Tables 1 and 2).
Statistical Analysis and Data Aggregation
2.9
Data extracted with Microsoft Excel spreadsheet was exported to STATA version 17 software for further statistical analysis. A random‐effects model (DerSimonian and Laird) was employed under the assumption that the included studies do not estimate the same underlying effect size. This approach accounts for variability by recognizing that the true effect sizes differ across studies, which allows for a more accurate representation of the data. However, the inclusion of studies with varying effect sizes may inadvertently introduce publication bias, where studies with significant findings are more likely to be published. The Cochrane Q statistic and the I² index were used to evaluate the heterogeneity between studies. A value of I² ≤ 25% and I² ≥ 75% considered to indicate low and high heterogeneity, respectively. A p‐value less than 0.05 in Cochran's Q test was considered as there is significant heterogeneity.
Handling Publication Bias
2.10
To evaluate potential publication bias, Begg's rank correlation test and Egger's intercept test were employed, with a p‐value less than 0.05 indicating possible bias. A funnel plot was visually inspected to assess the symmetry of the included studies. When asymmetry was observed and Egger's test yielded a p‐value below 0.05, a trim‐and‐fill analysis was conducted to estimate the number of missing studies and adjust the overall effect size accordingly.
Subgroup and Sensitivity Analysis
2.11
The subgroup analysis was performed to determine the source of heterogeneity (I² index ≥ 50%) in data. Factors considered included the season of data collection (dry vs. wet), study year, study setting (urban vs. rural), water source type (improved vs. unimproved), study region and type of tests used (E. coli vs. fecal coliform) to better understand the data and improve water quality at the point of drinking. The sensitivity analysis was also conducted to see the effect of single study on the overall pooled prevalence estimates and increase robustness of the findings.
Displaying Results
2.12
The results of this meta‐analysis were displayed using a forest plot, which provided a clear visual presentation of the pooled effect sizes and their 95% CIs. The pooled AOR was used as the measure of effect size to identify variables predicting fecal contamination in POU drinking water in Ethiopia.
Ethical Approval and Consent to Participate
2.13
Ethical approval and consent to participate were not applicable for this study.
Results
3
Study Selection and Identification
3.1
A total of 25,355 studies or records were found from different electronic online databases. Of these, 13,125 studies were excluded due to duplication, and 12,103 records were removed due to deviation from the objectives of this review. Additionally, 85 studies were excluded after reviewing their titles and abstracts because of they were irrelevant for this review, and 115 studies were removed due to poor quality and a lack of clearly defined outcomes. Finally, 12 studies were included to assess the pooled effect size of fecal contamination in drinking water and its associated factors in Ethiopia (Figure 1).
PRISMA flow diagram for selection of included studies for systematic review and meta‐analysis on fecal contamination in POU drinking water and its associated factors in Ethiopia.
Characteristics of Included Studies
3.2
This systematic review and meta‐analysis incorporated a total of 5285 drinking water samples drawn from 12 selected studies. Majority 8 (66.67%) of included studies were from Amhara region [14, 15, 27, 29, 30, 31, 33, 34], while the rest four studies were from Harari [26], Gambella [28], Oromia [35], and SNNP [32] regions.
Prevalence of Fecal Contamination in POU Drinking Water in Ethiopia
3.3
The overall pooled prevalence of fecal contaminations in POU drinking water in Ethiopia was 65.02% [95% CI: 56.33, 73.72], with between studies heterogeneity (I ^2%^ = 98.13%, p < 0.001) (Figure 2).
The forest plot of the pooled prevalence of fecal contamination in POU drinking water in Ethiopia, 2024.
Heterogeneity and Publication Bias
3.3.1
The Cochrane heterogeneity value (I ^2%^ = 98.13%, p < 0.001) revealed substantial variability among the included studies. To explore possible sources of this heterogeneity, subgroup analysis were performed. Additionally, sensitivity analysis were conducted to assess the impact of individual studies on the overall pooled effect size and to enhance the robustness of the findings.
Sub‐Group Analysis
3.3.2
The microbial quality of drinking water at the POU is influenced by various factors, including seasonal variation, water source type, geographic regions, and differences between urban and rural settings. To assess their impact, we performed subgroup analysis based on the data collection season (dry vs. wet), study setting (urban vs. rural), water source type (improved vs. unimproved), region of the study, and type of tests used (E. coli vs. fecal coliform).
Our analysis identified the type of microbial test used as the primary source of heterogeneity. Studies measuring fecal coliform reported higher contamination rate of 73.45% [95% CI: 63.34, 83.56], compared to those measuring E. coli, which showed contamination rate of 53.16% [95% CI: 47.33, 58.99] (Figure 3).
Sub‐group analysis to explore the source of heterogeneity stratified by the type of water sample tests used.
Sensitivity Analysis
3.3.3
Sensitivity analysis using the random‐effects model revealed that no individual study significantly influenced the overall effect size (Figure 4).
Sensitivity analysis of the pooled prevalence of fecal contamination in POU drinking water in Ethiopia.
Publication Bias
3.3.4
The evidence of publication bias, attributed to small‐study effects, was identified through asymmetry in the funnel plot. Therefore, a trim‐and‐fill analysis was conducted to adjust for potential bias and visualize the funnel plot with imputed studies (Figure 5).
Funnel plot to show the presence of publication bias on the pooled prevalence of fecal contamination in POU drinking water in Ethiopia.
Furthermore, the Egger's test showed that there is evidence of small study effect (B = −15.33897, p = 0.010) (Table 3). However, the Begg's test (Kendall's score = −24.00, p = 0.1148) showed that there is no small study effect.
Meta Regression (Source of Publication Bias)
3.3.5
Meta regression was computed to identify sources of publication bias as both Egress test and funnel plot analysis revealed that an evidence of publication bias. The analysis revealed that the observed bias was primarily attributable to differences in microbial contamination measurement methods, i.e., fecal coliform versus E. coli. A statistically significant higher prevalence of fecal contamination of drinking water at the POU was found in studies measuring fecal coliform compared to those measuring E. coli (p = 0.009) (Table 4).
Factors Associated With Fecal Contaminations in POU Drinking Water in Ethiopia
3.4
The pooled odds of multiple studies demonstrated significant associations between increased fecal contamination in POU drinking water and both environmental and behavioral related factors. Environmental related factors included the use of unimproved sanitation facilities [26, 29, 31] (Figure 6), and water collected from unimproved water sources [15, 27] (Figure 7). In contrast, the use of surface water as a drinking source [15, 28] did not show statistically significant association with fecal contamination in POU drinking water (Figure 8). Behavioral factors contributing to fecal contamination in POU drinking water included the absence of HH water treatment practices [26, 29] (Figure 9), prolonged water storage habits [27, 28, 29, 30, 32] (Figure 10); and unsafe method of withdrawing water from storage container [29, 31] (Figure 11).
Forest plot showing the association between use of unimproved sanitation facilities and fecal contamination in POU drinking water in Ethiopia.
Forest plot showing the association between water collected from unimproved water sources and fecal contamination in POU drinking water in Ethiopia.
Forest plot showing the association between use of surface water as water source and fecal contamination in POU drinking water in Ethiopia.
Forest plot showing the association between inadequate HH water treatment and fecal contamination in POU drinking water in Ethiopia.
Forest plot showing the association between HH water storage practices and fecal contamination in POU drinking water in Ethiopia.
Forest plot showing the association between unsafe method of withdrawing water from storage container and fecal contamination in POU drinking water in Ethiopia.
Accordingly, HHs with unimproved sanitation facilities [26, 29, 31] had 3.07 times [3.07, 95% CI: 2.59, 3.54] higher fecal contamination in POU drinking water compared to those with improved sanitation facilities (Figure 6). Similarly, HHs collecting water from unimproved sources [15, 27] had 3.03 times [3.03, 95% CI: 1.73, 4.32] higher fecal contamination in POU drinking water compared to those who collect from improve sources (Figure 7). Additionally, HHs lacking water treatment practice [26, 29] had 4.08 times [4.08, 95% CI: 2.71, 5.45] higher fecal contamination in POU drinking water than HHs that treated their drinking water (Figure 9). Those HHs with prolonged water storage habits [27, 28, 29, 30, 32] had 3.15 times [3.15, 95% CI: 2.37, 3.93] higher fecal contamination in POU drinking water compared to those HHs without prolonged water storage habits (Figure 10). Those HHs employing unsafe methods for withdrawing water from storage containers [29, 31] had 3.27 times [3.27, 95% CI: 1.13, 5.41] higher fecal contamination in POU drinking water compared to those using safe withdrawal practices (Figure 11).
However, use of surface water as water source [15, 28] did not show significant association with fecal contamination of water at point of drinking (Figure 8).
Discussion
4
According to the World Health Organization (WHO), in 2022, at least 1.7 billion people globally relied on drinking water source contaminated with fecal matter [36]. The pooled prevalence of fecal contamination in POU drinking water in Ethiopia was 65.02% [95% CI: 56.33, 73.72], with among studies heterogeneity (I ^2%^ = 98.13%, p < 0.001). The substantial heterogeneity observed across studies (I² = 98.13%, p < 0.001) was attributed to differences in the microbial testing methods employed (E. coli vs. Fecal coliform). Subgroup analysis showed that studies measuring fecal coliform reported higher fecal contamination in POU drinking water (73.45%; 95% CI: 63.34, 83.56) compared to those measuring E. coli (53.16%; 95% CI: 47.33, 58.99). Similarly, meta‐regression analysis confirmed that studies measuring fecal coliform had higher prevalence of fecal contamination in POU drinking water compared to those measuring E. coli (p = 0.009). This might be due to the broader range of bacterial species included in fecal coliforms than E. coli alone. Fecal coliforms represent a group of bacteria that include several species, such as Enterobacter, Klebsiella, and Citrobacter, as well as E. coli. The E. coli, being a subset of fecal coliforms, specifically indicates more recent fecal contamination in drinking water.
The pooled prevalence of fecal contamination in POU drinking water [65.02%; 95% CI: 56.33, 73.72] in this review was lower than that reported in studies in Bangladesh (p = 83.78%) [37]. This discrepancy may be due to differences in HH water management practices among populations. For instance, many HHs (91.58%) in Bangladesh [37] did not treat their water, while 36.07% HHs [38], and 21% HHs [39] in Ethiopia used water treatment methods. Data collected over different years might also affect results, along with varying economic factors and access to water treatment options. For instance, POU drinking water treatment was rarely used in Ethiopia as reported in EDHS 3.0% in 2005, 8.2% in 2011, and 6.5% in 2016 [8].
On the other hand, the prevalence of fecal contamination in POU drinking water (p = 65.02%) in this review is in agreement with the prevalence reported in studies in Bangladesh (p = 62%) [40], (p = 70.8%) in data 38 countries [23]. This agreement likely arises from similarities in socioeconomic conditions in areas facing poor water and sanitation infrastructure. Like the current review, many of the countries examined in the latter studies [23, 40] were from Sub‐Saharan Africa (SSA) and other low and middle‐income countries (LMIC), where fecal contamination is widespread and a significant cause of waterborne diseases. The consistent results across various regions indicated that the problem is a global challenge, impacting efforts to achieve SDG 6, which aims to ensure access to clean water and sanitation for everyone.
However, the prevalence found in this review is lower than that reported in individual studies from Bangladesh (p = 73.96%) [41] and Nepal (p = 81%) [42]. This difference may be due to those studies being conducted at a single point in time, leading to higher prevalence rates, as some studies in this review reported rates that exceeded the pooled estimate.
This meta‐analysis revealed that POU drinking water in HHs with unimproved sanitation facilities had higher microbial contamination than in HHs with improved sanitation facilities [26, 29, 31]. This finding is in agreement with studies in Ghana [43] and Tanzania [44], where unimproved sanintation facilities were reported to have an increased risk of fecal contaminations in HH drinking water. This might be due to the fact that unimproved sanitation facilities promots open defication creating the full guarantee of environmental fecal contaminations. Open field defication is almost the inherent culture of most Ethiopian communities enven in HHs with imporoved sanitation facilities [45]. Open defication in both human and amimals exacerbate POU drinking water fecal contamination as this conditions facilitate water sources pollutions [46].
This review was also demonstrated that POU drinking water collected from unimproved sources [15, 27] were more likely to be contaminated with fecal bacteria than water collected from improved sources. The volume of evidences in LMICs [47], in multi‐national HH survey [23, 48], in Mozambique [49] reported similar findings, showing a strong association between unimproved water sources and increased fecal contamination in POU drinking water. This is due to both improved and unimproved water sources in environmentally contaminated areas are at an increased risk of fecal contamination due to the widespread occurrence of human and animal feces in nearby fields [50]. These findings underscore the critical importance of implementing water safety plans (WSPs) as established by the WHO. WSPs could provide a comprehensive framework for risk management in drinking‐water supplies, ensuring that all components of the water supply chain, from catchment to consumer, are thoroughly understood and monitored [51]. Additionally, the WHO has published guidelines and packages for conducting sanitary inspections and ensuring the quality of drinking water, particularly for smaller water supplies [52, 53]. However, HHs reliance on surface water as water source [15, 28] did not show significant association with fecal contamination of water at point of drinking. This finding is in contradiction with global intuitive knowledge, as surface water is generally considered more vulnerable to microbial contamination due to its exposure to environmental pollutants [54, 55]. The vulnerability of surface water for fecal contamination was proved by the independent studies included in this review [15, 28]. However, the result of this review may be attributed to the limited sample size and geographic scope of the two studies included in the analysis, which may not adequately capture the variability in surface water quality across different settings. Moreover, the absence of a significant association does not imply that surface water sources are free from fecal contamination.
Our review revealed that POU drinking water from HHs without water treatment practices [26, 29] was more likely to be contaminated with fecal bacteria compared to HHs that implemented water treatment at the HH level. A study conducted among emergency survivors in Indonesia revealed that use of chlorine solution in stored water was associated with the availability of clean drinking water in HHs [56]. Household water treatment is the last method of making POU drinking water safe, particularly in rural areas where access to piped water is limited. Studies indicated that drinking water from treated sources had an increased risk of fecal contamination at the POU within HHs, primarily due to unsafe handling and storage practices [42, 57]. This emphasizes that treatment of drinking water at any stage of the water supply system does not guarantee its safety unless it is properly used at the point of consumption. Alarmingly, the prevalence of HH water treatment in Ethiopia remains low, with less than 10% of HHs engaging in this practice [8]. In Sub‐Saharan countries, only 18% of HHs utilize adequate water treatment methods [58].
This review demonstrated that POU drinking water stored for extended period [27, 28, 29, 30, 32] was more likely to be contaminated with fecal matter compared to water stored for shorter durations. Drinking water stored for extended period may become contaminated from various sources including the storage vessel itself, hands, and the surrounding environment [59, 60]. Stored water in HHs often harbored higher levels of fecal coliform bacteria, especially when containers were not properly cleaned or were exposed to contaminants during use [61]. Water sources in rural areas are not treated with chlorine on a regular basis, making POU drinking water without residual disinfectants leading to a higher susceptibility to contamination over time [62, 63, 64]. What ever type of treatment POU drinking water received from its source, safe storage has pivotal role in preventing drinking water fecal contaminations in rural areas where water sources did not contian residual chlorine as they are not chlorinated on daily basis.
In this review, unsafe water withdrawing practice from storage container [29, 31] was significantly associated with higher POU drinking water fecal contamination compared to safe water withdrawing practices. Similar findings were reported in studies in Lima Peru [65], Kenya [66], Laos and Thailand [67], where stored water with wide mouthed container had an increased fecal contaminations as they might be contaminated during withdrawing water through dipping or scooping. Studies indicated that bowls used for dipping water from storage containers were also utilized for handwashing by dipping hands into the same bowl [68].
Strength and Limitations
5
This systematic review followed established protocols, including adherence to the PRISMA guidelines, ensuring transparency and reducing bias in the study selection process. However, the review included only 12 studies, which may limit the generalizability of the findings and the ability to draw stronger conclusions about the prevalence and factors associated with fecal contamination. Furthermore, majority of the studies included in this review were from Amhara region, which presents potential limitations, as variabilities in socioeconomic, cultural, and environmental factors across different regions may influence the outcomes of the studies. Most studies included in the review were cross‐sectional, which limits the ability to establish causal relationships between predictors and fecal contamination.
Conclusions and Recommendations
6
The fecal contamination in POU drinking water in Ethiopia was significantly high and this could challenge the country in achieving SDG 6. The review identified environmental related factors such as unimproved HH sanitation facilities, and unimproved drinking water sources; individual behavioral factors such as absence of HH water treatment practices, unsafe water withdrawal practices from storage container, and prolonged storage of POU drinking as significant predictors of higher fecal contamination in drinking water in HHs in Ethiopia. These findings indicated the urgent need in the multifaceted issues surrounding POU drinking water safety in low‐ and middle‐income countries, particularly Ethiopia, where access to clean water, hygiene and sanitation is limited. Therefore, targeted interventions, including behavioral education and programs promoting effective HH water treatment methods like chlorination, as well as safe storage and handling practices, are essential to ensure safe drinking water. The country should also invest in water source infrastructure and management to promote drinking water from improved water sources, as well as upgrade sanitation facilities, particularly in rural areas, to reduce open defecation practices to mitigate environmental contamination of water sources.
Author Contributions
G.M.B. conception, design, acquisition of data or analysis and interpretation of data and wrote the manuscript. A.G.Y., A.T., T.D.T., S.S.T., A.A.G., G.A.Y., R.M.A., and C.H.Y. designed the study and analyzed, interpreted, and wrote the manuscript. A.G.E., A.F.A., A.M.K., H.M., Z.A.Y., A.S.E., M.A.A., B.A.M., A.S.A., and G.Y. reviewed and wrote the manuscript.
Consent
The authors have nothing to report.
Conflicts of Interest
The authors declare no conflicts of interest.
Transparency Statement
The lead author Gashaw Melkie Bayeh affirms that this manuscript is an honest, accurate, and transparent account of the study being reported; that no important aspects of the study have been omitted; and that any discrepancies from the study as planned (and, if relevant, registered) have been explained.
Supporting information
Supporting file 1: Key words and phrases used in different Databases for search strategy.
Supporting file 2: Data extraction tool to extract data from included studies.
The reference list from the paper itself. Each links out to its DOI / PubMed record.
- 1U. Nations , Human Rights to Water and Sanitation, 2010, https://www.unwater.org/water-facts/human-rights-water-and-sanitation.
- 2U. Nations , Resolution Adopted by the General Assembly on 28 July 2010, https://digitallibrary.un.org/record/687002?v=pdf#files.
- 3U. H. R. Office , The Right to Water; Fact Sheet 35, 2010, https://www.ohchr.org/sites/default/files/2021-09/Fact Sheet 35en.pdf.
- 4U. N. Ethiopia , Our Work on the Sustainable Development Goals in Ethiopia, 2024, https://ethiopia.un.org/en/sdgs.
- 5F. M. Aragaw , M. W. Merid , T. M. Tebeje , M. G. Erkihun , and A. H. Tesfaye , “Unimproved Source of Drinking Water and Its Associated Factors: A Spatial and Multilevel Analysis of Ethiopian Demographic and Health Survey,” BMC Public Health 23, no. 1 (2023): 1455.37525187 10.1186/s 12889-023-16354-8PMC 10388450 · doi ↗ · pubmed ↗
- 6Ca Icf , Mini Demographic and Health Survey 2019, 2019, https://www.unicef.org/ethiopia/media/1721/file/The%202019%20Ethiopia%20Mini%20Demographic%20and%20Health%20Survey%20.pdf.
- 7Ca Icf , Ethiopia Demographic and Health Survey 2016 [FR 328], 2016, https://www.dhsprogram.com/pubs/pdf/FR 328/FR 328.pdf.
- 8A. Geremew , B. Mengistie , J. Mellor , D. S. Lantagne , E. Alemayehu , and G. Sahilu , “Appropriate Household Water Treatment Methods in Ethiopia: Household Use and Associated Factors Based on 2005, 2011, and 2016 EDHS Data,” Environmental Health and Preventive Medicine 23 (2018): 46.30261840 10.1186/s 12199-018-0737-9PMC 6161466 · doi ↗ · pubmed ↗