Pre-existing subclinical hypothyroidism and low free thyroxine in patients undergoing immune checkpoint inhibitor therapies is a risk factor for overt hypothyroidism
Yu Bai, Yue Yin, Hong Liu

TL;DR
Patients with pre-existing thyroid issues are more likely to develop severe thyroid problems during cancer treatments with immune checkpoint inhibitors.
Contribution
Identifies specific baseline thyroid markers that predict earlier onset of ICI-induced hypothyroidism.
Findings
51.52% of patients with subclinical abnormal baseline thyroid function developed overt thyroid dysfunction during ICI therapy.
Baseline free thyroxine (FT4) <13.91 pmol/L was strongly associated with higher risk of overt hypothyroidism.
Severe subclinical hypothyroidism with FT4 <13.91 pmol/L was linked to a significantly shorter time to overt hypothyroidism.
Abstract
Immune checkpoint inhibitors (ICIs) have transformed cancer therapy. However, these therapies commonly precipitate immune-related adverse events, with thyroid dysfunction being the most frequent manifestation of endocrine toxicity. Whether subclinical abnormal baseline thyroid function (sABTF) predisposes to overt thyroid dysfunction during ICI therapy—and if so, how it influences time-to-onset, phenotype, severity, and clinical decision have not been fully elucidated. We conducted a retrospective cohort study of 235 patients with cancer who underwent ICI therapy at Peking University Cancer Hospital between January 1, 2018, and September 30, 2024. Patients were stratified by baseline thyroid function status and monitored for ICI-induced overt thyroid dysfunction. Multivariate logistic regression analysis identified the risk factors for overt thyroid dysfunction. To examine baseline…
Genes, proteins, chemicals, diseases, species, mutations and cell lines named across the full text — each resolved to its canonical identifier and authoritative record.
Click any figure to enlarge with its caption.
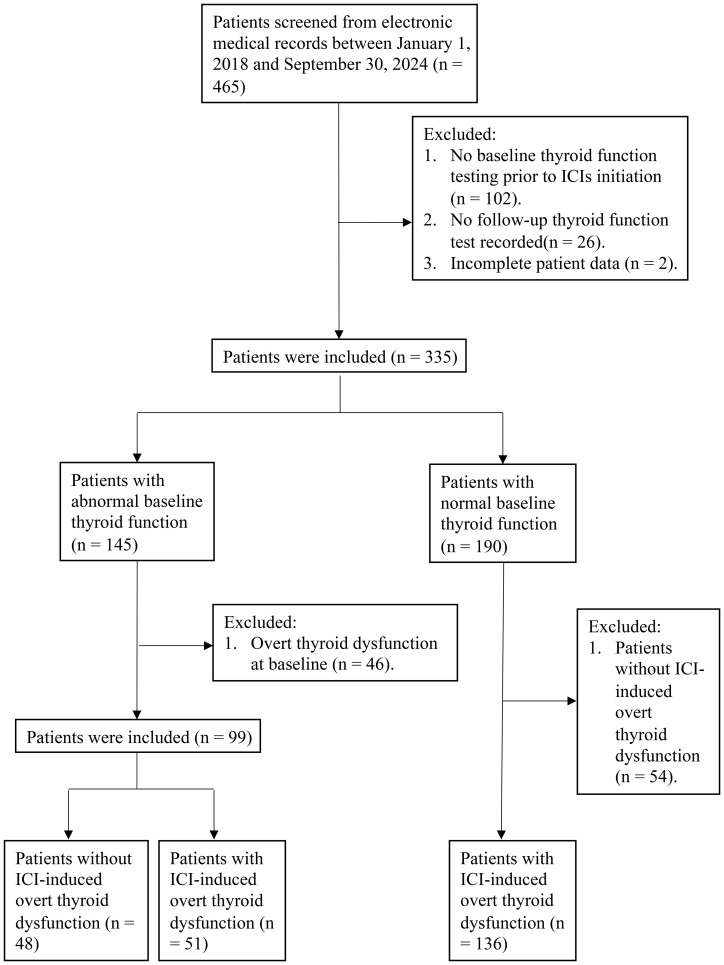 Figure 1
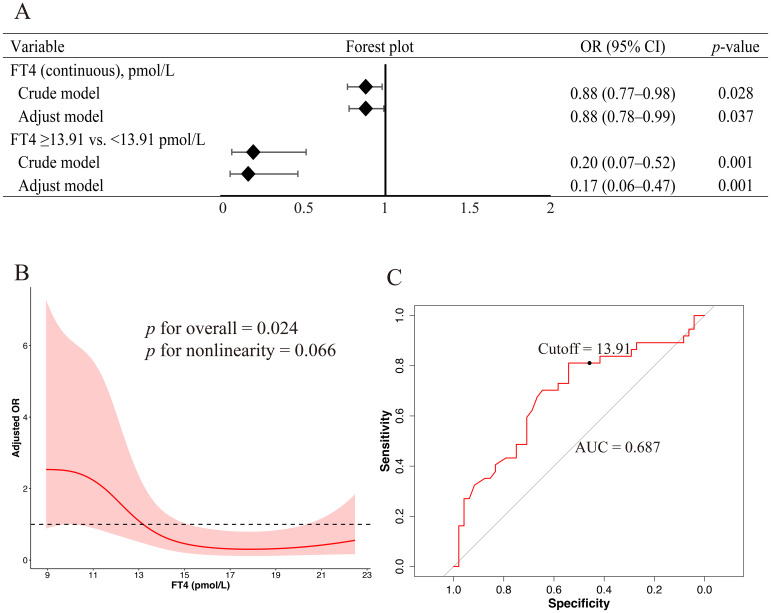 Figure 2
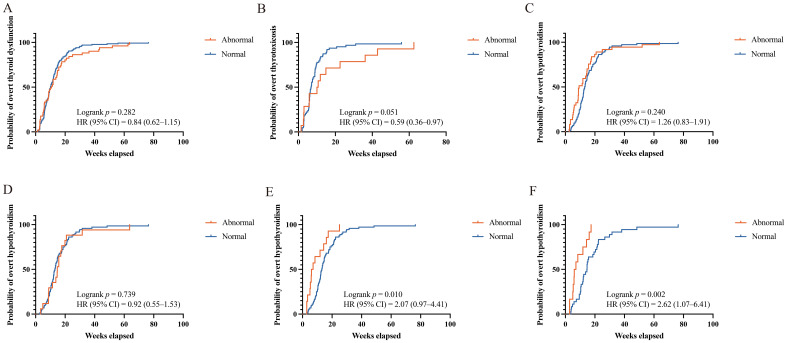 Figure 3
| Characteristic | Without overt thyroid dysfunction (n = 48) | With overt thyroid dysfunction (n = 51) | |
|---|---|---|---|
| Sex, n (%) | 0.633 | ||
| Male | 25 (52.08%) | 29 (56.86%) | |
| Female | 23 (47.92%) | 22 (43.14%) | |
| Age, years | 57.30 ± 14.12 | 57.69 ± 10.00 | 0.907 |
| BMI, kg/m2 | 22.41 (21.19, 24.69) | 25.22 (21.33, 26.94) | 0.066 |
| Medical history, n (%) | |||
| Thyroid disease | 18 (37.50%) | 18 (35.29%) | 0.820 |
| Hypertension | 19 (39.58%) | 14 (27.45%) | 0.201 |
| Diabetes mellitus | 11 (22.92%) | 6 (11.76%) | 0.141 |
| Smoking history, n (%) | 19 (39.58%) | 19 (37.25%) | 0.812 |
| Alcohol consumption, n (%) | 13 (27.08%) | 16 (31.37%) | 0.639 |
| ECOG performance status, n (%) | 0.670 | ||
| 0 | 31 (64.58%) | 35 (68.63%) | |
| 1–2 | 17 (35.42%) | 16 (31.37%) | |
| Site of tumor, n (%) | 0.129 | ||
| Thoracic | 16 (33.33%) | 11 (21.57%) | |
| Digestive system | 8 (16.67%) | 17 (33.33%) | |
| Others | 24 (50.00%) | 23 (45.10%) | |
| Stage, n (%) | 0.937 | ||
| I–II | 3 (6.25%) | 3 (5.88%) | |
| III | 9 (18.75%) | 11 (21.57%) | |
| IV | 36 (75.00%) | 37 (72.55%) | |
| Line of therapy, n (%) | 0.914 | ||
| <3 | 39 (81.25%) | 41 (80.39%) | |
| ≥3 | 9 (18.75%) | 10 (19.61%) | |
| Prior use of ICIs | 8 (16.67%) | 10 (19.61) | 0.750 |
| ICIs combination regimen, n (%) | 0.375 | ||
| Monotherapy | 7 (14.58%) | 4 (7.84%) | |
| CTLA-4 | 1 (2.08%) | 1 (1.96%) | |
| Chemotherapy | 24 (50.00%) | 21 (41.18%) | |
| Targeted therapy | 9 (18.75%) | 18 (35.29%) | |
| Chemotherapy and targeted | 7 (14.58%) | 7 (13.73%) | |
| Radiotherapy, n (%) | 4 (8.33%) | 4 (7.84%) | >0.999 |
| Baseline thyroid function abnormalities, n (%) | 0.288 | ||
| Mild subclinical hypothyroidism | 25 (52.08%) | 21 (41.18%) | |
| Severe subclinical hypothyroidism | 9 (18.75%) | 17 (33.33%) | |
| Subclinical thyrotoxicity | 2 (4.17%) | 4 (7.84%) | |
| FT4 or FT3 abnormality | 12 (25.00%) | 9 (17.65%) | |
| Baseline thyroid indicators | |||
| TSH, mIU/L | 5.79 (2.87, 7.93) | 6.33 (4.51, 12.17) | 0.220 |
| FT3, pmol/L | 4.02 (3.19, 4.49) | 3.77 (3.29, 4.29) | 0.355 |
| FT4, pmol/L | 14.14 (11.75, 17.25) | 12.20 (10.25, 15.71) |
|
| Laboratory indicators | |||
| Albumin, g/L | 43.20 (39.95, 45.62) | 44.10 (39.40, 46.00) | 0.680 |
| Serum creatinine, μmol/L | 61.55 (54.00, 72.50) | 66.00 (55.00, 79.50) | 0.267 |
| ALT, IU/L | 14.55 (11.75, 20.00) | 15.00 (11.00, 21.50) | 0.850 |
| AST, IU/L | 19.00 (16.00, 24.50) | 20.00 (15.50, 25.50) | 0.744 |
| NLR | 3.31 (2.37, 4.33) | 2.60 (1.85, 3.52) |
|
| PLR | 156.76 (111.96, 218.22) | 140.17 (108.16, 214.19) | 0.619 |
| Characteristic | Thyroid dysfunction (n = 99)1 | Hypothyroidism (n = 85)1 | Thyrotoxicosis (n = 62)1 | |||
|---|---|---|---|---|---|---|
| OR (95%CI) | OR (95%CI) | OR (95%CI) | ||||
| Sex | ||||||
| Male | 1.00 (Reference) | 1.00 (Reference) | 1.00 (Reference) | |||
| Female | 0.82 (0.37–1.82) | 0.633 | 0.67 (0.27–1.68) | 0.396 | 1.11 (0.30–4.06) | 0.873 |
| Age, years | 1.00 (0.97–1.04) | 0.872 | 1.00 (0.97–1.04) | 0.809 | 0.97 (0.92–1.03) | 0.287 |
| BMI, kg/m2 | 1.10 (0.98–1.23) | 0.115 | 1.07 (0.94–1.22) | 0.320 | 1.13 (0.92–1.39) | 0.228 |
| FT4, pmol/L | 0.93 (0.85–1.02) | 0.121 | 0.88 (0.78–0.99) |
| 1.01 (0.88–1.16) | 0.914 |
| NLR | 0.89 (0.75–1.07) | 0.217 | 0.97 (0.81–1.16) | 0.750 | 0.62 (0.36–1.07) | 0.087 |
| Characteristic | Abnormal (n = 51) | Normal (n = 136) | |
|---|---|---|---|
| Sex, n (%) | 0.833 | ||
| Male | 29 (56.86%) | 75 (55.15%) | |
| Female | 22 (43.14%) | 61 (44.85%) | |
| Age, years | 57.69 ± 10.00 | 58.12 ± 10.59 | 0.802 |
| BMI, kg/m2 | 25.22 (21.33, 26.94) | 23.35 (21.20, 25.63) | 0.179 |
| Medical history, n (%) | |||
| Thyroid disease | 18 (35.29%) | 16 (11.76%) |
|
| Hypertension | 14 (27.45%) | 40 (29.41) | 0.792 |
| Diabetes mellitus | 6 (11.76%) | 19 (13.97%) | 0.693 |
| Smoking history, n (%) | 19 (37.25%) | 71 (52.21%) | 0.068 |
| Alcohol consumption, n (%) | 16 (31.37%) | 41 (30.15%) | 0.871 |
| ECOG performance status, n (%) | 0.441 | ||
| 0 | 35 (68.63%) | 101 (74.26%) | |
| 1–2 | 16 (31.37%) | 35 (25.74%) | |
| Site of tumor, n (%) | 0.957 | ||
| Thoracic | 11 (21.57%) | 32 (23.53%) | |
| Digestive system | 17 (33.33%) | 45 (33.09%) | |
| Others | 23 (45.10%) | 59 (43.38%) | |
| Stage, n (%) | 0.588 | ||
| I–II | 3 (5.88%) | 5 (5.68%) | |
| III | 11 (21.57%) | 26 (29.55%) | |
| IV | 37 (72.55%) | 57 (64.77%) | |
| Line of therapy, n (%) | 0.460 | ||
| <3 | 41 (80.39%) | 75 (85.23%) | |
| ≥3 | 10 (19.61%) | 13 (14.77%) | |
| Prior use of ICIs | 10 (19.61%) | 5 (5.15%) |
|
| ICIs combination regimen, n (%) | 0.059 | ||
| Monotherapy | 4 (7.84%) | 21 (15.44%) | |
| CTLA-4 | 1 (1.96%) | 2 (1.47%) | |
| Chemotherapy | 21 (41.18%) | 76 (55.88%) | |
| Targeted therapy | 18 (35.29%) | 26 (19.12%) | |
| Chemotherapy and targeted | 7 (13.73%) | 11 (8.09%) | |
| Radiotherapy, n (%) | 4 (7.84%) | 7 (5.15%) | 0.727 |
| Laboratory indicators | |||
| Albumin, g/L | 44.10 (39.40, 46.00) | 44.20 (42.00, 46.50) | 0.228 |
| Serum creatinine, μmol/L | 66.00 (55.00, 79.50) | 62.00 (53.00, 72.00) | 0.129 |
| ALT, IU/L | 15.00 (11.00, 21.50) | 16.00 (11.00, 22.00) | 0.687 |
| AST, IU/L | 20.00 (15.50, 25.50) | 18.00 (15.00, 23.00) | 0.196 |
| NLR | 2.60 (1.85, 3.52) | 2.72 (1.84, 4.22) | 0.374 |
| PLR | 140.17 (108.16, 214.19) | 165.59 (120.84, 236.65) | 0.218 |
| Outcome |
| ||
| Overt thyrotoxicosis | 14 (27.45%) | 73 (53.68%) | |
| Overt hypothyroidism | 37 (72.55%) | 63 (46.32%) |
| Characteristic | OR (95%CI) | |
|---|---|---|
| Sex | ||
| Male | 1.00 (Reference) | |
| Female | 0.93 (0.49–1.78) | 0.833 |
| Age, years | 1.00 (0.97–1.03) | 0.800 |
| BMI, kg/m2 | 1.03 (0.94–1.13) | 0.495 |
| History of thyroid disease | ||
| No | 1.00 (Reference) | |
| Yes | 4.09 (1.88–8.89) |
|
| Smoking history | ||
| No | 1.00 (Reference) | |
| Yes | 0.54 (0.28–1.05) | 0.070 |
| Prior use of ICIs | ||
| No | 1.00 (Reference) | |
| Yes | 4.49 (1.61–12.56) |
|
| ICIs combination regimen | ||
| Monotherapy | 1.00 (Reference) | |
| CTLA-4 | 2.63 (0.19–36.34) | 0.472 |
| Chemotherapy | 1.45 (0.45–4.69) | 0.534 |
| Targeted therapy | 3.63 (1.07–12.39) |
|
| Chemotherapy and targeted | 3.34 (0.80–13.94) | 0.098 |
| Outcome | ||
| Thyrotoxicosis | 1.00 (Reference) | |
| Hypothyroidism | 2.28 (1.13–4.60) |
|
| Model | TSH > 10 mIU/L | TSH > 10 mIU/L and FT4 <13.91 pmol/L | ||
|---|---|---|---|---|
| HR (95%CI) | HR (95%CI) | |||
| Model 1 | 2.36 (1.30–4.31) |
| 2.95 (1.45–6.01) |
|
| Model 2 | 2.32 (1.27–4.24) |
| 2.98 (1.41–6.30) |
|
| Model 3 | 2.84 (1.42–5.67) |
| 10.05 (3.13–32.23) |
|
Peer Reviews
No public reviews on file for this paper yet. If you reviewed it on a platform where reviews are public (OpenReview, ICLR, NeurIPS, ICML), you can paste yours below so the community can read it here.
Videos
No videos yet. Explain this paper in a talk, walkthrough, or lecture? Add one.
Taxonomy
TopicsThyroid Disorders and Treatments · Cancer Immunotherapy and Biomarkers · Adrenal Hormones and Disorders
Introduction
1
Immune checkpoint inhibitors (ICIs) have substantially improved outcomes across multiple advanced malignancies; however, these therapies increase the risk of immune-related adverse events (irAEs). Thyroid dysfunction is the most frequently reported manifestation of endocrine toxicity (1, 2). The estimated incidence of ICI-induced thyroid dysfunction ranges from 40% to 50%, with overt disorders, including hypothyroidism and thyrotoxicosis, occurring in up to 20% of patients during treatment (3, 4).
Most of the clinical studies and trials investigating ICI-related toxicity have primarily focused on patients with normal baseline thyroid function (NBTF). However, a significant subset of patients present with subclinical abnormal baseline thyroid function (sABTF) before treatment, including subclinical hypothyroidism, subclinical hyperthyroidism, or isolated abnormalities in free triiodothyronine (FT3) and free thyroxine (FT4). These individuals are frequently excluded from clinical trials and often overlooked in real-world studies. Previous studies have suggested that approximately 21% of patients exhibit abnormal baseline thyroid-stimulating hormone (TSH) levels (5, 6), and that among such patients, thyroid function frequently deteriorates following ICI initiation (median time to new or worsening dysfunction 6.6 and 4.7 weeks, respectively) (5). Therefore, more intensive monitoring is warranted during the first 8 weeks of therapy (5). Moreover, baseline TSH abnormalities have been associated with poor overall survival (6).
Clinical practice guidelines uniformly recommend screening for thyroid function before ICI initiation (7). Major medical societies advise periodic monitoring during treatment. The American Society of Clinical Oncology and Society for Immunotherapy of Cancer recommend monitoring function every 4–6 weeks (1, 2), and the European Society for Medical Oncology and European Society of Endocrinology recommend screening during each treatment cycle (7, 8). However, to our knowledge, specific management protocols for patients with sABTF have not yet been developed. Current guidelines typically recommend repeat TSH and FT4 testing at regular intervals or shared care with endocrinology (1, 2, 7, 8). Research in this area is limited, and the clinical characteristics of the patients with sABTF need to be systematically investigated to develop evidence-based management strategies.
To address this research gap, we conducted this retrospective cohort study to characterize the clinical course of ICI-induced overt thyroid dysfunction in patients with sABTF. Specifically, we compared the incidence and time to onset of overt dysfunction between those patients with and those without baseline abnormalities and explored risk stratification to identify clinically actionable high-risk subsets. We hypothesized that pre-existing thyroid dysfunction confers both a higher risk and an earlier onset of overt thyroid dysfunction after ICI initiation, particularly among high-risk subgroups.
Materials and methods
2
Study population
2.1
This retrospective study was conducted at Peking University Cancer Hospital between January 1, 2018, and September 30, 2024. Eligible patients were identified using the hospital’s electronic medical record system, based on both medication prescriptions and disease diagnosis. The administered ICIs included pembrolizumab, camrelizumab, tislelizumab, atezolizumab, nivolumab, sintilimab, toripalimab, durvalumab, serplulimab, ipilimumab, and cadonilimab. In addition, patients were required to have a diagnosis of thyroid dysfunction, manifested as hyperthyroidism, hypothyroidism, or thyrotoxicosis.
A total of 465 patients were initially identified. The inclusion criteria were as follows (1): age ≥18 years (2); thyroid function tests performed at baseline, defined as within 30 days before or up to 7 days after the initiation of ICI therapy; and (3) availability of thyroid function assessments during and after ICI treatment. The exclusion criteria were as follows (1): significant missing clinical data (2); presence of overt thyroid dysfunction at baseline in patients classified as having sABTF; and (3) absence of ICI-induced overt thyroid dysfunction in patients with normal baseline thyroid function.
After applying these criteria, 235 patients were selected for inclusion in the study. Among these, 99 had sABTF and 136 had NBTF with the subsequent development of ICI-induced overt thyroid dysfunction (Figure 1).
Flow diagram of patient selection.
Definitions
2.2
ICI-induced overt thyroid dysfunction was defined as new-onset overt thyroid dysfunction that occurred after the initiation of ICI therapy as determined based on abnormal thyroid function test results. Overt thyrotoxicosis is defined as suppressed TSH levels accompanied by elevated FT4 and/or FT3 levels (9), while overt hypothyroidism is defined as elevated TSH levels with concurrently decreased FT4 levels (10). Subclinical thyrotoxicosis and hypothyroidism are characterized by abnormal TSH levels below or above the reference range, respectively—in the presence of normal FT4 concentrations (9, 11). Subclinical hypothyroidism was further stratified by severity: mild cases were defined as TSH levels above the reference range but below 10 mIU/L, whereas severe cases were defined as TSH levels of 10 mIU/L or higher (11). Isolated FT3/FT4 abnormality was defined as a baseline FT3 or FT4 concentration outside the laboratory reference interval with a concurrent TSH within the reference range.
The time of onset of overt thyroid dysfunction was defined as the interval between the initiation of ICI therapy and the date of the first thyroid function test showing overt dysfunction.
Laboratory measurements
2.3
Serum concentrations of FT3, FT4, and TSH were measured using an automated chemiluminescence immunoassay analyzer (Alinity; Abbott Laboratories; North Chicago, IL, USA) and Roche diagnostic kits (Roche Diagnostic; Roche Ltd.; Basel, Switzerland). Reference intervals established by the Peking University Cancer Hospital laboratory were as follows: FT3, 2.43–6.01 pmol/L; FT4, 9.01–19.05 pmol/L; and TSH, 0.35–4.94 mIU/L.
Covariates
2.4
The following covariates were extracted from the electronic medical records: demographic and lifestyle factors, including age, sex, height, weight, body mass index (BMI; calculated as weight in kilograms divided by height in meters squared), smoking history, and alcohol consumption history. The medical history variables included prior thyroid disease (hypothyroidism, thyrotoxicosis, hyperthyroidism, thyroiditis, or partial thyroidectomy), hypertension, diabetes mellitus, and previous exposure to ICIs. The clinical characteristics included the Eastern Cooperative Oncology Group performance status, tumor type and stage, line therapy, ICI treatment regimen (e.g., monotherapy or combination therapy), and whether radiotherapy was administered as part of the treatment course. The baseline laboratory parameters included albumin, serum creatinine, alanine aminotransferase, aspartate aminotransferase, absolute neutrophil, absolute lymphocyte, and absolute platelet counts. Neutrophil-to-lymphocyte ratio (NLR) and platelet-to-lymphocyte ratio were calculated.
Statistical analysis
2.5
Continuous variables were tested for normality using appropriate statistical tests. Variables with a normal distribution are reported as means ± standard deviations and were compared using independent-samples t-tests. Non-normally distributed variables are expressed as medians and interquartile ranges (IQRs), with between-group comparisons performed using the Mann-Whitney U test. Categorical variables are summarized as frequencies and percentages and were compared using Pearson’s chi-square test or Fisher’s exact test, as appropriate. Multivariate logistic regression analyses were conducted to identify the factors associated with outcomes, with covariates selected based on univariate p-values < 0.10 and clinical relevance. Odds ratios (ORs) and corresponding 95% confidence intervals (CIs) were reported.
To flexibly model the potential nonlinear association between the baseline FT4 levels and ICI-induced overt hypothyroidism, we employed restricted cubic spline (RCS) regression. FT4 was fitted with RCS functions using 4 knots located at equally spaced percentiles (5th, 35th, 65th, and 95th percentiles). Logistic regression models were constructed with RCS-transformed FT4 values as predictors, adjusting for potential confounders including sex, age, BMI, and NLR. The overall association and presence of nonlinearity were assessed using Wald chi-square tests, and p-values for both the overall and nonlinear effects were reported. Adjusted ORs and 95% CIs were plotted against the FT4 levels.
To determine the optimal cutoff value of FT4 for predicting the risk of ICI-induced overt hypothyroidism, receiver operating characteristic (ROC) curve analysis was performed. The Youden index (sensitivity + specificity − 1) was used to identify the optimal threshold that maximized the overall diagnostic accuracy. The area under the ROC curve was calculated to assess the discriminative ability of FT4.
Time-to-event outcomes were analyzed using Kaplan-Meier survival curves, and between-group comparisons were performed using the log-rank test. To identify the independent predictors of earlier onset, Cox proportional hazards models were constructed, adjusting for age and sex based on clinical relevance. Hazard ratios (HRs) and corresponding 95% CIs were reported.
All statistical tests were two-sided, and a p-value < 0.05 was considered statistically significant. Analyses were conducted using R version 4.2.2 (R Foundation for Statistical Computing, Vienna, Austria), and R packages “rms,” “pROC,” and “survival.” Figures were generated using GraphPad Prism, version 10 (GraphPad Software, San Diego, CA, USA).
Results
3
Risk of ICI-induced overt thyroid dysfunction in patients with pre-existing abnormal baseline thyroid function
3.1
Among the 99 patients with sABTF at baseline, 72 had subclinical hypothyroidism (46 mild, 26 severe), six had subclinical thyrotoxicosis, and 21 had isolated FT4/FT3 abnormalities. During ICI therapy, 51/99 (51.52%) developed ICI-induced overt thyroid dysfunction: 37 (37.37%) overt hypothyroidism and 14 (14.14%) overt thyrotoxicosis. By baseline subgroup, the incidence of overt thyroid dysfunction was 21/46 (45.65%) in mild subclinical hypothyroidism (17 overt hypothyroidism; four overt thyrotoxicosis), 17/26 (65.38%) in severe subclinical hypothyroidism (13 overt hypothyroidism; four overt thyrotoxicosis), 4/6 (66.67%) in subclinical thyrotoxicosis (two overt hypothyroidism; two overt thyrotoxicosis), and 9/21 (42.86%) in isolated FT4/FT3 abnormalities (five overt hypothyroidism; four overt thyrotoxicosis).
Compared with those who did not develop overt dysfunction, the affected patients had significantly lower baseline FT4 levels (median 12.20 [IQR, 10.25–15.71] vs. 14.14 [IQR, 11.75–17.25] pmol/L; p = 0.018) and NLR (2.60 [IQR, 1.85–3.52] vs. 3.31 [IQR, 2.37–4.33]; p = 0.049). BMI was also higher in the overt dysfunction group, although this difference did not reach statistical significance (25.22 [IQR, 21.33–26.94] vs. 22.41 [IQR, 21.19–24.69] kg/m²; p = 0.066). No other significant differences in the clinical or laboratory characteristics were observed between the two groups (Table 1).
Multivariate logistic regression analysis was conducted to identify factors associated with the development of ICI-induced overt thyroid dysfunction. In the overall cohort, none of the examined variables, including age, sex, BMI, baseline FT4 level, and NLR, were significantly associated with the outcome (Table 2). However, the subgroup analysis revealed that lower baseline FT4 levels were associated with a higher risk of developing overt hypothyroidism (adjusted OR, 0.88; 95% CI, 0.78–0.99; p = 0.037; Figure 2A).
Association between baseline FT4 levels and the risk of ICI-induced overt hypothyroidism (A) Forest plots derived from logistic regression models evaluating FT4 as a continuous and categorical variable based on a 13.91 pmol/L cutoff. Variables included in the multivariable models were selected based on a univariate p-value < 0.10 and clinical relevance, including sex, age, BMI, and NLR. (B) RCS regression analysis revealed a potential nonlinear association between baseline FT4 levels and the risk of overt hypothyroidism. The solid red line indicates the adjusted OR and the shaded area represents the 95% CI. The model was adjusted for sex, age, BMI, and NLR. Four knots were placed at specified percentiles. (C) ROC curve of baseline FT4 levels for predicting overt hypothyroidism. FT4, free thyroxin; ICI, immune checkpoint inhibitor; BMI, body mass index; NLR, neutrophil-to-lymphocyte ratio; OR, odds ratio; RCS, restricted cubic spline; CI, confidence interval; ROC, receiver operating characteristic.
Nonlinear association and predictive threshold of baseline FT4 in ICI-induced overt hypothyroidism
3.2
RCS regression was used to explore the potential nonlinear association between the baseline FT4 levels and risk of ICI-induced overt hypothyroidism. Baseline FT4 level was significantly associated with the outcome (p for overall association = 0.024); however, the test for nonlinearity did not reach statistical significance (p = 0.066), suggesting that the association may be approximately nonlinear (Figure 2B). ROC curve analysis demonstrated that baseline FT4 levels had a moderate discriminatory ability for predicting overt hypothyroidism, with an area under the ROC curve of 0.687. The optimal FT4 cutoff, determined using the maximum Youden index, was 13.91 pmol/L, corresponding to a sensitivity of 81.08% and specificity of 54.17% (Figure 2C). Subsequent logistic regression analysis using this threshold revealed that patients with baseline FT4 levels ≥13.91 pmol/L had a significantly lower risk of developing ICI-induced overt hypothyroidism than those below this threshold (adjusted OR, 0.17; 95% CI, 0.06–0.47; p = 0.001; Figure 2A).
Comparison of patients with abnormal and normal baseline thyroid function among those who developed ICI-induced overt thyroid dysfunction
3.3
Among the patients who developed ICI-induced overt thyroid dysfunction, those with sABTF (n = 51) were significantly more likely to have a history of thyroid disease than those with NBTF (35.29% vs. 11.76%; p < 0.001). Prior exposure to ICIs was also more common in the sABTF group (19.61% vs. 5.15%, p = 0.005). In addition, the incidence of overt hypothyroidism was significantly higher in the patients with sABTF than that in those with NBTF (72.55% vs. 53.68%, p = 0.020). Although the difference was not statistically significant, patients in the sABTF group showed a trend toward lower rates of smoking history (37.25% vs. 52.21%; p = 0.068) and were more likely to have received targeted therapy in combination with ICIs (35.29% vs. 19.12%; p = 0.059) (Table 3).
Logistic regression analysis was performed to identify the factors associated with sABTF- and ICI-induced overt thyroid dysfunction among the patients. A history of thyroid disease was significantly associated with increased risk of sABTF (OR, 4.09; 95% CI, 1.88–8.89; p < 0.001). Similarly, previous exposure to ICIs was associated with sABTF (OR, 4.49; 95% CI, 1.61–12.56; p = 0.004). Among the patients with sABTF, those who received ICIs in combination with targeted therapy had a significantly higher risk of developing overt thyroid dysfunction than those treated with ICIs alone (OR, 3.63; 95% CI, 1.07–12.39; p = 0.039). Additionally, among the patients who developed overt thyroid dysfunction, those who progressed to hypothyroidism were more likely to have had abnormal thyroid function at baseline than those who developed thyrotoxicosis (OR, 2.28; 95% CI, 1.13–4.60; p = 0.021) (Table 4).
Time-to-event analysis of ICI-induced overt thyroid dysfunction
3.4
We compared the time to onset of ICI-induced overt thyroid dysfunction between the patients with sABTF and those with NBTF. The median time to onset was comparable between the groups (10.00 weeks [IQR, 5.71–16.36], sABTF group; 10.07 weeks [IQR, 6.25–15.07], NBTF group). In the subgroup analyses, the median time to overt thyrotoxicosis was shorter in the patients with NBTF (6.86 weeks [IQR, 5.50–9.64]) than that in those with sABTF (10.36 weeks [IQR, 3.71–20.64]). In contrast, the median time to overt hypothyroidism was longer in the NBTF group (13.14 weeks [IQR, 10.00–18.57]) than that in the sABTF group (9.29 weeks [IQR, 5.86–15.71]). However, these differences were not statistically significant (Figure 3).
Kaplan-Meier curves of time to ICI-induced overt thyroid dysfunction. (A) Any overt thyroid dysfunction, abnormal versus normal baseline thyroid function. (B) Overt thyrotoxicosis, abnormal versus normal baseline thyroid function. (C) Overt hypothyroidism, abnormal versus normal baseline thyroid function. (D) Overt hypothyroidism, mild subclinical hypothyroidism (baseline TSH level above the reference range but <10 mIU/L) versus those with normal baseline thyroid function. (E) Overt hypothyroidism, severe subclinical hypothyroidism (baseline TSH ≥10 mIU/L) versus those with normal baseline thyroid function. (F) Overt hypothyroidism, severe subclinical hypothyroidism (baseline TSH ≥10 mIU/L) and baseline FT4 <13.91 pmol/L versus those with normal baseline thyroid function. HR, hazard ratios; CI, confidence interval; ICI, immune checkpoint inhibitor; TSH, thyroid-stimulating hormone; FT4, free thyroxine.
Among the patients with baseline subclinical hypothyroidism, 17 with mild TSH elevation (TSH above the upper limit of normal but <10 mIU/L) and 13 with severe TSH elevation (TSH ≥10 mIU/L) progressed to overt hypothyroidism during ICI therapy. Compared with patients with NBTF, those with severe subclinical hypothyroidism experienced a significantly shorter median time to overt hypothyroidism (7.78 weeks [IQR, 4.61–16.46; HR, 2.07; 95% CI, 0.97–4.41; p = 0.010]). Notably, when severe subclinical hypothyroidism was accompanied by a baseline FT4 level <13.91 pmol/L, the median time to overt hypothyroidism was even shorter with a more pronounced and statistically significant risk elevation. The median time to overt hypothyroidism was 6.57 weeks (IQR, 5.07–13.68; HR, 2.62; 95% CI, 1.07–6.41; p = 0.002). In contrast, no statistically significant difference in the time to overt hypothyroidism was observed between the patients with mild subclinical hypothyroidism and those with NBTF (Figure 3).
To further assess the impact of baseline thyroid status, a Cox proportional hazards model was used to compare the patients with severe subclinical hypothyroidism to those with NBTF. In the fully adjusted model, severe subclinical hypothyroidism remained associated with a significantly increased risk of developing overt hypothyroidism (adjusted HR, 2.84; 95% CI, 1.42–5.67; p = 0.003). The association was even more pronounced in the patients with severe subclinical hypothyroidism and concurrent FT4 <13.91 pmol/L (adjusted HR, 10.05; 95% CI, 3.13–32.23; p < 0.001) (Table 5).
Discussion
4
We conducted this retrospective cohort study to characterize the clinical course of ICI-induced overt thyroid dysfunction in a population of patients with cancer and sABTF. We found that preexisting sABTF was associated with both the risk and timing of overt thyroid dysfunction during immunotherapy. Patients with NBTF who did not develop overt dysfunction were excluded by design; therefore, this study could not estimate the incidence in the overall NBTF population. Previous studies have estimated the overall incidence of ICI-induced overt thyroid dysfunction as approximately 20% in both Western and Chinese populations (3, 4, 12). Importantly, the present study revealed that nearly half of the patients with sABTF progressed to overt thyroid dysfunction during ICI therapy, which is substantially higher than that reported in previous studies. These findings support the need for enhanced surveillance and proactive management of this patient population.
A key finding of our study is that baseline FT4 levels may serve as predictive markers for ICI-induced overt hypothyroidism, particularly in patients with pre-existing sABTF. The RCS analysis demonstrated a significant overall association between baseline FT4 levels and the risk of subsequent overt hypothyroidism, with a non-significant trend toward nonlinearity, suggesting a potential threshold effect. Consistent with this analysis, the ROC curve analysis identified an optimal FT4 cutoff of 13.91 pmol/L for risk discrimination. Supporting this observation, logistic regression analysis showed that the patients with baseline FT4 ≥13.91 pmol/L had an 83% reduction in the odds of developing overt hypothyroidism compared with that in those below the cutoff (adjusted OR, 0.17; 95% CI, 0.06–0.47; p = 0.001).
Collectively, these findings address a notable gap in the risk stratification of ICI-induced overt hypothyroidism. Previous studies have identified elevated baseline TSH as a key predictor of subsequent thyroid dysfunction in patients who are euthyroid at the initiation of ICI therapy (13–15). However, in individuals with preexisting sABTF, such as those with isolated TSH elevation or suppression, baseline TSH is already outside the reference range; therefore, this risk factor loses its predictive utility. Our results indicate that baseline FT4 serves as a more reliable biomarker for predicting the risk of overt hypothyroidism in this subset of patients. These findings have important clinical implications. Risk stratification based on baseline FT4 levels can facilitate the identification of high-risk individuals, enabling more intensive monitoring and timely intervention. Such an approach may support personalized management of thyroid function during ICI therapy.
We found that a history of thyroid disease was strongly associated with sABTF in patients who developed ICI-induced overt thyroid dysfunction. This finding is consistent with our expectations, as preexisting thyroid disorders, particularly autoimmune thyroiditis, are often characterized by chronic hormonal dysregulation or require ongoing thyroid hormone replacement therapy, both of which can result in sABTF. Mechanistically, patients with a history of thyroid disease likely enter immunotherapy with a pre-existing disruption of the hypothalamic–pituitary–thyroid axis, rendering them more susceptible to additional immune-mediated thyroid damage upon ICI exposure. This aligns with the existing evidence showing that underlying thyroid autoimmunity increases vulnerability to ICI-induced thyroid dysfunction (16, 17). In addition, prior exposure to ICIs was associated with sABTF, likely reflecting residual or irreversible thyroid injury caused by previous irAEs. Given that thyroid irAEs frequently result in permanent hypothyroidism, patients who restart ICI therapy may present with persistently abnormal thyroid profiles. Patients undergoing multiple courses of or sequential immunotherapy regimens may be particularly prone to cumulative endocrine toxicity. Collectively, these findings highlight the importance of thoroughly assessing both thyroid disease history and immunotherapy exposure before initiating a new course of ICIs. This information can inform individualized monitoring strategies, particularly for patients with the potential of preexisting thyroid injuries.
Moreover, of the patients with sABTF, those receiving ICIs in combination with targeted therapies exhibited a significantly higher risk of developing ICI-induced overt thyroid dysfunction than that in those receiving ICIs alone. These findings suggest a potential additive or synergistic effect on thyroid toxicity. Notably, many targeted agents—particularly tyrosine kinase inhibitors—are known to disrupt thyroid function (18, 19). Furthermore, previous studies have reported that combining targeted therapies with ICIs may further increase the incidence of thyroid irAEs (20). Therefore, clinicians should be vigilant of the patients with sABTF who are receiving concomitant targeted drug therapy and alert these individuals to the potential high-risk of thyroid dysfunction. Baseline screening and periodic thyroid function tests should be conducted before patients initiate ICI treatment.
From a clinical management perspective, our findings highlight the importance of comprehensive baseline thyroid function assessment, including both TSH and FT4 levels, prior to initiating ICI therapy in patients. In particular, patients with severe subclinical hypothyroidism at baseline (TSH ≥10 mIU/L) were at significantly increased risk for rapid progression to overt hypothyroidism following ICI initiation, with a median onset time of 7.78 weeks (IQR, 4.61–16.46), notably shorter than that observed in euthyroid individuals. Even after adjustment, a baseline TSH ≥10 mIU/L was associated with a greater than two-fold increase in the hazard of developing overt hypothyroidism. Furthermore, in patients with severe subclinical hypothyroidism accompanied by FT4 <13.91 pmol/L, the progression occurred even earlier, with the risk increasing up to tenfold. These findings emphasize the need for increased clinical vigilance in this subgroup, warranting frequent thyroid function monitoring to enable early detection and prompt initiation of hormone replacement therapy. Multidisciplinary management involving endocrinology specialists should be considered to optimize patient outcomes.
This study had several limitations that warrant consideration when interpreting the results. First, unmeasured confounding factors were present owing to thyroid autoimmunity. We did not systematically assess thyroid autoantibodies (e.g., anti-thyroid peroxidase and anti-thyroglobulin), which are plausibly associated with both exposure and outcome. Although major guidelines recommend pre-ICI thyroid function testing, routine autoantibody screening is not mandatory. Moreover, antibody testing is not routinely performed in our oncology practice. Consequently, we could not evaluate or adjust for this potential confounder. Second, the retrospective design led to non-standardized testing intervals, which may have introduced discrepancies between the actual onset and documented diagnosis of thyroid dysfunction. Third, the sample sizes of certain subgroups, particularly those including patients with severe subclinical hypothyroidism, were small. Finally, some patients may have initiated thyroid hormone replacement therapy before ICI therapy. Furthermore, our institution does not have an in-house endocrinology service; therefore, many patients receive thyroid care at outside facilities. As a result, treatment initiation and dose adjustments were not systematically captured in our analysis. Prospective studies with external validation cohorts are needed to confirm our findings.
In summary, this study demonstrated that preexisting sABTF significantly influences the risk and timing of ICI-induced overt hypothyroidism. Baseline FT4 emerged as a valuable predictive biomarker, with a clinically relevant threshold of 13.91 pmol/L identified for risk stratification. Severe subclinical hypothyroidism notably accelerated the onset of overt hypothyroidism. When accompanied by FT4 <13.91 pmol/L, patients not only faced a markedly higher risk but also experienced earlier onset, representing a high-priority subgroup for clinical attention. Furthermore, a history of thyroid disease and prior ICI exposure were associated with a greater likelihood of sABTF. These findings highlight the importance of obtaining a comprehensive medical history and conducting a thorough baseline thyroid function assessment, including both TSH and FT4 levels, before the initiation of ICI therapy. Future studies are warranted to validate these observations and refine monitoring protocols for early detection and timely intervention.
The reference list from the paper itself. Each links out to its DOI / PubMed record.
- 1Schneider BJ Naidoo J Santomasso BD Lacchetti C Adkins S Anadkat M . Management of immune-related adverse events in patients treated with immune checkpoint inhibitor therapy: ASCO guideline update. J Clin Oncol. (2021) 39:4073–126. doi: 10.1200/JCO.21.01440, PMID: 34724392 · doi ↗ · pubmed ↗
- 2Brahmer JR Abu-Sbeih H Ascierto PA Brufsky J Cappelli LC Cortazar FB . Society for Immunotherapy of Cancer (SITC) clinical practice guideline on immune checkpoint inhibitor-related adverse events. J Immunother Cancer. (2021) 9:e 002435. doi: 10.1136/jitc-2021-002435, PMID: 34172516 PMC 8237720 · doi ↗ · pubmed ↗
- 3Muir CA Clifton-Bligh RJ Long GV Scolyer RA Lo SN Carlino MS . Thyroid immune-related adverse events following immune checkpoint inhibitor treatment. J Clin Endocrinol Metab. (2021) 106:e 3704–13. doi: 10.1210/clinem/dgab 263, PMID: 33878162 · doi ↗ · pubmed ↗
- 4Kennedy OJ Ali N Lee R Monaghan P Adam S Cooksley T . Thyroid dysfunction after immune checkpoint inhibitors in a single-centre UK pan-cancer cohort: A retrospective study. Eur J Cancer. (2024) 202:113949. doi: 10.1016/j.ejca.2024.113949, PMID: 38432099 PMC 7618629 · doi ↗ · pubmed ↗
- 5Patel NS Oury A Daniels GA Bazhenova L Patel SP . Incidence of thyroid function test abnormalities in patients receiving immune-checkpoint inhibitors for cancer treatment. Oncologist. (2018) 23:1236–41. doi: 10.1634/theoncologist.2017-0375, PMID: 29769383 PMC 6263128 · doi ↗ · pubmed ↗
- 6von Itzstein MS Gonugunta AS Wang Y Sheffield T Lu R Ali S . Divergent prognostic effects of pre-existing and treatment-emergent thyroid dysfunction in patients treated with immune checkpoint inhibitors. Cancer Immunol Immunother. (2022) 71:2169–81. doi: 10.1007/s 00262-022-03151-2, PMID: 35072744 PMC 9308834 · doi ↗ · pubmed ↗
- 7Husebye ES Castinetti F Criseno S Curigliano G Decallonne B Fleseriu M . Endocrine-related adverse conditions in patients receiving immune checkpoint inhibition: an ESE clinical practice guideline. Eur J Endocrinol. (2022) 187:G 1–G 21. doi: 10.1530/EJE-22-0689, PMID: 36149449 PMC 9641795 · doi ↗ · pubmed ↗
- 8Haanen J Obeid M Spain L Carbonnel F Wang Y Robert C . Management of toxicities from immunotherapy: ESMO Clinical Practice Guideline for diagnosis, treatment and follow-up. Ann Oncol. (2022) 33:1217–38. doi: 10.1016/j.annonc.2022.10.001, PMID: 36270461 · doi ↗ · pubmed ↗