Unveiling stages of change among medical inpatients with an increased-risk alcohol consumption—a cross-sectional study
Maria Seferowicz, Anners Lerdal, Hilde Marie Erøy Edvardsen, Ragnhild Bergene Skråstad, Jørgen Valeur, Benedicte Marie Jørgenrud, Anna Armika Tussilago Nyman, Stig Tore Bogstrand

TL;DR
This study explores how medical inpatients with different levels of alcohol consumption are distributed across stages of change, finding that increased-risk drinkers are most likely to be actively reducing their drinking.
Contribution
The study identifies increased-risk drinkers as the largest group in the 'action' stage of change, offering insights for healthcare professionals and future research.
Findings
Distributions of stages of change differ between low, increased, and high-risk alcohol consumers.
Increased-risk consumers make up the majority in the 'action' stage, linked to reduced drinking.
SOC distribution is consistent whether measured by AUDIT-C or phospatidylethanol biomarker.
Abstract
Alcohol-related harm occurs at lower levels than previously recognized, warranting a need to identify mediators to reduce alcohol-associated risk in increased-risk drinkers. Stages of change (SOC) have been used to assess motivation for health behaviour alteration. The primary aim was to explore distribution on SOC among medical inpatients when comparing low-risk, increased-risk, and high-risk consumers as defined by Alcohol Use Disorder Identification Test-Consumption (AUDIT-C). Our secondary aim was to assess the distribution of SOC when consumption was stratified with a biomarker of alcohol use—phospatidylethanol 16:0/18:1. Cross-sectional study with three participating hospitals. Recruiting consecutive medical inpatients ≥18 years with regular alcohol consumption as screened by score ≥2 on the first question in AUDIT-C (N = 888). AUDIT-C score and SOC were assessed by…
Genes, proteins, chemicals, diseases, species, mutations and cell lines named across the full text — each resolved to its canonical identifier and authoritative record.
Click any figure to enlarge with its caption.
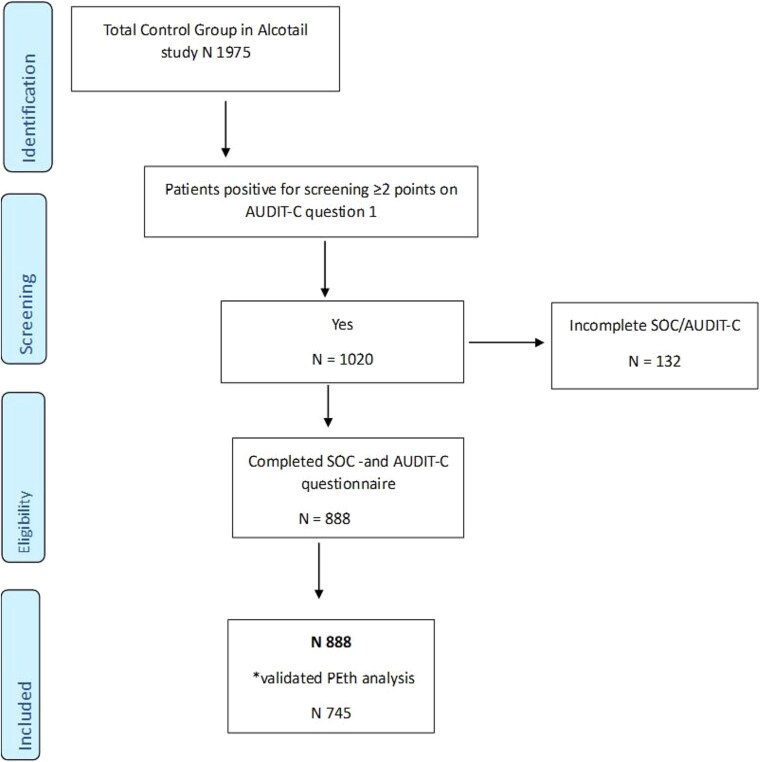 Figure 1
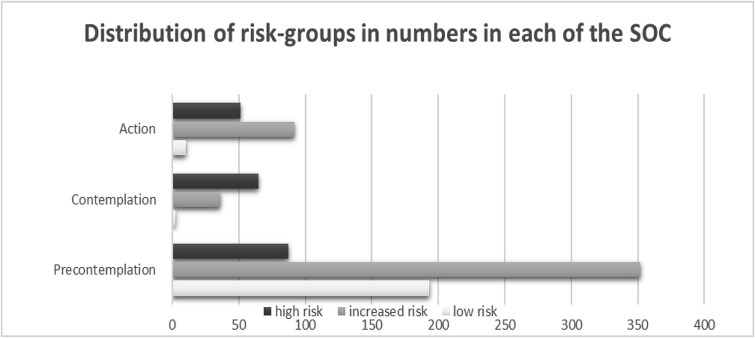 Figure 2
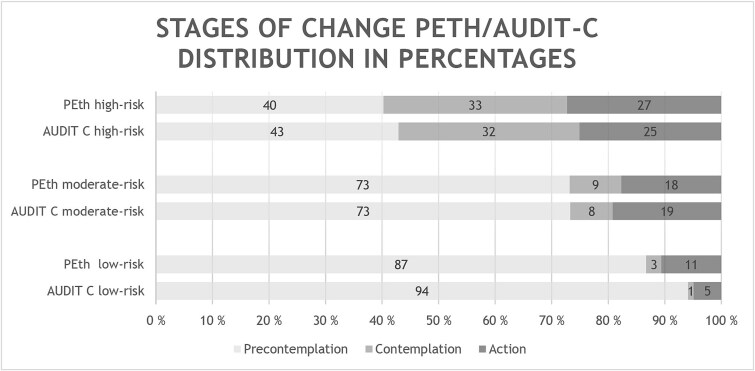 Figure 3
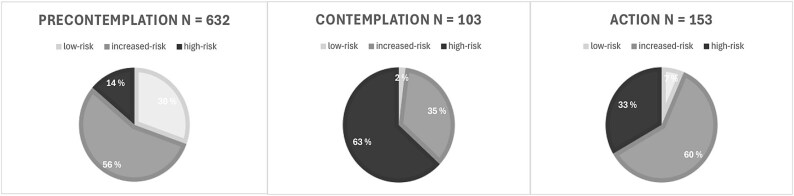 Figure 4
| AUDIT-C score women/men | Total ( | Low risk <3/<4 ( | Increased risk 3–5/4–6 ( | High risk >5/>6 ( | Missing |
|---|---|---|---|---|---|
|
| |||||
| Women | 36% (316) | 6% (51) | 22% (193) | 8% (72) | |
| Men | 64% (572) | 17% (154) | 32% (287) | 15% (131) | |
| 888 | 23% (205) | 54% (480) | 23% (203) | ||
|
| |||||
| 18–40 years | 18% (161) | 2% (14) | 10% (91) | 6% (56) | |
| 41–67 years | 37% (328) | 6% (57) | 21% (188) | 9% (83) | |
| 68–80 years | 34% (304) | 10% (89) | 18% (160) | 6% (55) | |
| >80 years | 11% (94) | 5% (45) | 5% (40) | 1% (9) | |
| 887 |
|
|
|
| |
|
| |||||
| Single/widowed | 39% (332) | 7% (59) | 20% (167) | 13% (106) | |
| Married/partner | 61% (511) | 17% (144) | 34% (288) | 9% (79) | |
| 843 |
|
|
|
| |
|
| |||||
| Retired/disabled/unemployed | 44% (366) | 7% (56) | 26% (215) | 11% (95) | |
| Employed/student | 56% (467) | 17% (139) | 28% (236) | 11% (92) | |
| 833 |
|
|
|
| |
|
| |||||
| SCL 5 ≤ 2 | 86% (760) | 22% (191) | 47% (415) | 17% (154) | |
| SCL 5 > 2 | 14% (122) | 1% (12) | 7% (62) | 5% (48) | |
| 882 |
|
|
|
| |
|
| |||||
| <0.03 μmol/l | 35% (263) | 15% (109) | 19% (140) | 2% (14) | |
| 0.03–0.299 μmol/l | 44% (328) | 6% (46) | 28% (205) | 10% (77) | |
| ≥0.3 μmol/l | 21% (154) | 1% (5) | 8% (61) | 12% (88) | |
| 745 |
|
|
|
| |
|
| |||||
| PC | 71% (632) | 22% (193) | 40% (352) | 10% (87) | |
| C | 12% (103) | 0% (2) | 4% (36) | 7% (65) | |
| A | 17% (153) | 1% (10) | 10% (92) | 6% (51) |
| Significant variables and CI-intervals AUDIT-C 3–5/4–6 increased-risk compared to AUDIT-C <3/<4 low-risk | ||||||
|---|---|---|---|---|---|---|
| Univariate analyses | Multivariate analyses | |||||
|
| ||||||
|
| OR | 95% CI |
| OR | 95% CI |
|
| Sex Male 0/Female 1 | 2.03 | 1.4–2.9 | <.001 | 2.09 | 1.38–3.16 | <.001 |
| **Occupation | 0.44 | 0.3–0.64 | <.001 | 0.86 | 0.45–1.66 | .564 |
| **Relationship status | 0.70 | 0.49–1.01 | .055 | 0.96 | 0.63–1.45 | .829 |
| **SCL-score | 2.38 | 1.25–4.52 | .008 | 1.4 | 0.69–2.85 | .356 |
| Age groups *18–40 | ||||||
| 41–67 | 0.5 | 0.3–0.96 | .037 | 0.62 | 0.30–1.28 | .199 |
| 68–80 | 0.28 | 0.15–0.51 | <.001 | 0.4 | 0.16–1.00 | .05 |
| >80 | 0.14 | 0.07–0.28 | <.001 | 0.19 | 0.07–0.53 | .001 |
| *SOC PC | ||||||
| SOC C | 9.87 | 2.35–41.4 | .002 | 9.63 | 2.2–41.8 | .003 |
| SOC A | 5.04 | 2.57–9.91 | <.001 | 4.5 | 2.16–9.4 | <.001 |
|
| ||||||
|
| ||||||
| Sex Male 0/Female 1 | 1.66 | 1.08–2.54 | .020 | 1.82 | 1.01–3.30 | .047 |
| **Occupation | 0.39 | 0.26–0.60 | <.001 | 0.98 | 0.42–2.28 | .965 |
| **Relationship status | 0.31 | 0.20–0.47 | <.001 | 0.43 | 0.24–0.76 | .004 |
| **SCL-score | 4.96 | 2.55–9.67 | <.001 | 1.40 | 0.54–3.56 | .487 |
| Age groups *18–40 | ||||||
| 41–67 | 0.36 | 0.19–0.72 | .003 | 0.55 | 0.22–1.36 | .193 |
| 68–80 | 0.15 | 0.08–0.30 | <.001 | 0.25 | 0.08–0.79 | .018 |
| >80 | 0.05 | 0.02–0.13 | <.001 | 0.07 | 0.02–0.28 | <.001 |
| *SOC PC | ||||||
| SOC C | 72.1 | 17.3–301 | <.001 | 60.5 | 13.8–270 | <.001 |
| SOC A | 11.31 | 5.49–23.3 | <.001 | 12.6 | 5.4–29.4 | <.001 |
| Significant variables associated with PEth 0.03–0.299 increased risk compared to PEth < 0.03 low risk | ||||||
|---|---|---|---|---|---|---|
| Univariate analyses | Multivariate analyses | |||||
|
| ||||||
|
| OR | 95% CI |
| OR | 95% CI |
|
| Sex Male 0/Female 1 | 0.82 | 0.59–1.15 | .252 | 0.84 | 0.59–1.19 | .326 |
| **Occupation | 0.73 | 0.52–1.02 | .064 | 1.11 | 0.61–2.02 | .729 |
| **Relationship status | 0.96 | 0.7–1.36 | .834 | |||
| **SCL-score | 0.98 | 0.59–1.61 | .926 | |||
| Age groups *18–40 | ||||||
| 41–67 | 0.98 | 0.61–1.55 | .971 | 1.07 | 0.64–1.8 | .794 |
| 68–80 | 0.79 | 0.50–1.26 | .326 | 0.93 | 0.43–1.99 | .846 |
| >80 | 0.35 | 0.19–0.64 | <.001 | 0.44 | 0.17–0.98 | .044 |
| *SOC PC | ||||||
| SOC C | 4.07 | 1.75–9.45 | .001 | 3.77 | 1.60–8.9 | .002 |
| SOC A | 1.97 | 1.21–3.2 | .006 | 1.76 | 1.04–3.0 | .037 |
|
| ||||||
|
| ||||||
| Sex Male 0/Female 1 | 0.51 | 0.33–0.78 | .002 | 0.52 | 0.31–0.88 | .016 |
| **Occupation | 1.02 | 0.67–1.55 | .918 | |||
| **Relationship status | 0.66 | 0.44–0.998 | .049 | 0.77 | 0.46–1.28 | .310 |
| **SCL-score | 2.07 | 1.22–3.52 | .007 | 1.39 | 0.69–2.8 | .361 |
| Age groups *18–40 | ||||||
| 41–67 | 1.74 | 0.95–3.17 | .071 | 2.69 | 1.24–5.83 | .013 |
| 68–80 | 1.36 | 0.74–2.5 | .321 | 2.31 | 1.04–5.83 | .039 |
| >80 | 0.31 | 0.12–0.78 | .013 | 0.57 | 0.19–1.7 | .318 |
| *SOC PC | ||||||
| SOC C | 26.27 | 11.4–60.8 | <.001 | 20.9 | 8.66–50.6 | <.001 |
| SOC A | 5.52 | 3.17–9.6 | <.001 | 5.33 | 2.89–9.9 | <.001 |
| Significant variables associated with PEth 0.03–0.299 increased risk compared to PEth < 0.03 low risk | ||||||
|---|---|---|---|---|---|---|
| AUDIT C 5 | AUDIT C 7 | |||||
|
| ||||||
|
| OR | 95% CI |
| OR | 95% CI |
|
| Sex Male 0/Female 1 | 1.62 | 1.1–2.5 | .025 | 2.41 | 1.6–3.6 | <.001 |
| **Occupation | 0.86 | 0.5–1.7 | .653 | 0.86 | 0.5–1.7 | .660 |
| **Relationship status | 0.95 | 0.6–1.5 | .833 | 0.95 | 0.6–1.4 | .815 |
| **SCL-score | 1.47 | 0.7–3 | .292 | 1.37 | 0.7–2.8 | .393 |
| Age groups *18–40 | ||||||
| 41–67 | 0.74 | 0.4–1.6 | .423 | 0.61 | 0.3–1.2 | .175 |
| 68–80 | 0.5 | 0.2–1.2 | .108 | 0.4 | 0.2–0.96 | .041 |
| >80 | 0.24 | 0.1–0.7 | .006 | 0.18 | 0.1–0.5 | <.001 |
| *SOC PC | ||||||
| SOC C | 9.3 | 2.1–41 | .003 | 10 | 2.3–43 | .002 |
| SOC A | 4.5 | 2.2–9.4 | <.001 | 4.6 | 2.2–9.6 | <.001 |
|
| ||||||
|
| ||||||
| Sex Male 0/Female 1 | 0.47 | 0.2–1.1 | .067 | 3.76 | 2.2–6.4 | <.001 |
| **Occupation | 1.08 | 0.4–2.8 | .877 | 0.97 | 0.4–2.2 | .933 |
| **Relationship status | 0.36 | 0.2–0.7 | .002 | 0.47 | 0.3–0.8 | .005 |
| **SCL-score | 1.88 | 0.54–3.56 | .216 | 1.17 | 0.5–3 | .747 |
| Age groups *18–40 | ||||||
| 41–67 | 0.74 | 0.3–2 | .558 | 0.42 | 0.2–0.99 | .046 |
| 68–80 | 0.34 | 0.1–1.2 | .1 | 0.24 | 0.08–0.7 | .009 |
| >80 | 0.1 | 0.02–0.5 | .05 | 0.04 | 0.01–0.2 | <.001 |
| *SOC PC | ||||||
| SOC C | 69.6 | 16–308 | <.001 | 63.6 | 14–292 | <.001 |
| SOC A | 11.9 | 5–28 | <.001 | 12.3 | 5.3–29 | <.001 |
- —Research Council of Norway10.13039/501100005416
Peer Reviews
No public reviews on file for this paper yet. If you reviewed it on a platform where reviews are public (OpenReview, ICLR, NeurIPS, ICML), you can paste yours below so the community can read it here.
Videos
No videos yet. Explain this paper in a talk, walkthrough, or lecture? Add one.
Taxonomy
TopicsSubstance Abuse Treatment and Outcomes · Smoking Behavior and Cessation · Alcohol Consumption and Health Effects
Introduction
Alcohol use disorders (AUD) are highly prevalent—affecting 8.6% of men and 1.6% of women worldwide (WHO 2019) with the sex gap converging in upper- and middle-income countries (Andreacchi et al. 2024). It remains among the most undertreated health conditions (Carvalho et al. 2019). There is no lowest level of safe alcohol intake (Anderson et al. 2023), and there is an increasing international recognition that even alcohol consumption within previously recommended guidelines is associated with health risks (Connor and Hall 2018, Sherk et al. 2020). AUD (APA 2022) is in the upper part of a spectrum that ranges from use of alcohol above recommended limits to alcohol dependency (Saitz 2005).
Updated guidelines advise on consumption below three drinks a week as the risk of several types of cancers increases when this threshold is exceeded, thus defining ≥3 drinks a week as increased-risk consumption (Paradis et al. 2023). Estimates indicate that up to 50% of Canadian drinkers surpassed this intake in 2023 (Stockwell and Zhao 2023). Norway is a Nordic country with about 5.5 million citizens. The average alcohol consumption of about 7.5 l of pure ethanol per year in adults is lower than most European countries (WHO 2019)—nonetheless, it has been estimated that around 40% of medical inpatients encounter levels of alcohol consumption that exceed the low-risk limit (Kabashi et al. 2019). Alcohol intake has an impact on a number of conditions that affect medical inpatients including several types of cancers, tuberculosis, lower respiratory infections, liver cirrhosis, and a wide range of cardiovascular conditions, such as hypertensive and ischaemic heart disease, stroke, conduction disorders, and other dysrhythmias (Rehm et al. 2010).
Addressing risky alcohol use in a hospital setting might be efficient as hospitalized patients may be more likely to see effects associated with their health and often have established trust with the medical staff attending them (Tezuka et al. 2024), providing a golden window of opportunity to offer advice regarding the health impacts of their alcohol consumption (Holloway et al. 2007).
Screening routines are recommended as most health care professionals have been shown to have limited ability to identify which patients have AUDs (Mitchell et al. 2012). It is reasonable to assume that this is true also for patients with increased-risk consumption. The way healthcare professionals perceive alcohol-related norms may interfere with their clinical assessment and motivation to address the potential harm in this group of patients (Tjelta et al. 2024). Conceivably due to a combination of social acceptability of consumption at increased-risk levels and a wish to ‘protect’ patients from the stigma believed to be associated with hazardous or harmful use (Grønkjær et al. 2017).
Emphasizing the need for screening is also the prevention paradox stipulating that even though the individual risk is higher in high-risk drinkers, the majority of alcohol-related problems can be attributed to the group of increased-risk drinkers as they are more numerous (Kreitman 1986). This was further highlighted in an epidemiological modelling study designed to better understand which consumers experience the highest aggregated harms from alcohol. The findings suggested that distribution of the highest alcohol harm density is between 10–30 g/day for women and 10–50 g/day for men (Sherk et al. 2024). Identifying patients that exceed the recommended lower drinking limit (i.e. increased-risk drinkers) and advising them on drink reduction may be of greater importance than previously emphasized. Particularly, as many increased-risk drinkers do not seem to have awareness of the harmful effects of alcohol on their health (Bowden et al. 2014). This forms a need for further recognition of possible mediators in this large group.
Baseline motivation to change has been highlighted as a possible mediator for reduction in alcohol consumption (Leontieva et al. 2005). The Stages of Change Questionnaire (Rollnick et al. 1992) is based on the Transtheoretical Model by DiClemente & Prochaska. Higher baseline stages of change (SOC)-scores may have predicative value regarding consumption and alcohol-related outcomes (Heather et al. 1993). Although subjected to criticism (West 2005), there is a large scope of research with regards to SOC/readiness to change (RTC) and alcohol consumption in different patient populations; college students (Merrill et al. 2015), army recruits (Gaume et al. 2013), patients in the emergency department (Field et al. 2020), general public (Baumann et al. 2015), medical outpatients (Matwin and Chang 2011), and medical inpatients (Bertholet et al. 2009b). Despite recognized weaknesses, SOC have been commonly used to assess motivation to change drinking behaviour (Tan et al. 2023), and although different models are in development they are not yet well established internationally (Richards 2023).
Past research assessing SOC/RTC has used cut-offs of ≥8 for Alcohol Use Disorder Identification Test (AUDIT) (Bertholet et al. 2009a, Reed et al. 2019, Field et al. 2020). Increased-risk consumers in this study are likely to fall below these previous cut-off limits, as they are defined by an Alcohol Use Disorder Identification Test Consumption (AUDIT-C) score of 3–5 for women and 4–6 for men. Reasonably many will not reach a total AUDIT score of ≥8, as they are less probable to get high scores in the second part of the Alcohol Use Disorder Identification Test—Problematic use.
The primary aim of this study was to investigate research gaps in the group of increased-risk alcohol consumers and explore how SOC were distributed among patients denoted as low, increased, and high-risk defined by AUDIT-C score. The hypothesis was that those with increased-risk consumption would likely be in the middle between the two other groups of low-risk and high-risk. Nevertheless, as the public has limited knowledge about the hazards associated with increased-risk consumption (Bates et al. 2018), a result close to those in low-risk was our alternative hypothesis.
As both the SOC and the AUDIT-C are based on self-report, the potential for social desirability bias is increased. Hence, we pursued the opportunity to include a secondary aim and explored the association between SOC and risk-levels when consumption was stratified by phospatidylethanol 16:0/18:1 (PEth), an objective and validated ethanol biomarker, as compared to self-reported alcohol use. To acknowledge the bidirectional relationship between increased alcohol consumption and mental distress (Tyssen et al. 1998, Hassan 2017), we included Symptom checklist-5 (SCL-5)-score as a variable to exclude potential bias related to mental health.
Materials and Methods
Design, participants, and setting
This was a cross-sectional study designed to explore SOC in medical inpatients with regular alcohol consumption. The study was reported in accordance with the 22-item checklist for Strengthening the Reporting of Observational Studies in Epidemiology - the STROBE-guidelines for cross-sectional studies. Participants were recruited from the standard of care group (SC) in the larger multicentre AlcoTail study. AlcoTail was a longitudinal, experimental, pre-post-test, register-based study on the effects of screening and tailored intervention of harmful alcohol use among hospitalized medical patients in Norway. It contained a control group of 2000 patients (included 2021–2023) that received SC prior to the intervention and a comparison population of 2000 patients (included 2022–2025) after the intervention was established.
Recruitment and data collection for the SC were conducted at three hospitals:
(i) St Olavs hospital Trondheim University Hospital STO in Trondheim, Norway’s third largest city with an average of 12,000 acute medical inpatient admissions a year. Recruitment time between February and September 2022.(ii) Oslo University Ullevål hospital OUS—in Oslo, the capital of Norway, with an average of 12,000 acute medical inpatient admissions a year. Recruitment time September–November 2021.(iii) Lovisenberg Diaconal hospital LDS—a district general inner-city hospital with an average of 6000 acute medical inpatient admissions per year. Recruitment time between October 2022 and April 2023.
To be included in the parent study (AlcoTail), patients had to be admitted to a medical ward in one of the partaking hospitals. Participants were recruited consecutively by dedicated study staff. Additional inclusion criteria were ≥18 years of age and ability to speak and read Norwegian to fully understand and be capable to sign the informed consent. Attending staff were consulted about any potential cognitive impairments and the patient’s ability to participate in the study before inclusion, and patients who were confused or in delirium were not approached. Participants were able to withdraw from the study at any point without restriction. Apart from AUDIT-C/AUDIT, no priming questions that potentially influenced SOC-score were part of the parent study.
To be identified for this study, participants had to be enrolled in SC in the Alco-Tail study. The participants were screened with regards to regular alcohol consumption and included if they had a score of ≥2 on the first AUDIT-C question. To be included, participants also had to fully complete the AUDIT-C and SOC-questionnaires as illustrated in Fig. 1.
Prisma flow chart over patient number on identification, screening, eligibility, and final number of included patients in our study
This study was reviewed and approved by The Regional Committee for Ethics in Medical Research, South-Eastern Norway (REC# 200/31052) and authorized by the data protection officers at the three hospitals.
Outcomes, measures, and data sources
Patients who consented to participation in the study completed a package of validated electronic questionnaires measuring alcohol consumption (AUDIT-C), SOC, and mental distress status (SCL-5). Designation to one of the three SOC was the primary outcome. A left-over blood sample was obtained from routine diagnostics drawn at the day of admission and was used to measure ethanol and the alcohol biomarker (PEth) which was applied to assess our secondary outcome.
Questionnaires
Alcohol Use Disorder Identification Test-Consumption
AUDIT-C was developed as a time-efficient screening to identify hazardous drinking habits in patients who have not yet experienced adverse effects from their alcohol consumption(Bush et al. 1998). It is an abbreviated version of the full AUDIT and restricted to the first three questions about alcohol consumption. In this study, we adjusted for sex when assessing question three about heavy episode drinking (HED) >3/4 drinks per episode in women/men. Each item was answered on a five-point scale (zero to four points) with a total score (range zero to 12 points) designating the risk level.
Traditionally, AUDIT-C scores have been dichotomized to discriminate between presence and absence of at-risk drink behaviour. However, it is becoming more common to identify subgroups within the threshold of unhealthy alcohol used both in a clinical (Subhani et al. 2024) and research aspect (Ryan et al. 2022, Jack et al. 2025). For the purpose of this study, we derived three drinking risk-levels and participants were designated to either low, increased, or high-risk according to the total AUDIT-C score. We did not include the frequency of HED as an additional criterion to define the level of risk drinking. The cut-off scores were sex-specific as women often tend to develop medical alcohol-related disease at lower thresholds of consumption than men (Fernández-Solà and Nicolás-Arfelis 2002). Women with a total AUDIT-C score ≤2 and men with a score of ≤3 were assigned to the low-risk group (Reinert and Allen 2007). Scores 3–5 for women and 4–6 for men constituted the increased-risk group (Wood et al. 2024, Krist and Bradley 2025), as AUDIT-C scores between 7 and 12 are associated with high-risk drinking (Rubinsky et al. 2013). We therefore decided on the high-risk drinking cut-off for men ≥7 and adjusted the cut-off for high-risk to ≥6 for women after performing sensitivity analyses (Table 4) with cut-off ≥7 and ≥5.
Stages of change
SOC-stage was determined by the Stages of Change Questionnaire—designed for brief opportunistic assessments in medical setting (Rollnick et al. 1992). It consists of 12 questions with three four-item subscales assessing the patient’s beliefs about their current alcohol use and scoring them appropriately. We used a Norwegian translation of the questionnaires which gave points accordingly to the answer; disagree −1, unsure 0, or agree 1. Participants were assigned according to the quick method for allocation to the stage, with the highest score among the subscales represented the designated stage of change for the participant. SOC-stage as classified into precontemplation (PC), contemplation (C), and action (A). In case of equal scores, participants were manually allocated to the stage further along the continuum of change in accordance with the manual.
Symptom checklist-5
SCL-5 is a short-form screening tool validated for identifying and stratifying anxiety (two questions) and depression (three questions). The score is dichotomized with values >2 being an indicator of mental distress (Strand et al. 2003).
Alcohol biomarkers
Phospatidylethanol 16:0/18:1
PEth is a specific biomarker for alcohol that reflects alcohol consumption over a period of 2–4 weeks before sampling. It is only formed in the presence of ethanol providing a high degree of specificity. PEth was analysed with validated ultra-performance liquid chromatography tandem mass spectrometry (UHPLC®-MSMS) methods at OUS and STO. Calibration range of the method was 0.030–4.00 μmol/l at both laboratories (Andreassen et al. 2018).
PEth concentrations below 0.03 μmol/l (20 ng/ml) are compatible with abstinence or low-risk alcohol consumption. Concentrations higher than 0.3 μmol/l (200 ng/ml) are strongly suggestive of frequent excessive alcohol (i.e. high-risk) consumption, whereas concentrations between 0.03 and 0.3 μmol/l are indicating (i.e. increased-risk) alcohol consumption (Luginbühl et al. 2022).
Demographic data
Demographic data were gathered from the patient record by dedicated research staff and included age (recorded into four groups; 18–40, 41–68, 68–80, >80 years), partnership status (single/widowed or married/living with partner), and employment status (student/employed or retired/disability benefits/unemployed).
Data analysis strategy
Statistical analyses were performed using SPSS 29.00 (IBN Corp, Armonk, NY, USA). The sample size for this study was derived from the AlcoTail control group, where sample size was calculated based on the findings from a previous pilot study (Kabashi et al. 2019).
Categorical variables were presented as numbers and percentages. To assess the normality of age as a continuous variable, we used the Kolmogorov–Smirnov test and reported the results as mean (SD). Independent sample t-test was performed to compare continuous variable (i.e. age), categorical data were compared with the Pearsons’s Chi-Square test. In case of missing data, the analysis was conducted with an adjusted number (n). Odds ratios (OR) and the 95% confidence intervals (CI) were calculated through a univariate logistic regression analysis for each of the variables as compared to AUDIT-C risk group (low-risk to increased-risk/low-risk to high-risk) and PEth risk group (low-risk to increased-risk/low-risk to high-risk). Multivariable logistic regression models were then fit to calculate the adjusted ORs and 95% CI. P-values below .05 were considered significant.
Results
Study sample
The AlcoTail control group had a total sample of 1975 patients from the three study sites (STO 497, OUS 981, and LDS 497 patients). A total of 1020 (52%) patients/participants had a score ≥2 on the first question in AUDIT-C. Eight hundred eighty-eight of these had completed the SOC and the full AUDIT-C questionnaire and were eligible for this study (Fig. 1).One hundred twenty-five patients were excluded due to incomplete SOC-questionnaire. The 125 patients had no differences in sex and PEth/AUDIT-C distribution. The only significant difference was in age-groups with more participants >68 years in the missing group. The 888 patients included in our study were slightly younger and with a higher number of male participants when compared to the total sample population—these findings are comparable to other populations of alcohol consumers (Abebe et al. 2021). The mean age was 60.98 (SD 18.49) years in the study population and 65.12 (SD 18.58) years in the total sample with a two-sided P < .001. Male participants constituted 64% in our study population compared to 56% in the total sample population P < .001. Table 1 provides descriptive information of the sample as categorized by AUDIT-C score for the included participants.
Stages of change distribution within risk-groups as assessed by AUDIT-C and PEth
When assessed by AUDIT-C, 71% of the total study population were assigned to PC. The distribution varied between the three risk groups with 94% of the low-risk, 73% of the increased-risk, and 43% of the high-risk consumers in this stage. The distribution in C was quite different with 12% of the total study population in this stage, and the three risk groups distributed with <1% of the low-risk, 8% of the increased-risk, and high-risk 32%. Finally, A constituted for 17% of the total population 5% of the low-risk, 19% of the increased-risk, and 25% of high-risk consumers (Fig. 2 illustrating the distribution in numbers). The distribution was similar whether the risk assessment was done by self-reported screening or by the concentration of PEth (Fig. 3).
The distribution in numbers of participants in the three risk-groups low risk in light, increased risk in medium, and high risk in dark grey between the three SOC; PC, C, and A
Comparing distribution of the three stages of change; PC—light, C- medium, and A- dark grey in percentages when comparing low, moderate, and high-risk consumption when stratified by self-reported questionnaire (AUDIT-C) on the inferior bar and when the consumption was stratified according to an objective and validated biomarker of alcohol use—PEth 16:0/18:1 on the superior bar
Distribution of the three risk groups within each of the SOC
The group apportioned to the increased-risk consumers was twofold the size in numbers when compared to both the group of low-risk and high-risk consumers and constituted 54% of the total study population.
The increased-risk consumers were in majority of the patients in PC 56%, and even more so in A 60%. The high-risk drinkers were in majority in C (Fig. 4).
Pie-chart distribution percentage of low-risk (light grey), increased-risk (medium grey), and high-risk (dark grey) in the three stages of change; PC (n 632) C (n 103), and A (n 153)
Primary outcome analysis
When consumption level was determined using AUDIT-C, the multivariable logistic regression analyses (Table 2) showed that the distributions of SOC stages were significantly different both for the increased-risk consumers (C OR = 9.63; CI = 2.2–42, P = .003 and A OR = 4.5; CI = 2.16–9.4, P < .001) and high-risk consumers (C OR = 60.5; CI = 13.8–270, P < .001 and A OR = 12.6; CI = 5.4–29, P < .001) when compared to the low-risk consumers.
Secondary outcome analysis
When risk-level of consumption was determined by use of an alcohol biomarker in the blood; PEth (Table 3), we found that the distribution of SOC stages was comparable to the self-reported classifications with significant differences both the increased-risk consumers (C OR = 3.77; CI = 1.6–8.9, P = .002 and A OR = 1.76; CI = 1–3, P = .037) and high-risk consumers (C OR = 20.9; CI = 8.7–51, P < .001 and A OR = 5.33; CI = 2.9–10, P < .001) when compared to the low-risk consumers.
Discussion
This study showed that there were significant differences in SOC-allocation among medical inpatients when classified into three groups of low, increased, or high-risk alcohol intake both by AUDIT-C and PEth. The distribution was similar to previous studies on non-treatment seeking medical patients with a majority in PC (Matwin and Chang 2011) and the SOC/RTC increasing with higher alcohol use severity.
Being classified into either of the two later stages (C, A) indicates that the patient could be considering or engaging in a change in behaviour (Heather et al. 1993). More recent studies have implied that only A tends to be associated with a positive result on succeeding with consecutive reduction in alcohol consumption in patient populations both with and without intervention (follow-up time 3–12 months) (Reed et al. 2005, Bertholet et al. 2009a, Gaume et al. 2013, Field et al. 2020). Our findings indicate the highest fraction in A are those with increased-risk consumption. They make for 54% of the total population, but in A they are in majority with 60% and approx. one of five increased-risk consumers is in the action stage. This new knowledge could be of impact on previously perceived barriers for health professionals with regards to offering health advice on alcohol to this group of consumers (Grønkjær et al. 2017, Tjelta et al. 2024). With findings suggesting that a lot of the aggregated health harm is experienced within the increased-risk range (Sherk et al. 2024) health promotion through offering patients personalized feedback about their risk may effectuate on an individual level with the prospect of risk reduction in diseases like cancer (Esser et al. 2024). Further gains could potentiate on a population level when the theory of collectivity on drinking (Skog and Rossow 2006) is related for, as an reduction in alcohol use among the large population of increased-risk consumers may lead to a prospective decline in alcohol intake also among those with high-risk consumption.
As earlier research on mediator effects in SOC has been conducted in patients with a hazardous (AUDIT ≥8) alcohol consumption (Reed et al. 2005, Bertholet et al. 2009a), we do not yet know the predicative value of SOC in the subgroup of increased-risk consumers. Alcohol use severity is often proposed as a potential moderator for whether SOC mediate alcohol reduction and individuals with less severe drinking habits are thought to be more prone to respond to brief interventions (Moyer et al. 2002). This informs further research to address knowledge gaps with regards to effects of screening and potential intervention in the increased-risk subpopulation.
Past research has found moderate to high correlations between the PEth value and AUDIT-C-scores (Jørgenrud et al. 2021, Verheij et al. 2022). To our knowledge, all previous SOC/RTC-studies have used self-report measures of alcohol consumption, while this study also included stratification of alcohol consumption by PEth. With regards to the secondary aim of our study, our findings exhibited similar distribution of the baseline RTC stages within the three risk groups when assessed by AUDIT-C questionnaire and compared to three risk groups as defined by levels of the PEth-biomarker.
While different assessment of alcohol risk-levels are becoming more common, the cut-offs both for AUDIT-C and PEth to differentiate between the groups of increased-risk and high-risk consumers are still not well established. Though not designed with this purpose—the findings of homogeneity within the groups as well as the heterogenicity between the three groups might be a support for the AUDIT-C cut-offs used in this study. As it becomes more apparent that considerable health hazards emerge already with a consumption ≥3 units per week, there will probably be a need to address risks at lower PEth-values than previously identified. Possibly, advice could be offered when PEth exceeds 0.03 μmol/l with regards to risk related to cancer and cardiovascular diseases (Hahn et al. 2023), and the results in our study identify a difference in motivation to change below and above this threshold.
Limitations
This study included 888 medical inpatients with a wide age range across three hospital sites in Norway, thereby providing ample statistical power, reducing potential bias, and increasing generalizability of the findings. Our study sample should be representative for Norwegian residents, but the inclusion criteria yielded recruitment bias as patients with insufficient understanding of the Norwegian language were excluded. This is a limitation, and supplementary research is necessitated to determine whether our results are reproducible internationally. An additional limitation was that the 132 patients who were excluded from the study due to deficient questionnaire completion (7 patients Audit-C/125 patients SOC) - could generate a potential selection bias towards participants with higher levels of motivation. A modified measure of the SOC-questionnaire with a three-point likert scale (as compared to the original five-point scale) was chosen to reduce the burden of assessment, but became a limitation when comparing the results to other studies and assessing a continuous SOC-score. Further, use of the quick method to allocate SOC does not acknowledge that the stages are not mutually exclusive and is also a limitation in this study. However, for the purpose of assessing the prevalence of SOC in this sample, it is probably sufficient (Forsberg et al. 2004). Nonetheless, a single assessment of SOC will not be able to capture the complex process needed to implement change in alcohol consumption and constitutes a limitation when interpreting the implications of the findings.
Conclusion
Our results found differences in the distribution of SOC between low, increased, and high-risk alcohol consumers. This observation was equivalent both when alcohol consumption was assessed with a self-report AUDIT-C questionnaire and with the ethanol biomarker PEth. Action stage has been associated with a consecutive reduced drinking pattern, and our study found that the increased-risk drinkers made up the majority in this stage. There are some limitations to this finding, as it remains to assess the mediator effect of SOC in the group of increased-risk drinkers. Nonetheless, the results can have implications for the perceived barriers among health professionals in screening to identify and offer health advice to raise awareness of potential health hazards caused by alcohol in this large group of consumers. We therefore believe our findings to lend further support to the endeavour of targeting prevention strategies on entire populations. Potential impacts can manifest on an individual level with risk reduction for diseases like cancer and cardiovascular disease, as well as on a population level. However, to assess the efficacy of such approach, further research with interventional studies in increased-risk alcohol consumers is required.
Supplementary Material
STROBE_checklist_article_SOC_increased_risk_drinkers_agaf067
The reference list from the paper itself. Each links out to its DOI / PubMed record.
- 1Abebe DS, Lien L, Bramness JG. Effects of age and gender on the relationship between alcohol use disorder and somatic diseases: a national register study in Norway. BMJ Open. 2021;11:e 050608. 10.1136/bmjopen-2021-050608 · doi ↗
- 2Anderson BO, Berdzuli N, Ilbawi A. et al. Health and cancer risks associated with low levels of alcohol consumption. Lancet Public Health. 2023;8:e 6–7. 10.1016/S 2468-2667(22)00317-636603913 PMC 9831798 · doi ↗ · pubmed ↗
- 3Andreacchi AT, Hobin E, Siddiqi A. et al. Age, period and cohort effects of heavy episodic drinking by sex/gender and socioeconomic position in Canada, 2000–2021. Addiction. 2024;119:2162–73. 10.1111/add.1664139228260 · doi ↗ · pubmed ↗
- 4Andreassen TN, Havnen H, Spigset O. et al. High throughput UPLC®-MSMS method for the analysis of phosphatidylethanol (P Eth) 16:0/18:1, a specific biomarker for alcohol consumption, in whole blood. J Anal Toxicol. 2018;42:33–41. 10.1093/jat/bkx 07528977407 · doi ↗ · pubmed ↗
- 5APA . Desk Reference to the Diagnostic Criteria from DSM-5-TR [TM]. 2022 Amer Psychiatric Pub Inc.
- 6Bates S, Holmes J, Gavens L. et al. Awareness of alcohol as a risk factor for cancer is associated with public support for alcohol policies. BMC Public Health. 2018;18:688. 10.1186/s 12889-018-5581-829866082 PMC 5987582 · doi ↗ · pubmed ↗
- 7Baumann S, Gaertner B, Schnuerer I. et al. The impact of a stage tailored intervention on alcohol use trajectories among those who do not intend to change. Drug Alcohol Depend. 2015;147:167–74. 10.1016/j.drugalcdep.2014.11.02025500129 · doi ↗ · pubmed ↗
- 8Bertholet N, Cheng DM, Palfai TP. et al. Does readiness to change predict subsequent alcohol consumption in medical inpatients with unhealthy alcohol use? Addict Behav. 2009 a;34:636–40. 10.1016/j.addbeh.2009.03.03419428189 PMC 2789443 · doi ↗ · pubmed ↗