Illuminating the FGFR fusion landscape in Chinese patients: unveiling novel molecular insights and clinical implications
Zhuo Liu, Dandan Zhao, Baoming Wang, Zhenyuan Qian, Zhengchuang Liu, Qiong Yang, Jinhua Tao, Yanxi Shao, Min Lv, Yanxiang Zhang, Jianhua Zhu, Jie Zhang, Wei Li, Xiaojuan Wang, Chunyang Wang, Tonghui Ma, Yuping Zhu

TL;DR
This study explores FGFR gene fusions in Chinese cancer patients, revealing new patterns and the importance of RNA testing for accurate detection and treatment guidance.
Contribution
The study provides the first comprehensive profiling of FGFR fusions in a large Chinese cohort and identifies novel breakpoint hotspots and fusion mechanisms.
Findings
FGFR fusions occurred at 0.96% incidence in the Chinese cohort, with a notable 40% rate in parotid gland carcinoma.
Distinct breakpoint patterns were identified, including hotspots in FGFR1 intron17 and FGFR3's 3’ untranslated region.
RNA validation is critical as 46% of rare FGFR fusions lacked detectable RNA transcripts, highlighting the need for orthogonal methods.
Abstract
Despite the increasing approval and ongoing clinical trials of FGFR-targeted therapies, accurately detecting FGFR fusions remains a challenge due to limited research, low incidence rates, complex fusion partner distribution, and unique kinase domain distribution. We conducted a multicenter study to comprehensively profile FGFR fusions in the largest Chinese pan-cancer cohort to date, comprising 118 FGFR fusions from 114 individuals. Both DNA- and RNA-based sequencing approaches were utilized to reveal novel and fundamental features of FGFR fusion. Our research reveals an incidence rate of 0.96% for FGFR rearrangements within this Chinese cohort, including a high incidence rate of FGFR fusions (40%) in parotid gland carcinoma. However, this is based on a small sample size of 5 tumors and should be interpreted cautiously pending validation in larger cohorts. We also uncovered distinct…
Genes, proteins, chemicals, diseases, species, mutations and cell lines named across the full text — each resolved to its canonical identifier and authoritative record.
Click any figure to enlarge with its caption.
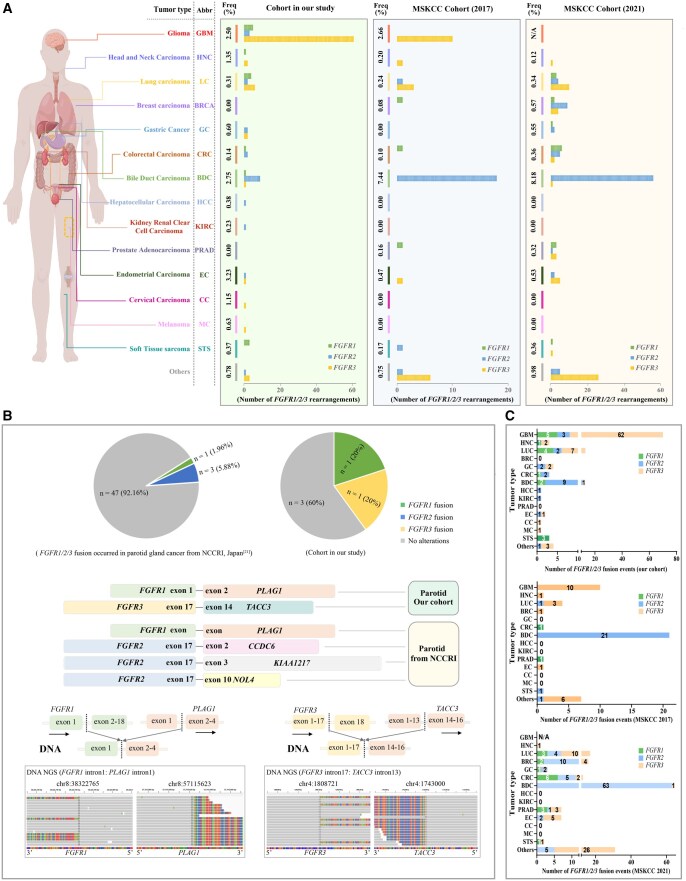 Figure 1
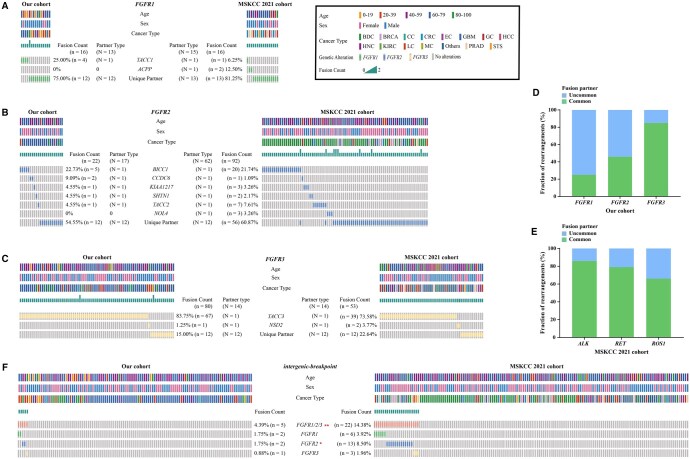 Figure 2
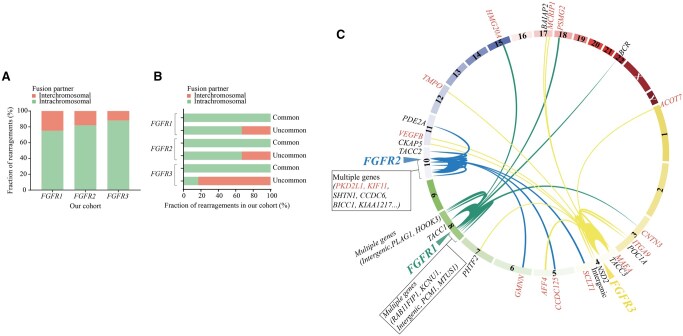 Figure 3
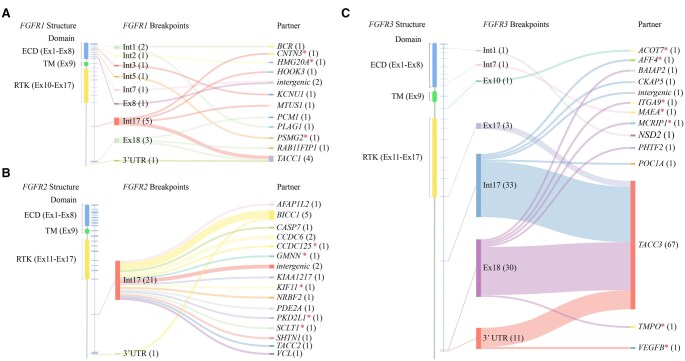 Figure 4
| Patient (ID) | Rare fusion type | Cancer type | DNA-NGS data | RNA-NGS data | ||||
|---|---|---|---|---|---|---|---|---|
| Fusions | Breakpoints | In-frame/Out-frame | Intact fusion domain | Fusions | Breakpoints | |||
| Case 9 | Intergenic-breakpoint fusions | LC |
|
| N/A | Yes | Negative | Negative |
| Case 10 | LC |
|
| N/A | Yes | Negative | Negative | |
| Case 19 | GC |
| Int17: | N/A | Yes | N/A | N/A | |
| Case 20 | LC |
| Int17: | N/A | Yes |
| E17: E10 | |
| Case 40 | MC |
| Int17: | N/A | Yes |
| E17: E2 | |
| Case 3 | Novel fusions | LC |
| Int2: Int3 | out-frame | No | Negative | Negative |
| Case 7 | STS |
| Int5: Int2 | out-frame | No | Negative | Negative | |
| Case 37 | GBM |
| E10: Int7 | exon-intron | No | Negative | Negative | |
| Case 46 | LC |
| 3'UTR: E5 | 3'UTR-exon | Yes | Negative | Negative | |
| Case 25 | BDC |
| Int17: Int2 | in-frame | Yes |
| E17: E3 | |
| Case 21 | GBM |
| Int17: Int8 | in-frame | Yes |
| E17: E9 | |
| Case 38 | GBM |
| Int17: Int11 | in-frame | Yes |
| E17: E12 | |
| Case 41 | STS |
| E18: Int27 | exon-intron | Yes |
| E17: E28 | |
| Case 45 | GBM |
| E18: Int1 | exon-intron | Yes |
| E17: E2 | |
| Case 2 | BDC |
| Int3: Int17 | in-frame | No | N/A | N/A | |
| Case 17 | BDC |
| Int17: Int5 | in-frame | Yes | N/A | N/A | |
| Case 18 | KIRC |
| Int17: Int2 | in-frame | Yes | N/A | N/A | |
| Case 24 | PAAD |
| Int17: Int12 | in-frame | Yes | N/A | N/A | |
| Case 47 | LC |
| Int5: Int7 | out-frame | Yes | N/A | N/A | |
| Case 42 | GBM |
| E18: Int1 | exon-intron | Yes | N/A | N/A | |
- —Zhejiang Chinese Medical Science and Technology Foundation
- —Zhejiang Medical and Health Technology Project
- —Natural Science Foundation of Zhejiang Province10.13039/501100004731
Peer Reviews
No public reviews on file for this paper yet. If you reviewed it on a platform where reviews are public (OpenReview, ICLR, NeurIPS, ICML), you can paste yours below so the community can read it here.
Videos
No videos yet. Explain this paper in a talk, walkthrough, or lecture? Add one.
Taxonomy
TopicsFibroblast Growth Factor Research · Kruppel-like factors research · Eosinophilic Disorders and Syndromes
Introduction
The fibroblast growth factor receptor (FGFR) tyrosine kinase gene family has attracted considerable attention as a valuable target in cancer therapy.1–3 Specifically, U.S. Food and Drug Administration (FDA)-approved targeted therapies such as erdafitinib, pemigatinib, and infigratinib are employed for treating patients with FGFR genetic alterations in bladder cancer or cholangiocarcinoma.4–6 However, the accurate diagnosis of oncogenic FGFR rearrangements—a significant type of FGFR gene alteration—remains challenging due to their low frequency, complex distribution of fusion partners, and limited research.7–13
Previous studies, constrained by sample size and cancer type diversity, have reported inconsistent FGFR fusion distributions within the same tumor types across different cohorts.7–10 This inconsistency could be due to biases stemming from restricted sample sizes in unique cohorts. For example, FGFR fusions were absent in cervical cancer and melanoma in the Memorial Sloan Kettering Cancer Center (MSKCC) cohorts, in contrast to a Chinese cohort that reported FGFR fusions in over 10% of these cases. Conversely, the MSKCC cohorts showed a higher incidence of FGFR fusions in colorectal cancer, endometrial cancer, and glioma.7^,^8
Drawing on our experience in characterizing oncogenic gene fusions such as ALK, ROS1, RET, and MET,9–17 which have highlighted the complexity and challenges of fusion detection, we recognized that similar issues exist for FGFR fusions. Unlike widely researched fusions where the kinase region is typically located at the 3’ end, FGFR fusions may have their kinase region at either the 3’ or 5’ end. This peculiarity may result in FGFR fusions displaying characteristics markedly different from other fusions such as ALK, ROS1, and RET. However, the fundamental profiles of FGFR fusions, such as breakpoint distribution or fusion partner characteristics, remain poorly understood. Moreover, there is a lack of studies on the differences in FGFR fusion detection at the DNA and RNA levels. These research gaps could greatly significantly FGFR accuracy of detection and the efficacy of FGFR inhibitors.
In this study, we conducted a multicenter investigation of the molecular profiling of FGFR fusions in the largest Chinese pan-cancer cohort to date, integrating both DNA- and RNA-based sequencing. Our findings provide vital insights into functional FGFR fusions and hold significant clinical implications for identifying patients whose tumors are most likely to respond favorably to FGFR-targeted therapies.
Materials and methods
Patients and samples
Tumor samples from patients with pan-solid tumors, including glioma (GBM), head and neck carcinoma (HNC), lung carcinoma (LC), breast carcinoma (BRCA), gastric cancer (GC), colorectal carcinoma (CRC), bile duct carcinoma (BDC), hepatocellular carcinoma (HCC), kidney renal clear cell carcinoma (KIRC), prostate adenocarcinoma (PRAD), endometrial carcinoma (EC), cervical carcinoma (CC), melanoma (MC), soft tissue sarcoma (STS), and other cancer types, were collected between December 2018 and August 2022 for NGS-based FGFR fusion detection. Fresh tissue specimens were treated with RNAlater solution (Thermo Fisher Scientific) and cryopreserved at −80 °C or processed into formalin-fixed paraffin-embedded (FFPE) blocks, stored at 4 °C. FFPE blocks were prepared following previously described methods for nucleic acid recovery from FFPE tissue.18 The research was approved by the Ethics Committee of Zhejiang Provincial People’s Hospital (QT2022411) and adhered to the Helsinki Declaration.
DNA sequencing
Genomic DNA was extracted from FFPE samples or frozen tissues, fragmented (150-200 base pairs), and analyzed using an 825-gene panel (Onco PanScan) targeting crucial tumor-related genes, as described in previous study.17 Quality control measures included removal of adapters and low-quality regions (Trimmomatic v0.36), aligning reads to the hg19 genome (Burrows-Wheeler Aligner v0.7.10), and assessing structural variations (GeneFuse v0.6.1, https://github.com/OpenGene/GeneFuse). Variants with a population frequency >0.1% were excluded based on Exome Aggregation Consortium guidelines, and the remaining variants were annotated using Oncotator and Variant Effect Predictor. FGFR fusion partners were classified based on their occurrence across 3 cohorts (our cohort, MSKCC 2021 and MSKCC 2017 cohorts), with those appearing in ≥ 3 samples designated as common, and those in 1-2 samples as uncommon.
RNA sequencing
A 395-gene RNA panel (Fusioncapture) was utilized to detect FGFR fusions at the transcript level. Total RNA with RNA integrity DV200 ≥ 30% was reverse-transcribed into complementary DNA (cDNA), which was then sequenced on the Illumina NovaSeq 6000 platform. Reads were mapped to the human reference genome (hg19) using Hisat2-2.0.5,19 and gene fusions were identified with FusionMap.20
Fluorescence in situ hybridization (FISH) and sanger sequencing
FISH and Sanger sequencing were used to validate novel fusions identified by the Onco PanScan and Fusioncapture panels. FISH was performed on FFPE sections using gene-specific probes, with 200 nuclei per probe analyzed. Sanger sequencing involved cDNA generated from 2.5 μg of total RNA, and fusion-specific primers were used for the polymerase chain reaction (PCR) amplification process. Reference sequences for fusion gene transcripts were obtained from the National Center for Biotechnology Information Reference Sequence Database. PCR products were purified and sequenced, with fusion sequences aligned with those detected by the Fusioncapture panel.
Statistical analysis
Statistical analyses were conducted using Fisher’s exact test, chi-square test (with or without correction) in GraphPad Prism software (v8.0.1), with significance was set at P < .05.
Results
Prevalence of FGFR fusions in solid tumors
In our pan-solid tumor cohort of 11,898 patients, a total of 118 FGFR fusions were identified in 114 patients, including 16 FGFR1 fusions (15 patients), 22 FGFR2 fusions (22 patients), and 80 FGFR3 fusions (78 patients), achieving an overall incidence rate of 0.96% (114/11,898) for cases with FGFR fusions-positive among all screened samples (Figure 1A and Table S1). The majority were found in GBM (60.53%, 69/114), LC (10.53%, 12/114), BDC (9.65%, 11/114) and GC (3.51%, 4/114). Notably, FGFR fusions prevalence in endometrial cancer was significantly higher than in the MSKCC cohorts (3.23% vs 0.53%; P = .0101), highlighting the potential clinical relevance and indicating a larger proportion of Chinese patients with EC whose tumors could potentially be candidates for FGFR-targeted therapies. Besides that, FGFR fusions not reported in the MSKCC cohorts were also identified in HCC, KIRC, CC, and MC, possibly due to population-specific differences. Formal statistical comparisons, however, were limited to tumor types with sufficient sample sizes (>10 cases) to avoid misleading conclusions. For tumor types with fewer than 10 cases, such as KIRC and CC, incidence rates are presented descriptively without statistical testing. No FGFR fusions were detected in breast or prostate cancer in our study, likely due to limited sample sizes (146 breast cancer and 123 prostate cancer). Interestingly, parotid gland cancer showed the highest FGFR fusion incidence 40% (2/5), far exceeding the 7.84% (4/51) reported in the National Cancer Center Research Institute cohort21 (Figure 1B). This finding implies a greater potential benefit from FGFR inhibitors for these individuals with such tumors. Furthermore, our cohort revealed that different types of FGFR fusions exhibit tumor-type specific preferences. For instance, FGFR3 fusions dominated in glioma (91.43%) and lung cancer (53.85%), while FGFR1 fusions were only observed in soft tissue sarcoma (Figure 1C and Table S2).
Comparison of prevalence and distribution of FGFR fusions in Chinese and MSKCC pan-solid tumor cohorts. (A) Bar charts of FGFR fusions frequencies across various tumor types in different cohorts. Schematic diagram of human tumor organs by Figdraw (https://www.figdraw.com/static/index.html) and bar charts of 118 FGFR1/2/3 fusions from 114 pan-solid tumor patients in our cohort (left), 161 FGFR1/2/3 fusions from 153 patients in the MSKCC 2017 cohort (middle), and 48 FGFR1/2/3 fusions from 45 patients in the MSKCC 2021 cohort (right), respectively. (B) Pie Chart of FGFR1/2/3 fusions harbored parotid gland cancer in the National Cancer Center Research Institute cohort (upper left) and in our cohort (upper right), respectively. Integrative Genomics Viewer (IGV) screenshots showing that FGFR1-PLAG1 (bottom left) and FGFR3-TACC3 (bottom right) in our parotid gland cancer patients, respectively. (C) Histogram of FGFR1/2/3 fusions distribution in various cancer types among 3 cohorts. Our cohort (upper), MSKCC 2017 cohort (middle), and MSKCC 2021 cohort (bottom).
Characterization of FGFR fusion partners in pan solid tumors
A total of 44 unique partner genes were identified in the 118 FGFR fusions, indicating substantial heterogeneity. FGFR1 (13/16, 81.25%) and FGFR2 (17/22, 77.27%) showed diverse fusion types, with no dominant partner (Figure 2A-B), while FGFR3 predominantly fused with TACC3 (83.75%, 67/80) (Figure 2C), consistent with other classic receptor tyrosine kinase (RTK) rearrangements such as ALK (85.71%), RET (78.89%), and ROS1 (65.70%) (Figure 2C-E). The similar pattern of FGFR1/2/3 fusions was also observed in the other 2 MSKCC datasets (Figure S1A-E). Notably, FGFR intergenic-breakpoint fusions—novel potentially druggable alterations—were less common in our cohort (4.39%, 5/114) than in the MSKCC cohort (14.38%, 22/153), and included a newly identified FGFR3 intergenic-breakpoint fusion in melanoma (Figure 2F and Table S3). Additionally, we identified 15 novel FGFR fusions with potential clinical significance racial differences across 6 cancer types, accounting for up to 13.16% (15/114) of cases (Table S3).
Molecular profiling of FGFR1/2/3 fusions between Chinese and MSKCC 2021 cohorts. (A-C, F) Oncoprint heatmaps of FGFR1 fusions (A), FGFR2 fusions (B), FGFR3 fusions (C), and intergenic-breakpoint FGFR1/2/3 (F) in our cohort (left) and MSKCC 2021 cohort (right), respectively. Each column represents a patient. * and ** represents P < .01 and P < .01, respectively. (D, E) Histograms showed ratio statistics of “common” and “uncommon” FGFR1, FGFR2, and FGFR3 fusion partners in our cohort (D) and ALK, RET and ROS1 fusion partners in MSKCC 2021 cohort (E).
Chromosomal distribution patterns of FGFR fusions
Chromosomal distribution is one of the important features of RTK rearrangements. Distinct chromosomal distribution patterns were observed among different RTK rearrangements: ALK/RET rearrangements mainly occurred intrachromosomally, while ROS1 rearrangements predominantly clustered interchromosomally. Dissimilarities were also observed within the same kinase family, such as NTRK1/2 (intrachromosomal) vs NTRK3 (interchromosomal) (Figure S2A-D). In contrast to the above, we found for the first time that FGFR1/2/3 fusions predominantly exhibited intrachromosomal distribution (75%, 81.82%, and 87.50%, respectively) (Figure 3A, Table S4), consistent with the MSKCC cohort (Figure S2E). However, interchromosomal fusions were mainly linked to novel partners (75% for FGFR1/2 and 60% for FGFR3) (Table S4). Additionally, all common FGFR1/2/3 fusion partners and most uncommon FGFR1/2 partners (FGFR1: 8/12, 66.67%; FGFR2: 8/12, 66.67%) were intrachromosomal, whereas uncommon FGFR3 fusion partners showed more interchromosomal distribution (10/12, 83.33%) (Figure 3B-C).
Chromosomal distribution patterns of FGFR1/2/3 rearrangements. (A) Histogram showed proportions of FGFR1/2/3 chromosomal rearrangements in our cohort. (B) Bar chart displayed the proportion statistics of “common” and “uncommon” FGFR1/2/3 fusions chromosomal distribution. (C) Circos plots graphically depicting FGFR1, FGFR2, FGFR3, and their fusion partners in our cohort. Red font represents novel partners.
Characterization of FGFR1/2/3 fusion breakpoints
Distinct breakpoint distributions were observed among FGFR rearrangements. FGFR2 breakpoints predominantly clustered in intron17 (21/22, 95.45%), whereas FGFR1 and FGFR3 breakpoints were more dispersed across multiple introns (Figure 4A-C). Specifically, intron17 (5/16, 31.25%) and exon18 (3/16, 18.75%) were the 2 principal breakpoints for recurrent FGFR1 rearrangements, while nearly all other dispersed breakpoints involved rare fusion partners (Figure 4A). For FGFR3, breakpoints primarily occurred in intron17 (33/80, 41.25%), exon18 (30/80, 37.50%), 3’ untranslated regions (UTR) (11/80, 13.75%) and exon17 (3/80, 3.75%) (Figure 4C). Notably, the predominant FGFR1 breakpoints (intron17 and exon18), which together constituted half (8/16) of observed events, and specific FGFR3 breakpoints (3’ UTR and exon17, 14/80 cases), were uniquely identified in our cohort compared to the MSKCC cohort (Figure 4A and Figure S3A; Figure 4C and Figure S3C). The discrepancy might be due to ethnic differences or the sensitivity and coverage of different sequencing panels (see Table S5 for detailed intronic bait coverage, including FGFR1 intron 17). Additionally, significant intragenic regions preference between different FGFR rearrangements also existed. FGFR1/2 breakpoints mostly occurred in introns (68.75% 11/16 and 95.45% 21/22, respectively), while FGFR3 breakpoints were more common in exonic regions (42.50%, 34/80) within the coding sequence (CDS) and the 3’ UTR (13.75%, 11/80) (Figure 4A-C), and similar trends were observed in the MSKCC cohort (Figure S3A-C).
Distribution patterns of FGFR1/2/3 fusion breakpoints by DNA-NGS. (A-C) Sankey diagrams showing the detecting results flow of 16 FGFR1 (A), 22 FGFR2 (B), and 80 FGFR3 (C) rearrangements by SankeyMATIC (http://sankeymatic.com/build/). From left to right, the first columns representing the detailed structure domain of FGFR1/2/3 genes, the middle columns showing breakpoints of FGFR1/2/3 rearrangements, the right column displaying FGFR1/2/3 fusion partners arranged in alphabetical order. Red asterisk * represents novel fusion partner. ECD, extracellular domain; TM, transmembrane domain; RTK, receptor tyrosine kinase.
RNA-based NGS validation and characterization of rare FGFR1/2/3 fusions
Among the 118 FGFR fusions detected from 114 cases in our cohort, up to 17.54% (20/114) were rare, including 4.39% (5/114) intergenic-breakpoint fusions and 13.16% (15/114) novel fusions (Table 1 and Table S6). In total, of the 13 rare FGFR fusions that underwent RNA-NGS validation, 6 cases (46%) failed to generate a corresponding fusion transcript at the RNA level. This finding demonstrates that nearly half of the rare or novel FGFR fusions identified by DNA-NGS may be non-functional, highlighting the substantial incremental value of RNA-based validation. Functional validation of these rare fusions by RNA-NGS showed that 4 of 5 intergenic-breakpoint fusions were validated, with 2 intergenic*-FGFR1* fusions in lung cancer accounting for 50% of FGFR1-positive lung cases. However, these intergenic*-FGFR1* fusions were non-transcribable (Table 1 and Figures S4A-B and S5A-B). In contrast, the *FGFR2-*intergenic fusion in lung cancer produced a novel chimeric transcript with a complete kinase domain (FGFR2-PLEKHA4, E17: E10) (Figure S5C-D). The FGFR2-PLEKHA4 fusion is potentially targetable, as it produces an in-frame transcript with an intact kinase domain confirmed by in silico domain mapping (Figure S6), though further functional validation is needed to confirm ligand-independent activation. The newly discovered *FGFR3-*intergenic fusion in melanoma also generated a functional transcript (FGFR3-TNIP2, E17: E2) (Figures S4C-5D). The functional bias observed among different *FGFR-*intergenic fusions underscores the need for further verification in clinical practice to guide targeted therapy more accurately.
Additionally, 9 novel FGFR rearrangements (2 FGFR1, 2 FGFR2, 5 FGFR3) with sufficient specimens were verified by RNA-NGS. Among these, 4 novel fusions were not expressed, while 5 generated chimeric coding transcripts (Table 1). Notably, 3 of the non-expressed fusions lacked intact FGFR kinase domains (Figure S5E-F), and one had a breakpoint after the FGFR3 stop codon (Table 1 and Figure S4E-F). In contrast, among the 5 novel fusions with potential therapeutic targets for FGFR inhibitors, 3 in-frame FGFR fusions exhibited completely consistent forms at both DNA and RNA levels (Figure S5G-H and Figure S4G-H). However, discrepancies were observed in 2 exnoic FGFR novel samples: an FGFR3 exon18-ITGA9 intron27 fusion was detected at DNA level but underwent alternative splicing during transcription to form an in-frame FGFR3 exon17-ITGA9 exon28 fusion (Figure S5I-J), and a similar result was seen for FGFR3-TMPO fusion (E18: E2 to E17: E2) (Figure S4I-J). A subset of novel and rare fusions identified by NGS were further validated using orthogonal methods including FISH and Sanger sequencing, with representative results—such as those for the FGFR2-SCLT1 fusion—shown in Figure S4H. These validation results were concordant with the NGS findings for the analyzed cases. Notably, in this study, no FGFR1/2/3 fusions were identified exclusively by RNA-NGS that were not already detected by DNA-NGS, as our RNA analysis was limited to DNA-positive samples.
Discussion
FGFR1/2/3 have been recognized as oncogenic drivers contributing to tumorigenesis.3 However, comprehensive profiling of FGFR fusions remains limited. In this study, we analyzed the largest Chinese solid tumor cohort with FGFR fusions to date, identifying a total of 118 FGFR fusions and refining previously conflicting incidence rates of FGFR fusions in certain cancer types across different populations. Remarkably, Chinese patients with EC and parotid gland cancer displayed high clinical potential for targeted therapy. Additionally, the distribution of FGFR fusion breakpoints offers informative guidance for NGS panel design, with the predominant breakpoints of intron17 and exon18 in FGFR1 fusions and the 3’UTR in FGFR3 fusions revealed for the first time. Furthermore, functional transcripts were identified in rare FGFR fusions. However, inconsistencies were observed between DNA and RNA NGS in novel FGFR fusions with or without intact tyrosine kinase domain (TKD). In addition, functional preference was also observed among different FGFR-intergenic fusions. These findings provide valuable information for optimizing NGS to effectively diagnose low-frequency, diverse oncogenic FGFR fusions.
Compared to other RTK rearrangements such as ALK and ROS1,7^,^22 FGFR1/2/3 rearrangements are notably less frequent in solid tumors, leading to a scarcity of clinical studies comprehensively identifying FGFR fusions. Previous research23^,^24 have preliminarily explored the profiling of FGFR fusions in different populations, and revealed a significantly higher incidence of FGFR fusions in Chinese patients compared to Caucasians in certain cancers, such as cervical carcinoma (12.5% vs 0) and melanoma (10% vs 0), and so on. However, the smaller cohort size in previous Chinese studies may have contributed to deviations. Our study included 11,898 Chinese pan-solid tumor cases, which, to our knowledge, represents one of the largest cohorts for FGFR fusion profiling reported in the literature (see Table S1 for detailed comparisons with previous studies). This large number of cases enabled us to provide more reliable incidence rates for certain cancer types, refining previous estimates from smaller Chinese cohorts while confirming the occurrence of FGFR fusions in Chinese patients with cervical carcinoma and melanoma.23^,^24 Additionally, FGFR fusions were exclusively identified in Chinese HCC and KIRC cases. These findings emphasize the specific cancer preferences of FGFR fusions across different populations, highlighting the potential benefits of FGFR inhibitors in various cancers among different ethnic groups. Moreover, our study confirmed for the first time that GBM in China is a dominant disease for FGFR rearrangements, similar to the MSKCC cohort.8 Strikingly, our study found a high FGFR fusion incidence of 40% in parotid gland carcinoma, but this result is based on a limited sample size of 5 patients, restricting statistical power and generalizability. Therefore, while suggestive of potential clinical benefit from FGFR inhibitors, these findings require validation in larger cohorts to confirm prevalence and clinical utility. These results suggest potential clinical utility of FGFR inhibitors in specific tumor types and highlight the need for further research to identify patient populations who may derive benefit.
The low incidence of FGFR fusions in solid tumors poses a major challenge for thorough detection,25 while the limited understanding of FGFR fusions’ molecular characteristics further compounds this issue. Comprehensive profiling of FGFR fusions to identify breakpoints and partners is necessary to optimize detection performance. Our study revealed that FGFR2 fusions predominantly featured breakpoints in intron17 (∼3600 bp) (95.45%, 21/22), while FGFR1/3 exhibited highly diverse breakpoint distributions. Previous studies7^,^24 showed dispersed breakpoint characteristics in FGFR1 fusions (introns 3-4, intron 10 and introns 15-16), whereas our study identified intron17 (∼3677 bp) (5/16, 31.25%) as a dominant breakpoint for the first time. This difference may be attributed to the panel coverage of intron17, which was fully covered in our study but not in the MSKCC-fusion panel. Additionally, exonic-breakpoint fusions were identified in 31.25% of FGFR1 and 56.25% of FGFR3 positive cases, indicating the importance of adequate exons coverage in targeted NGS panels for FGFR1/3 fusions detection. Moreover, in contrast to other oncogenic rearrangements (ALK, ROS1, etc.),26^,^27 where breakpoints mainly distribute in the coding sequence (CDS), FGFR fusions, particularly in FGFR3, were often found in the 3′ UTR (13.75%, 11/80). This highlights that targeting only the CDS region during sequencing is not sufficient for detecting FGFR fusions; the 3′ UTR should also be considered in NGS panel design. Intuitively, incorporating the consequences of breakpoints distribution variations into sequencing assays can significantly improve FGFR fusions detection. However, due to extensively diverse breakpoint distributions and complex intron structures, off-target sequencing may occur, if only breakpoints are considered during panel design. Including major fusion partners is another strategy for effective detection. However, unlike FGFR3, which had a dominant partner (TACC3, 78.75%, 63/80), FGFR1/2 partners were more dispersed, with unique partners reaching up to 81.25% (13/16) and 77.27% (17/22), respectively. This suggests that including only TACC3 maybe sufficient for enhancing FGFR3 fusion detection, whereas a range of high-frequency partners is needed for FGFR1/2 fusions detection.
Although DNA-based NGS provides a broad approach for detecting FGFR rearrangements, our findings highlight significant discrepancies between DNA and RNA results, particularly for rare and novel fusions. In our cohort, nearly half (46%) of DNA-detected rare FGFR1/2/3 fusions could not be validated by RNA-NGS. While some of these events may indeed be non-functional or false positives, other factors such as degraded RNA, low transcript abundance, or post-transcriptional mechanisms (e.g., nonsense-mediated decay) could also explain the absence of RNA-level detection. Notably, the inability to detect RNA transcripts was especially evident among intergenic-FGFR1 fusions and novel events lacking an intact kinase domain. Furthermore, RNA-level analysis revealed alternative splicing events that were not predictable from DNA data alone. These results underscore the substantial incremental value of RNA-NGS validation, which is essential for distinguishing clinically relevant, functional FGFR fusions and ensuring accurate patient selection for FGFR-targeted therapies. Based on these findings, we recommend that rare or atypical FGFR fusions identified by DNA-based assays undergo orthogonal validation prior to clinical decision-making. Recent studies7^,^28^,^29 have suggested that some intergenic-breakpoint fusions may be transcribed, but their functionality in FGFR fusions remains unclear, raising questions about the therapeutic potential of FGFR fusions with intergenic partners. For the first time, we found that functional preferences vary among different FGFR-intergenic fusions. Specifically, all intergenic-FGFR1 fusions lacked RNA expression and were not clinically beneficial targets, consistent with previous findings.28 However, *FGFR2/3-*intergenic fusions generated functional fusion transcripts, broadening the potential therapeutic scope. This functional divergence suggests that FGFR subtype may influence outcomes of intergenic-breakpoint FGFR fusions, necessitating further studies for confirmation. More interestingly, unlike other oncogenic rearrangements such as ALK^9^ and RET,26 where rare genomic rearrangements can transform into canonical fusions, rare FGFR fusions exhibit similar forms at both DNA and RNA levels. This similarity may be attributed to the fact that the majority of rare genomic ALK and RET fusion partners are in close chromosomal proximity to their respective genes,30 whereas FGFR fusion partners do not exhibit this pattern. Additionally, our previous research9^,^17 showed that 5′-RTK fusions (5′-ALK, 5′-RET, etc.) can generate canonical functional transcripts even with intact TKD. Conversely, FGFR fusions, dominated by 5’ fusions, are not expressed when the TKD is incomplete. Such differences may be attributed to the structural characteristics of different oncogenic drivers. These novel findings emphasize the importance of validation assays, such as RNA NGS, for cases with intergenic-breakpoint or incomplete kinase domain FGFR fusions to guarantee the production of active chimeric proteins. A key limitation of our study is that, due to limited specimen availability and the low incidence of FGFR fusions, we were only able to perform RNA-based validation on a subset of DNA-positive cases. As a result, we could not determine whether RNA-NGS could identify additional FGFR rearrangements missed by DNA-based assays in this cohort. However, as demonstrated in our recent large-scale sarcoma cohort study,31 RNA-based sequencing can indeed uncover additional actionable fusions that are missed by DNA-NGS panels. Future comprehensive dual-platform analyses in solid tumors are warranted to fully evaluate this potential.
Conclusion
Taken together, we conducted comprehensive molecular profiling of FGFR-positive fusions using one of the largest reported Chinese pan-solid tumor cohorts to date. Additionally, our results provide valuable insights for optimizing FGFR detection by NGS. Moreover, novel fusions were identified and validated, expanding the scope of FGFR rearrangements and providing important insights for clinical research and potential applications.
This study has several limitations. Despite observing a significant FGFR fusion rate in parotid gland cancer, the statistical power was constrained by the low incidence of this cancer type and the limited number of cases in our cohort. Therefore, a larger cohort size is required to further support our conclusions. Additionally, due to specimen unavailability, some *FGFR-*intergenic rearrangements identified by DNA NGS could not be validated by RNA NGS. It remains unclear whether intergenic-breakpoint fusions involving different FGFR genes (FGFR1, FGFR2, or FGFR3) consistently yield functional transcripts in larger patient cohorts. Further research is needed to clarify whether specific FGFR-intergenic rearrangements can generate transcripts that inform targeted therapeutic strategies. Moreover, further wet-lab work is needed to confirm the clinical value of novel FGFR fusions.
Supplementary Material
oyaf347_Supplementary_Data
The reference list from the paper itself. Each links out to its DOI / PubMed record.
- 1Goyal L , Kongpetch S, Crolley VE, et al Targeting FGFR inhibition in cholangiocarcinoma. Cancer Treat Rev. 2021;95:102170.33735689 10.1016/j.ctrv.2021.102170 · doi ↗ · pubmed ↗
- 2Lassman AB , Sepulveda-Sanchez JM, Cloughesy TF, et al Infigratinib in patients with recurrent gliomas and FGFR alterations: a multicenter phase ii study. Clin Cancer Res. 2022;28:2270-2277.35344029 10.1158/1078-0432.CCR-21-2664 PMC 9167702 · doi ↗ · pubmed ↗
- 3Babina IS , Turner NC. Advances and challenges in targeting FGFR signalling in cancer. Nat Rev Cancer. 2017;17:318-332.28303906 10.1038/nrc.2017.8 · doi ↗ · pubmed ↗
- 4Patel TH , Marcus L, Horiba MN, et al FDA approval summary: Pemigatinib for previously treated, unresectable locally advanced or metastatic cholangiocarcinoma with FGFR 2 fusion or other rearrangement. Clin Cancer Res. 2023;29:838-842.36206041 10.1158/1078-0432.CCR-22-2036 PMC 9991984 · doi ↗ · pubmed ↗
- 5Loriot Y , Necchi A, Park SH, et al BLC 2001 Study Group. Erdafitinib in locally advanced or metastatic urothelial carcinoma. N Engl J Med. 2019;381:338-348.31340094 10.1056/NEJ Moa 1817323 · doi ↗ · pubmed ↗
- 6Kang C. Infigratinib: First approval. Drugs. 2021;81:1355-1360.34279850 10.1007/s 40265-021-01567-1PMC 8610935 · doi ↗ · pubmed ↗
- 7Nguyen B , Fong C, Luthra A, et al Genomic characterization of metastatic patterns from prospective clinical sequencing of 25,000 patients. Cell. 2022;185:563-575 e 511.35120664 10.1016/j.cell.2022.01.003PMC 9147702 · doi ↗ · pubmed ↗
- 8Zehir A , Benayed R, Shah RH, et al Mutational landscape of metastatic cancer revealed from prospective clinical sequencing of 10,000 patients. Nat Med. 2017;23:703-713.28481359 10.1038/nm.4333 PMC 5461196 · doi ↗ · pubmed ↗