Assessing frailty to predict surgical risk: a comparative study of three tools in older non-cardiac surgery patients
Mantana Saetang, Thitikan Kunapaisal, Sunisa Chatmongkolchart, Dararat Yongsata, Khwanrut Sukitpaneenit

TL;DR
This study compares three tools for predicting surgical risk in older patients and finds that the Clinical Frailty Scale is the most effective when combined with another standard measure.
Contribution
The study evaluates and compares the predictive accuracy of three frailty tools in older surgical patients and identifies the best-performing combination for risk prediction.
Findings
Frailty assessed with the Clinical Frailty Scale (CFS) was the strongest independent predictor of postoperative complications.
Combining the CFS with the American Society of Anesthesiologists (ASA) classification improved predictive accuracy more than other combinations.
All three frailty tools were significantly associated with higher complication rates in older non-cardiac surgery patients.
Abstract
Frailty is a significant predictor of adverse outcomes in older surgical patients. this study, we aimed to evaluate the feasibility and predictive ability of the Clinical Frailty Scale (CFS), Modified Frailty Index-11 (mFI-11), and FRAIL scale for postoperative complications in older Thai patients who underwent intermediate- to high-risk non-cardiac surgery. This prospective cohort study included 637 older patients (aged ≥ 60 years) scheduled for intermediate- to high-risk elective non-cardiac surgery. Frailty was assessed preoperatively using the CFS, mFI-11, and FRAIL scale. Postoperative complications were defined as Clavien–Dindo classification ≥ 2. Predictive performance was analyzed using logistic regression and the area under the receiver operating characteristic curve (AUC). The mean age of participants was 70.5 years (standard deviation 7.68), and 48% were male. Frailty was…
Genes, proteins, chemicals, diseases, species, mutations and cell lines named across the full text — each resolved to its canonical identifier and authoritative record.
Click any figure to enlarge with its caption.
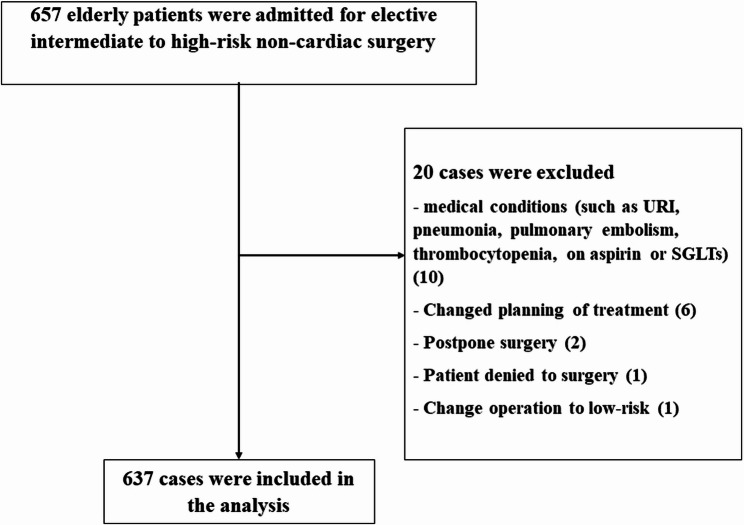 Figure 1
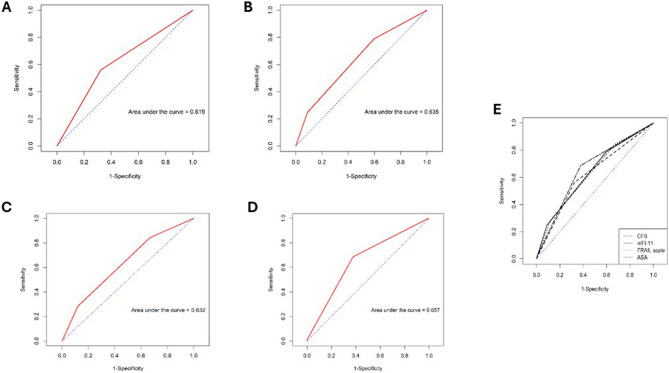 Figure 2
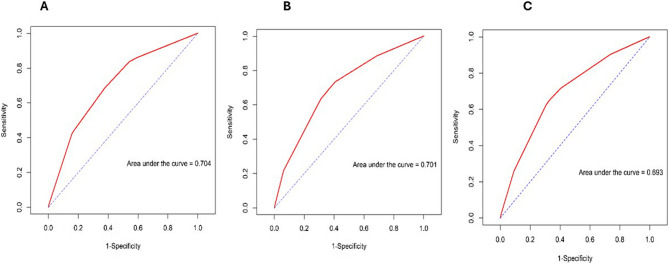 Figure 3
- —http://dx.doi.org/10.13039/501100010804Faculty of Medicine, Prince of Songkla University
Peer Reviews
No public reviews on file for this paper yet. If you reviewed it on a platform where reviews are public (OpenReview, ICLR, NeurIPS, ICML), you can paste yours below so the community can read it here.
Videos
No videos yet. Explain this paper in a talk, walkthrough, or lecture? Add one.
Taxonomy
TopicsFrailty in Older Adults · Cardiac, Anesthesia and Surgical Outcomes · Nutrition and Health in Aging
Background
Population aging is accelerating globally. As healthcare and living conditions improve, life expectancy continues to rise, resulting in a growing proportion of older adults. Thailand is among the most rapidly aging countries in Asia, transitioning from a young to an aging society within only a few decades. By 2050, the number of older adults in Thailand is projected to reach 20 million, accounting for 35.8% of the total population [1–3]. As the aging population continues to expand, the number of surgical procedures performed in this group is also expected to increase substantially [4].
One major challenge in this context is frailty, a multidimensional geriatric syndrome in older adults characterized by reduced physical strength and physiological reserve, which increases vulnerability to falls, illness, and other health complications [5]. More than half of older surgical patients are estimated to experience preoperative frailty [6]. Furthermore, frailty is strongly associated with surgical complications, mortality, and prolonged length of stay (LOS), significantly challenging healthcare providers and the health system [7–12].
Risk prediction models, such as age, American Society of Anesthesiologists (ASA) physical status, Revised Lee’s Cardiac Risk Index, Charlson Comorbidity Index, and exercise tolerance, are commonly used to estimate perioperative risk. Nonetheless, these tools mainly predict organ-specific complications and do not account for the frailty-associated diminished reserve and vulnerability, thereby reducing their ability to capture outcomes, including functional recovery, LOS, and postoperative institutionalization [13]. Therefore, incorporating frailty and geriatric syndrome assessment into the preoperative evaluation is essential for improving the prediction of adverse outcomes.
Several frailty assessment tools are available. The most widely used are the Fried Criteria and Rockwood Frailty Index [5, 14]. While valuable, they are often time-consuming and resource-intensive, limiting their feasibility in routine clinical practice. Consequently, simplified screening tools are increasingly recognized as essential for the practical assessment of frailty in surgical patients. Nevertheless, a consensus on which measures are most appropriate for perioperative settings is lacking [15]. Ideally, a frailty assessment tool should be quick, easy to administer, and effective in predicting perioperative risk and guiding care decisions [16]. Recently developed tools, such as the CFS, mFI-11, and FRAIL scale, can be administered in approximately 10 min without requiring physical measurement such as hand grip strength [17]. Despite their growing use, systemic evaluation of their validity, feasibility, and predictive value for postoperative complications remains warranted.
Therefore, in this study, we aimed to evaluate the content validity and feasibility of the CFS, mFI-11, and FRAIL scale, to compare their frailty prevalence estimates, and to assess their predictive ability for postoperative complications (Clavien–Dindo classification ≥ 2) in older adults undergoing intermediate- to high-risk non-cardiac surgery.
Methods
Ethical statements
This study was conducted in accordance with the principles of the Declaration of Helsinki and was reviewed and approved by the Institutional Ethics Committee of the Faculty of Medicine, Prince of Songkla University, Songkhla, Thailand (Approval Reference: REC.64–396-8-1) on February 27, 2022. All the enrolled patients provided informed consent to participate in the study.
Study design, setting, and participants
This prospective cohort observational study was conducted among older patients undergoing scheduled non-cardiac surgery at Songklanagarind Hospital, a tertiary care center in Southern Thailand between January 30, 2023 and April 10, 2024. The study included patients aged ≥ 60 years who were scheduled for elective non-cardiac surgery. Patients undergoing surgery categorized as moderate-to-high risk based on the cardiac risk stratification for non-cardiac procedures were eligible for inclusion. Only the first surgery during hospitalization was considered for each patient. Patients who were too ill for preoperative assessments and those receiving palliative care were excluded. In total, 657 patients were initially admitted for surgery, of whom 20 were excluded from the analysis. Thus, 637 patients were included in the final analysis (Figure 1).Fig. 1. Consort flow of study
Sample size calculation
Our primary objective was to compare the predictive performance (receiver operating characteristic [ROC]–area under the curve [AUC]) of three brief frailty tools (CFS, mFI-11, and FRAIL scale) for in-hospital postoperative complications ≥ grade II by Clavien–Dindo. Target AUCs were obtained from prior studies:[18, 19] 0.684 (95% CI 0.614–0.749) [18], 0.753 (95% CI 0.686–0.812) [18], and 0.60 (95% CI 0.58–0.62) for the FRAIL scale, CFS, and mFI, respectively [19]. Using a two-sided α = 0.05 (Zα/2 = 1.96) and power of 80% (Zβ = 0.84), while assuming equal allocation (r = 1), we estimated the sample sizes required for pairwise AUC comparisons by approximating the AUC as a probability and applying a z-test for the difference between two independent proportions with continuity correction). These proportions were used to calculate the required sample size for the analysis as follows:
\documentclass[12pt]{minimal} \usepackage{amsmath} \usepackage{wasysym} \usepackage{amsfonts} \usepackage{amssymb} \usepackage{amsbsy} \usepackage{mathrsfs} \usepackage{upgreek} \setlength{\oddsidemargin}{-69pt} \begin{document}$$\:{n}_{1}={\left[\frac{{z}_{1-\frac{\alpha\:}{2}}\sqrt{\stackrel{-}{p}\stackrel{-}{q}\left(1+\frac{1}{r}\right)}+{z}_{1-\beta\:}\sqrt{{p}_{1}{q}_{1}+\frac{{p}_{2}{q}_{2}}{r}}}{{\Delta\:}}\right]}^{2}$$\end{document} \documentclass[12pt]{minimal} \usepackage{amsmath} \usepackage{wasysym} \usepackage{amsfonts} \usepackage{amssymb} \usepackage{amsbsy} \usepackage{mathrsfs} \usepackage{upgreek} \setlength{\oddsidemargin}{-69pt} \begin{document}$$\:r=\frac{{n}_{2}}{{n}_{1}},\hspace{1em}{q}_{1}=1-{p}_{1},\hspace{1em}{q}_{2}=1-{p}_{2}$$\end{document} \documentclass[12pt]{minimal} \usepackage{amsmath} \usepackage{wasysym} \usepackage{amsfonts} \usepackage{amssymb} \usepackage{amsbsy} \usepackage{mathrsfs} \usepackage{upgreek} \setlength{\oddsidemargin}{-69pt} \begin{document}$$\:\stackrel{-}{p}=\frac{{p}_{1}+{p}_{2}r}{1+r},\hspace{1em}\stackrel{-}{q}=1-\stackrel{-}{p}$$\end{document}- CFS vs. FRAIL scale: n₁ = n₂ = 637 per group (largest requirement)
- CFS vs. mFI-11: n₁ = n₂ = 159 per group
- FRAIL vs. mFI-11: n₁ = n₂ = 534 per group
Because all three tools were applied to the same cohort (within-subject comparisons), we adopted the most conservative requirement and planned for N = 637 participants to ensure ≥80% power across all pairwise comparisons. We ultimately analyzed 637 patients, meeting the a priori target.
Data collection
Frailty assessment tools
Preoperative frailty assessments were performed using the CFS, mFI, and FRAIL scale. The CFS provides a clinical approach to frailty. It comprises nine clinical stages, with scores of 1 to 2 indicating robustness, 3 or 4 representing prefrailty, and ≥5 identifying frailty [20]. The mFI-11 is a scoring index of 11 accumulating deficits that contribute to frailty. Frailty status is categorized as robust (score = 0), prefrail (< 0.27), and frail (≥ 0.27) [21]. The FRAIL scale is a validated phenotypic tool comprising five questions related to fatigue, resistance, ambulation, illness, and weight loss. A score of 0 indicates robustness, 1–2 represents pre-frailty, and ≥3 identifies frailty [22–24].
Preoperative data retrieved from medical records included age, gender, marital status, living situation, presence of comorbidities, Mini-Cog score, medications used on admission, ASA score, mid-arm circumference, albumin level, hemoglobin level, visual impairment, hearing impairment, surgical subspecialty, and cardiac risk stratification. Regarding cognitive screening, the Mini-Cog test (Thai version) was used, with a score < 3 indicating a higher likelihood of cognitive impairment [25].
For laboratory markers, preoperative hemoglobin, albumin, and serum creatinine levels were obtained as part of routine clinical care; they were selected because they reflect physiological reserve and have been associated with frailty and adverse surgical outcomes in prior studies [26–28]. Low hemoglobin may indicate anemia; hypoalbuminemia is a marker of malnutrition and chronic illness; and elevated serum creatinine reflects impaired renal function. Therefore, we examined their associations with frailty status and short-term postoperative outcomes in this cohort.
Postoperative complications
Postoperative complications were systematically monitored and categorized as follows: cardiac, pulmonary, neurological, and renal complications; infections; multi-organ failure; transfusions; unplanned returns to the operating room or intensive care unit; LOS; 30-day readmission; and all-cause mortality. Postoperative complications were categorized according to the Clavien–Dindo classification [29].
Outcomes
The sensitivity, specificity, ROC, and AUC of the three frailty scales in predicting in-hospital postoperative complications according to the Clavien–Dindo classification (≥ grade 2) were evaluated.
Statistical analysis
Categorical variables were expressed as numbers and percentages, and differences between groups were compared using Chi-Square or Fisher’s exact test, as appropriate. Continuous variables were expressed as mean and standard deviation (SD) or median and interquartile range, and differences between groups were compared using a t-test or Wilcoxon rank sum test, as appropriate.
Binary logistic regression analysis was conducted to assess the association between frailty (measured by the CFS, mFI-11, and FRAIL scale) and postoperative complications (Clavien–Dindo classification ≥ II). Univariable analyses were first conducted, and variables with p < 0.2 as well as clinically relevant covariates (age, sex, ASA classification, and major comorbidities) were included in the multivariable model. Backward stepwise elimination based on the Akaike Information Criterion was applied to identify independent predictors. Odds ratios (ORs) with 95% confidence intervals (CIs) were reported.
Model discrimination was evaluated using ROC curves, and the AUC was reported with 95% CIs. The discriminatory performance of the frailty instruments (CFS, mFI-11, and FRAIL) was compared using DeLong’s test for correlated ROC curves. All statistical tests were two-tailed, with p < 0.05 considered statistically significant. Analyses were performed using R software (version 4.3.1; R Foundation for Statistical Computing, Vienna, Austria).
Results
Patient characteristics by frailty assessment tool
We assessed 637 older Thai patients who underwent intermediate- to high-risk non-cardiac surgery (Figure 1). Of these, 464 (72.8%) underwent intermediate-risk non-cardiac surgery. The mean patient age was 70.5 years (SD 7.68), and males accounted for 48% of the patients. According to the CFS, mFI-11, and FRAIL scale, the prevalence rates of frailty in the study population were 38.5%, 13%, and 16.2%, respectively. Patient characteristics were analyzed according to the CFS, mFI-11, and FRAIL scale. Frail patients had a significantly higher prevalence of preoperative anemia and lower albumin levels, creatinine clearance, and Mini-Cog scores than prefrail and robust patients (Table 1).Table 1. Patient characteristics by frailty measure in elderly patients undergoing intermediate to high-risk non-cardiac surgeryPatient characteristicsCFSmFI-11Frail scalerobust (n = 38)prefrail (n = 354)frail (n = 245)p-valuerobust (N = 225)prefrail (N = 329)frail (N = 83)p-valuerobust (N = 182)prefrail (N = 352)frail (N = 103)p-valueAge (yrs), median(IQR)67 (62.2,70.8)68 (64,73)73 (67,79)< 0.00168 (64,73)70 (65,75)74 (69,83)< 0.00166.5 (63,72)70 (65,76)73 (68,78)< 0.001Sex; male, n (%)17 (44.7)194 (55.1)95 (38.8)< 0.001112 (50)163 (49.7)31 (37.3)0.10584 (46.7)161 (45.7)61 (59.2)0.049BMI, median(IQR)25.6 (21.6,28.7)24 (21.6,27.2)23.4 (20.4,26.6)0.01424.2 (21.8,27.2)23.8 (20.9,27)23.4 (20.7,26.7)0.16523.8 (21.3,26.6)24.1 (21.6,27.6)23.2 (20.3,26.3)0.014Marital status, n (%)0.0010.0070.091- married/common law30 (78.9)281 (79.6)161 (66)180 (80)238 (72.8)54 (65.1)151 (83)247 (70.4)74 (72.5)- never married3 (7.9)15 (4.2)8 (3.3)7 (3.1)18 (5.5)1 (1.2)6 (3.3)16 (4.6)4 (3.9)- widowed3 (7.9)41 (11.6)58 (23.8)31 (13.8)48 (14.7)23 (27.7)19 (10.4)64 (18.2)19 (18.6)- divorced/separated2 (5.3)16 (4.5)17 (7)7 (3.1)23 (7)5 (6)6 (3.3)24 (6.8)5 (4.9)Education, n (%)< 0.0010.0580.001- less than high school13 (34.2)165 (46.6)168 (68.9)109 (48.4)183 (55.6)54 (65.9)81 (44.5)203 (57.8)62 (60.2)- high school9 (23.7)92 (26)46 (18.9)54 (24)78 (23.7)15 (18.3)41 (22.5)80 (22.8)26 (25.2)- ≥ bachelor’s degrees16 (42.1)97 (27.4)30 (12.3)62 (27.6)68 (20.7)13 (15.9)60 (33)68 (19.4)15 (14.6)Living situation, n (%)< 0.001< 0.0010.001- living at home independently10 (26.3)128 (36.2)184 (75.1)94 (41.8)172 (52.3)56 (67.5)83 (45.6)182 (51.7)57 (55.3)- living at home with help1 (2.6)4 (1.1)31 (12.7)1 (0.4)25 (7.6)10 (12)4 (2.2)20 (5.7)12 (11.7)- lives alone27 (71.1)222 (62.7)30 (12.2)130 (57.8)132 (40.1)17 (20.5)95 (52.2)150 (42.6)34 (33)Comorbidities, n (%)32 (84.2)332 (93.8)232 (94.7)0.048209 (92.9)307 (93.3)80 (96.4)0.522157 (86.3)339 (96.3)100 (97.1)< 0.001- Ischemic heart disease1 (3.1)34 (10.1)28 (12.1)0.2856 (2.9)35 (11.3)22 (27.5)< 0.0013 (1.9)19 (5.6)41 (41)< 0.001- Heart failure0 (0)6 (1.8)4 (1.7)11 (0.5)4 (1.3)5 (6.2)0.0080 (0)6 (1.8)4 (4)0.047- Hypertension7 (21.9)214 (63.9)173 (74.6)< 0.001104 (49.8)226 (72.9)64 (80)< 0.00136 (22.5)269 (79.4)89 (89)< 0.001- Dyslipidemia10 (31.2)212 (63.5)152 (65.5)< 0.001115 (55)197 (63.8)62 (77.5)0.00272 (45.3)229 (67.6)73 (73)< 0.001- Diabetes1 (3.1)73 (21.9)54 (23.3)0.03220 (9.6)75 (24.4)33 (41.2)< 0.0017 (4.4)76 (22.4)45 (45)< 0.001- Chronic lung disease1 (3.1)19 (5.7)19 (8.2)0.3674 (1.9)21 (6.8)14 (17.5)< 0.0013 (1.9)23 (6.8)13 (13)0.002- CKD stage more than or equal to 31 (3.1)40 (12)31 (13.4)0.2513 (6.2)47 (15.3)12 (15)0.00510 (6.4)38 (11.2)24 (24)< 0.001- CVD2 (6.2)24 (7.2)30 (12.9)0.0619 (4.3)37 (12.1)10 (12.5)0.0073 (1.9)30 (8.8)23 (23)< 0.001- Alcohol drinking6 (18.8)61 (18.4)30 (12.9)0.2136 (17.2)53 (17.3)8 (10)0.26329 (18.5)49 (14.5)19 (19)0.382- Smoking5 (15.6)67 (20.2)36 (15.5)0.34241 (19.6)56 (18.2)11 (13.8)0.5130 (19.1)58 (17.1)20 (20)0.75Visual impairment, n (%)17 (44.7)227 (64.1)142 (58)0.038126 (56)206 (62.6)54 (65.1)0.197108 (59.3)212 (60.2)66 (64.1)0.718Hearing impairment, n (%)7 (18.4)120 (33.9)79 (32.2)0.15362 (27.6)116 (35.3)28 (33.7)0.15750 (27.5)116 (33)40 (38.8)0.134ASA class, median(IQR)2 (2,2)2 (2,3)3 (2,3)< 0.0012 (2,3)3 (2,3)3 (2,3)< 0.0012 (2,2)2 (2,3)3 (3,3)< 0.001RCRI, n (%)0.579< 0.001< 0.001− 029 (76.3)208 (58.8)150 (61.2)161 (71.6)191 (58.1)35 (42.2)136 (74.7)221 (62.8)30 (29.1)− 18 (21.1)120 (33.9)75 (30.6)61 (27.1)107 (32.5)35 (42.2)42 (23.1)114 (32.4)47 (45.6)− 21 (2.6)22 (6.2)16 (6.5)3 (1.3)31 (9.4)13 (15.7)4 (2.2)17 (4.8)26 (25.2)Cardiac risk stratification surgical procedure, n (%)0.0210.210.655- High-risk (172)9 (23.7)111 (31.4)52 (21.3)51 (22.9)96 (29.2)25 (30.1)45 (24.7)97 (27.6)30 (29.4)- Intermediate-risk (463)29 (76.3)242 (68.6)192 (78.7)172 (77.1)233 (70.8)58 (69.9)137 (75.3)254 (72.4)72 (70.6)Preoperativ anemia, n (%)17 (44.7)188 (53.1)180 (73.5)< 0.001114 (50.7)209 (63.5)62 (74.7)< 0.00193 (51.1)216 (61.4)76 (73.8)< 0.001Albumin level, median(IQR)4 (3.7,4.3)4 (3.8,4.3)3.8 (3.5,4.1)< 0.0014.1 (3.9,4.3)3.9 (3.6,4.1)3.6 (3.2,4)< 0.0014 (3.8,4.3)4 (3.6,4.2)3.8 (3.4,4)< 0.001CrCl, median(IQR)71.8 (62,80.8)62.7 (49,77)58 (43.4,76)0.00464 (52,81)61 (45,76)62 (43.2,75.6)0.04265.2 (54,80)63 (46,77)53 (39.3,71.8)< 0.001Mini-Cog score, median(IQR)2 (1,3)3 (1,3)2 (1,3)0.0023 (1,3)2 (1,3)2 (0,3)< 0.0013 (1,3)2 (1,3)2 (1,3)0.096ASA American Society of Anesthesiologists, BMI Body Mass Index, CKD Chronic kidney disease, CrCl Creatinine clearance, CVD Cerebrovascular disease, RCRI Revised Cardiac Risk Index
Association between frailty and postoperative complications by frailty assessment tool
Frailty assessed using the three tools was significantly associated with increased rates of overall postoperative complications. Specifically, frail patients demonstrated markedly higher complication rates than non-frail patients across all three assessment tools: CFS (44.9% vs. 22.2%), mFI-11 (57.8% vs. 26.9%), and FRAIL scale (56.3% vs. 26.0%) (all p < 0.001) (Table 2). Regarding specific outcomes, the proportion of frail patients with complications classified as Clavien–Dindo grade ≥ 2, indicating the presence of more severe postoperative complications, was higher than that of non-frail patients. Moreover, LOS was markedly prolonged in frail patients across all frailty assessment tools (Table 2).Table 2. Post-operative complications and outcomes by frailty measure in elderly patients undergoing intermediate to high-risk non-cardiac surgeryPost-operative complications and OutcomesCSFmFI-11FRAIL scaleNon-frailFrailp-valueNon-frailFrailp-valueNon-frailFrailp-valueOverall post-op complications, n (%)87 (22.2)110 (44.9)< 0.001149 (26.9)48 (57.8)< 0.001139 (26)58 (56.3)< 0.001Cardiac complication, n (%)25 (27.8)16 (14.5)0.03332 (21.1)9 (18.8)0.88926 (18.4)15 (25.4)0.356Pulmonary complication, n (%)36 (40)31 (28.2)0.10752 (34.2)15 (31.2)0.83952 (36.9)15 (25.4)0.161Neurologic complication, n (%)6 (6.7)15 (13.6)0.1813 (8.6)8 (16.7)0.18915 (10.7)6 (10.2)1Renal complication, n (%)18 (20.2)21 (19.1)0.98331 (20.5)8 (16.7)0.70527 (19.3)12 (20.3)1Infection, n (%)16 (18)25 (22.7)0.51732 (21.2)9 (18.8)0.87333 (23.6)8 (13.6)0.161Multiorgan failure, n (%)1 (1.1)1 (0.9)11 (0.7)1 (2.1)0.4251 (0.7)1 (1.7)0.506Transfusion of blood products, n (%)26 (29.2)64 (58.2)< 0.00162 (41.1)28 (58.3)0.05458 (41.4)32 (54.2)0.133Use Vasopressor or inotrope, n (%)4 (4.5)9 (8.2)0.44812 (7.9)1 (2.1)0.19510 (7.1)3 (5.1)0.759Unplanned return to OR, n (%)3 (3.4)15 (13.6)0.02413 (8.6)5 (10.4)0.77310 (7.1)8 (13.6)0.242Unplanned return to ICU, n (%)5 (5.6)5 (4.5)0.7559 (6)1 (2.1)0.4568 (5.7)2 (3.4)0.726Duration of surgery (mins), median (IQR)252.5 (175,370)260 (180,350)0.907252.5 (180,360)265 (182.5,342.5)0.678252.5 (175,355)265 (190,360)0.228Blood loss (mL), median (IQR)100 (20,300)150 (50,400)< 0.001100 (20,300)200 (40,425)0.025100 (20,300)150 (50,475)0.002The Clavien-Dindo classification, median (IQR)1 (1,1)1 (1,3)< 0.0011 (1,1)1 (1,3)< 0.0011 (1,1)1 (1,3)< 0.00130-day mortality, n (%)2 (0.5)5 (2)0.1143 (0.5)4 (4.8)0.0076 (1.1)1 (1)1Death during admission, n (%)1 (0.3)3 (1.2)0.1612 (0.4)2 (2.4)0.0843 (0.6)1 (1)0.507Hospital LOS (day), median (IQR)6 (4,9)7 (5,11)< 0.0016 (4,9)8 (6,12.5)< 0.0016 (4,9)8 (6,11)< 0.001ICU LOS (day), media (IQR)0 (0,0)0 (0,0)0.090 (0,0)0 (0,0)0.8730 (0,0)0 (0,0)< 0.00130-day readmission, n (%)17 (4.3)19 (7.8)0.10130 (5.4)6 (7.2)0.45125 (4.7)11 (10.7)0.029ICU Intensive care unit, IQR Interquartile range, LOS Length of stay, OR Operating room
Frailty assessed using the CFS significantly influenced various postoperative outcomes in older patients undergoing non-cardiac surgeries. Frail patients had a higher need for blood product transfusions and more frequent unplanned returns to the operating room than non-frail patients (58.2% vs. 29.2%, p < 0.001; 13.6% vs. 3.4%, p = 0.024, respectively). Despite these high complication rates, frail patients exhibited a lower incidence of cardiac complications than their non-frail counterparts (14.5% vs. 27.8%, p = 0.033).
Frailty assessment using the CFS, mFI-11, and FRAIL scale revealed varying associations with 30-day mortality rates among older surgical patients. There were no significant differences in 30-day mortality between non-frail and frail patients assessed using the CFS and FRAIL scale. However, the mFI-11 exhibited a substantial increase in mortality among frail patients than non-frail patients (3 [0.5%] vs. 4 [4.8%], p = 0.007). Frail patients demonstrated numerically higher rates of 30-day readmission across all frailty assessment tools; nonetheless, statistical significance was observed only for the FRAIL scale (p = 0.029) (Table 2).
Frailty and postoperative complications according to the Clavien–Dindo classification
Among the 637 patients, 26.1% experienced postoperative complications. Using the CFS, mFI-11, and FRAIL scale, the incidences of complications in the frail and non-frail groups were 38% (93/245) and 18.6% (73/392), 49.4% (41/83) and 22.6% (125/554), and 45.6% (47/103) and 22.3% (119/534), respectively. The between-group differences were significant (p < 0.001) (Table 3).Table 3. Factors associated with postoperative complications in elderly patients based on Clavien-Dindo classification (CDC)Factor associated with postoperative complicationsCDC < 2 (N = 471)CDC class ≥ 2 (N = 166)p-valueAge (yrs), median (IQR)69 (65,74)71.5 (65,78)0.002Sex;< 0.001 Female263 (56.1)66 (39.8) Male206 (43.9)100 (60.2)BMI, median (IQR)24.3 (21.6,27.6)22.7 (20.2,25.3)< 0.001Living situation< 0.001 living at home independently227 (48.2)95 (57.2) living at home with help18 (3.8)18 (10.8) lives alone226 (48)53 (31.9)Comorbidity437 (92.8)159 (95.8)0.241Ischemic heart disease42 (8.9)21 (12.7)0.217Heart failure3 (0.6)7 (4.2)0.004Hypertension278 (59)116 (69.9)0.017Dyslipidemia268 (56.9)106 (63.9)0.141Diabetes83 (17.6)45 (27.1)0.012Chronic lung disease16 (3.4)23 (13.9)< 0.001CKD stage ≥ 344 (9.3)28 (16.9)0.013CVD (previous stroke or TIA)38 (8.1)18 (10.8)0.354Alcohol drinking67 (15.3)30 (18.9)0.363Smoking67 (14.2)41 (24.7)0.003Visual impairment289 (61.4)97 (58.4)0.568Hearing impairment148 (31.4)58 (34.9)0.461Hospital visit during a past year403 (85.6)142 (85.5)1Falling during a past year80 (17)28 (16.9)1ASA classification, median (IQR)2 (2,3)3 (2,3)< 0.001Revised Cardiac Risk Index< 0.0010315 (66.9)72 (43.4)1130 (27.6)73 (44)226 (5.5)21 (12.7)Cardiac risk stratification surgical procedure< 0.001 High-risk106 (22.6)66 (40) Intermediate-risk364 (77.4)99 (60)Preoperative anemia260 (55.2)125 (75.3)< 0.001Albumin, median (IQR)4 (3.7,4.3)3.8 (3.3,4)< 0.001CrCl, median (IQR)64 (50,79.2)55.7 (43,71.8)< 0.001Mini-Cog score, median (IQR)2 (1,3)2 (1,3)0.1Frail by CFS152 (62)93 (38)< 0.001Frail by mFI-1142 (50.6)41 (49.4)< 0.001Frail by FRAIL scale56 (54.4)47 (45.6)< 0.001IQR Interquartile range, BMI Body mass index, CKD Chronic kidney disease, CVD Cerebrovascular disease, TIA Transient ischemic attack, ASA American Society of AnesthesiologistCrCl Creatinine clearance, CFS Clinical frail scale, mFI-11 Modified frailty index-11
Univariate logistic analysis demonstrated that frailty was associated with postoperative complications regardless of which criteria were used: CFS (OR = 2.81, 95% CI: 1.93–4.09, p<0.001); mFI-11 (OR= 3.43, 95% CI: 2.11,5.58, p<0.001); and FRAIL scale (OR=3.01, 95% CI: 1.92,4.72, p<0.001) (Table 4). A multiple logistic regression analysis was performed to adjust for potential confounding variables. Only the CFS was found to be a significant predictor of postoperative complications (OR =2.39, 95% CI: 1.42–4, p<0.001) (Table 4).Table 4. Univariate and multivariate analysis of factors associated with postoperative complications based on Clavien-Dindo classification (CDC)Factor associated with CDC ≥ 2UnivariateMultivariateOR (95%CI)p-valueOR (95%CI)p-valueSex: female vs. male0.54 (0.37,0.79)0.0010.56 (0.32,0.97)0.038DM1.73 (1.14,2.64)0.0111.56 (0.9,2.69)0.115CLD4.51 (2.27,8.94)< 0.0012.02 (0.88,4.66)0.098CKD1.82 (1.08,3.06)0.0230.56 (0.28,1.14)0.111ASA classification3.84 (2.62,5.63)< 0.0011.48 (0.9,2.44)0.118CRSP: Intermediate-risk vs. High-risk0.44 (0.3,0.65)< 0.0010.39 (0.22,0.7)0.001Albumin level0.32 (0.22,0.46)< 0.0010.46 (0.3,0.73)< 0.001Frailty diagnosed by CFS2.81 (1.93,4.09)< 0.0012.39 (1.42,4)< 0.001Frailty diagnosed by mFI-113.43 (2.11,5.58)< 0.0011.62 (0.85,3.09)0.145Frailty diagnosed by FRAIL scale3.01 (1.92,4.72)< 0.0011.71 (0.96,3.07)0.071ASA American Society of anesthesiologist, CDC Clavien-Dindo classification, CFS Clinical frail scale, CKD Chronic kidney disease, CLD Chronic lung disease, CRSP Cardiac risk stratification surgical procedure, DM Diabetes mellitus, mFI-11 Modified frailty index-11
Comparison of the predictive ability of the ASA classification, frailty assessment scales, and their combination for postoperative complications
The mFI-11 had the highest AUC at 0.635 (95% CI: 0.5902–0.6794), followed by the FRAIL scale at 0.632 (95% CI: 0.5881–0.6756), and the CFS at 0.619 (95% CI: 0.5742–0.6637) (Figure 2). The AUC of the ASA classification was 0.657 (95% CI: 0.6152–0.6988) (Figure 2). The predictive ability of the ASA classification was similar to that of the frailty assessment tools. Differences were observed between the ASA classification and the CFS (p = 0.1904), mFI-11 (p = 0.4058), and FRAIL scale (p = 0.3099). When the ASA classification was combined with each frailty scale, the predictive ability improved. Specifically, the AUC increased to 0.704 (95% CI: 0.6595–0.7479), 0.701 (95% CI: 0.656–0.746), and 0.693 (95% CI: 0.6476–0.7383) for the CFS, mFI-11, and FRAIL scale, respectively (Figures 3). The differences in predictive ability among the frailty scales were not significant. Nonetheless, significant differences were observed between when the ASA classification was combined with each frailty scale: ASA+CFS (p < 0.001), ASA+mFI-11 (p < 0.001), and ASA+FRAIL scale (p = 0.0015).Fig. 2. Receiver operating characteristic (ROC) analysis of the CSF(A), mFI-11 (B), FRAIL scale (C), ASA classification (D), and all combined (E) in predicting postoperative complications, according to Clavien–Dindo classification ≥ 2Fig. 3Receiver operating characteristic (ROC) analysis of combined ASA classification and CSF (A), combined ASA classification and mFI-11 (B), and combined ASA classification and FRAIL scale (C) in predicting postoperative complications, according to Clavien–Dindo classification ≥ 2
Discussion
Our study demonstrated that frailty, as measured using the CFS, mFI-11, and FRAIL scale, was common among older Thai patients undergoing intermediate- to high-risk non-cardiac surgery. Frailty prevalence varied across the different tools, consistent with the findings of studies showing that instrument choice influences frailty estimates [18, 30], reflecting differences in how each tool defines and measures frailty and underscoring the need for context-specific selection in clinical practice. [8, 18, 30–32].
Association between frailty and postoperative complications
Frail patients were more often classified as having higher Clavien–Dindo grades, reflecting more severe postoperative complications. Overall, postoperative morbidity was significantly higher in frail than non-frail patients across all frailty assessment tools, consistent with the findings of previous studies showing frailty as a predictor of adverse surgical outcomes [8, 21, 32–34]. In multivariable models, only the CFS remained an independent predictor, which may be explained by the broader scope of the CFS, which incorporates both functional ability and mental status, providing a more comprehensive assessment of patient vulnerability. By comparison, the FRAIL scale focuses primarily on physical performance, while the mFI-11 emphasizes comorbidities and activity limitations. Prior studies similarly reported the CFS as a strong predictor of complications in older surgical patients [35]. However, some investigations have demonstrated significant associations with the mFI-11 [21, 36], while others found no predictive value for any frailty tool [30]. Overall, these findings highlight that while frailty is consistently linked to poorer outcomes, the predictive accuracy varies depending on the assessment instrument used [8, 21, 30, 32–36].
Specific postoperative outcomes and frailty
Frailty identified by the CFS was associated with a greater need for blood transfusions and more frequent unplanned returns to the operating room. Interestingly, frail patients exhibited a lower incidence of cardiac complications than non-frail patients. This unexpected finding may reflect selection bias, as the frailest patients with severe cardiac disease are not offered surgery or are managed more conservatively.
Additionally, frailty was consistently linked to prolonged hospital stay across all assessment tools, indicating increased healthcare resource utilization. Similarly, previous studies have shown that frailty indices predict longer LOS and higher hospital costs [37–39].
Frailty and 30-day mortality
Regarding mortality, the mFI-11 exhibited a stronger association with 30-day mortality than did the CFS or FRAIL scale, likely due to its inclusion of comorbidities that are closely tied to short-term survival. This pattern is consistent with the findings of other studies reporting higher 30-day mortality among patients classified as frail by the mFI-11 [36, 40]. The discrepancy may reflect the broader scope of the mFI-11, which incorporates comorbidities and functional status, thereby providing a more comprehensive risk profile. Conversely, Narula et al. [41] demonstrated that frailty assessed with the CFS was significantly associated with 30-day mortality; other investigators have found similar associations using the FRAIL scale [42]. This suggests that different tools may have complementary strengths depending on the outcome of interest [36, 40–42].
Predictive ability of the frailty tools for postoperative complications
Regarding predictive performance, all three frailty measures exhibited moderate ability to discriminate postoperative complications. While none clearly outperformed the ASA classification alone, combining frailty assessments with ASA improved overall risk prediction, which is consistent with the results of prior studies suggesting that frailty provides complementary prognostic information and should be incorporated into existing risk assessment models [18, 30, 43, 44].
Strengths and limitations
The strengths of this study include its prospective design, large sample size, and the use of multiple validated frailty instruments. Nonetheless, its single-center setting limits generalizability, and the observational design introduces potential biases such as selection bias, information bias, and residual confounding. Additionally, only short-term (30-day) outcomes were assessed, and long-term frailty consequences were not captured.
Conclusion
Frailty is a significant predictor of postoperative complications in older patients undergoing non-cardiac surgery. The CFS, mFI-11, and FRAIL scale are feasible tools for assessing frailty in this patient population. When combined with the ASA classification, they enhanced predictive accuracy, with the CFS demonstrating a superior predictive ability for postoperative complications. Incorporating frailty assessments into routine preoperative evaluations can improve patient outcomes by identifying those at a higher risk of adverse events and tailoring perioperative care accordingly. Future studies should focus on refining frailty assessment methods and exploring interventions to mitigate the impact of frailty on surgical outcomes.
The reference list from the paper itself. Each links out to its DOI / PubMed record.
- 1Office WS-EAR. Thailand’s leadership and innovations towards healthy ageing. World Health Organization; 2023. https://www.who.int/southeastasia/news/feature-stories/detail/thailands-leadership-and-innovation-towards-healthy-ageing.
- 2Ageing and health. World Health Organization. 2022. https://www.who.int/news-room/fact-sheets/detail/ageing-and-health.
- 3Population ageing in Thailand: lessons from one of the most aged ASEAN Member States. 2021. https://www.eria.org/uploads/media/Research-Project-Report/2021-06/Vol-1_00-Lessons-from-One-of-the-Most-Aged-ASEAN-Member-States.pdf. Accessed 10 Mar 2024.