Impact of transferrin levels on iron accumulation in transfusion-dependent beta-thalassemia: A genotype-specific analysis
Yidan Liang, Xinhua Zhang, Binbin Huang, Yushan Huang, Liuhua Liao, Yueyan Huang, Ken Huang, Jinquan Lao, Xiaoqin Feng, Bin Lin, Xingjiang Long, Zhixiang Liu, Weijian Zhu, Lian Yu, Deguo Tang, Tianyu Zhong, Yuhua Ye, Xiangmin Xu

TL;DR
This study finds that higher transferrin levels are linked to lower risk of iron overload in beta-thalassemia patients, with differences based on genetic type.
Contribution
The study is the first to show a significant negative correlation between transferrin and serum ferritin in transfusion-dependent beta-thalassemia patients.
Findings
Higher transferrin levels are associated with lower serum ferritin risk in TDT patients.
b0/b0 genotype patients show more severe clinical features compared to b0/b+ genotype patients.
A dose-response relationship was found between transferrin and serum ferritin levels.
Abstract
Serum ferritin (SF) monitors secondary iron overload in beta-thalassemia (b-thalassemia). Transferrin (TRF) has been shown to reverse iron accumulation in experimental models, but its role in transfusion-dependent beta-thalassemia (TDT) patients remains unclear. This study aims to explore the relationship between TRF and SF in TDT patients and to reveal the unique connection between specific genotypes and iron metabolism, providing potential therapeutic targets for clinical practice. This cross-sectional study includes 817 TDT patients (b0/b0 genotype: n=560; b0/b+ genotype: n=257). We use genotype-phenotype analysis and employ logistic regression and restricted cubic spline (RCS) curves to assess the association between TRF and SF. Significant differences were observed between the b0/b0 and b0/b+ genotypes in terms of age at first transfusion, transfusion requirements, chelation…
Genes, proteins, chemicals, diseases, species, mutations and cell lines named across the full text — each resolved to its canonical identifier and authoritative record.
Click any figure to enlarge with its caption.
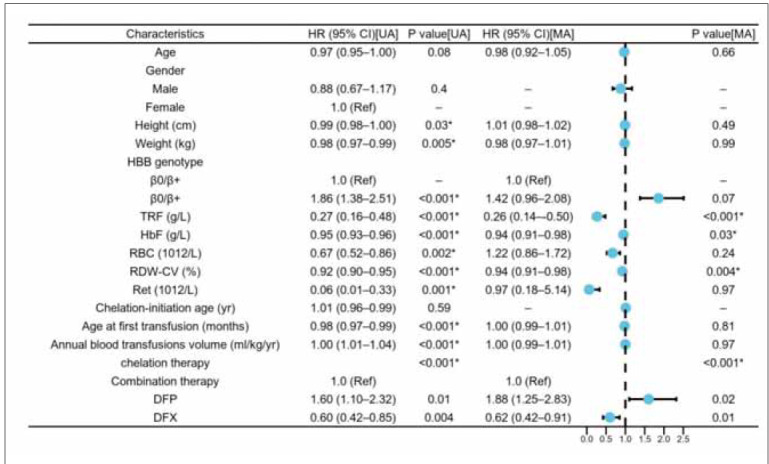 Figure 1
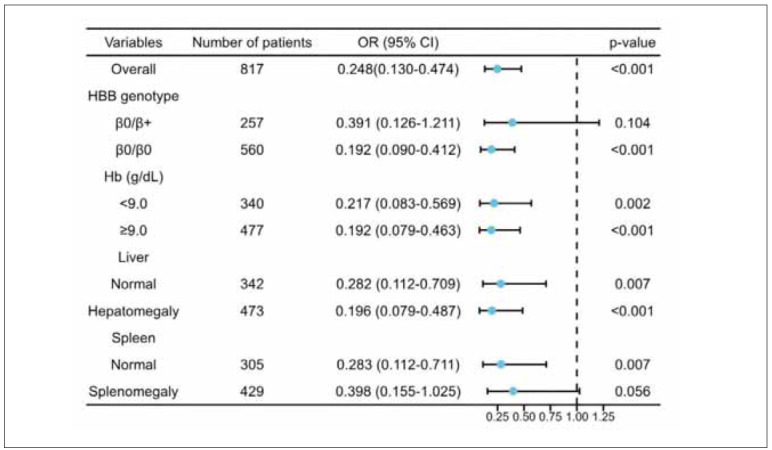 Figure 2
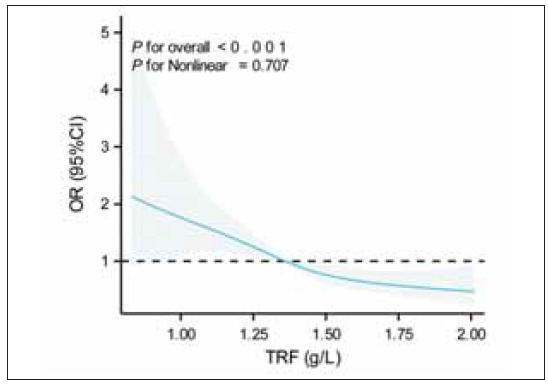 Figure 3
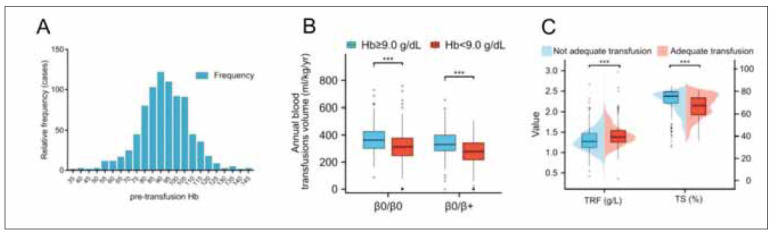 Figure 4
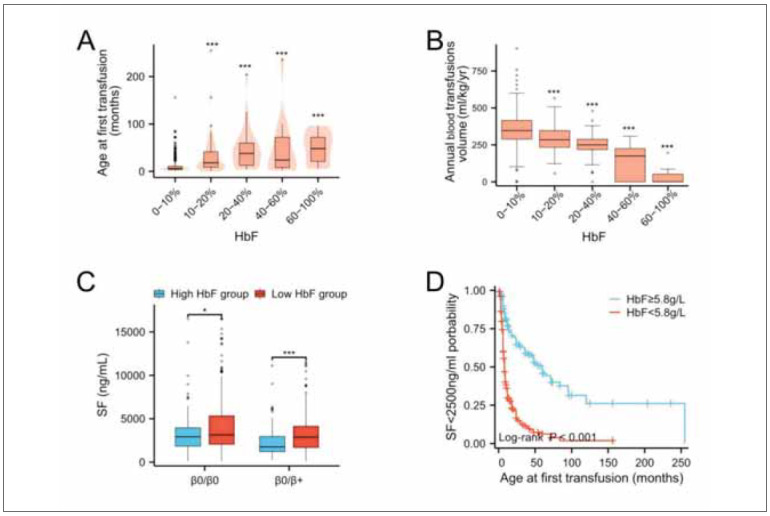 Figure 5
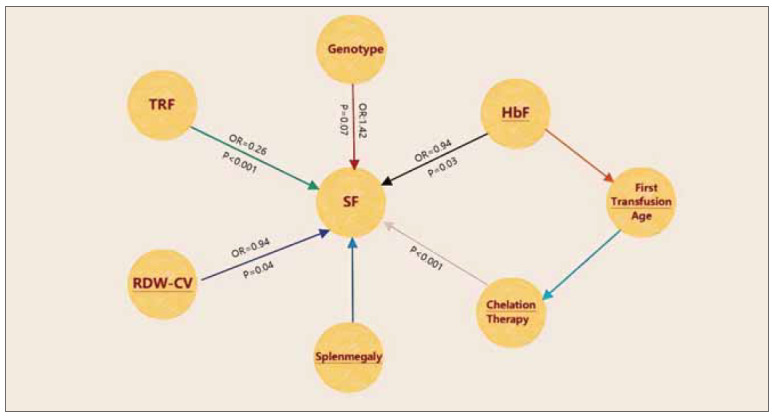 Figure 6
| Clinical and phenotypic indices | Total (n=817) | β0/β0 (n=560)† | β0/β+ (n=257)† |
|
|---|---|---|---|---|
| Female, n (%) | 352 (43.0) | 234 (66.5) | 118 (33.5) | 0.27 |
| Age (y) | 10.1 (7.13–13.0) | 9.8 (7.0–13.0) | 11.0 (8.0–14.0) | 0.003 |
| High (cm) | 130.0 (115.0–145.0) | 128.5 (114.0–143.0) | 133.0 (118.0–148.4) | 0.004 |
| Weight (kg) | 26.0 (19.5–36.0) | 25.3 (19.0–35.5) | 27.6 (20.5–37.4) | 0.04 |
| Age at first transfusion<br>(months) | 8.0 (5.0–18.0) | 6.0 (4.0–10.0) | 12.0 (7.0–36.0) | <0.001 |
| Chelation-initiation age (yr) | 4.0 (2.5–6.0) | 3.0 (2.0–5.0) | 5.0 (3.0–6.2) | <0.001 |
| Annual blood transfusions<br>volume (mL/kg/yr) ‡ | 333.3 (266.7–402.7) | 342.8 (274.2–411.1) | 313.0 (251.1–376.1) | <0.001 |
| Haematological parameters | ||||
| Hb (g/L) | 92.0 (83.0–102.0) | 92.0 (83.0–102.0) | 93.0 (84.0–102.0) | 0.48 |
| RBC (1012/L) | 3.4 (3.1–3.8) | 3.3 (2.9–3.7) | 3.6 (3.3–3.9) | <0.001 |
| RDW-CV (%) | 15.8 (13.7–20.5) | 14.8 (13.5–18.4) | 19.7 (14.8–25.1) | <0.001 |
| Hct (%) | 28.0 (25.2–31.0) | 27.7 (24.9–31.0) | 28.4 (26.1–31.1) | 0.06 |
| Ret (1012/L) | 0.03 (0.02–0.06) | 0.02 (0.02–0.04) | 0.06 (0.03–0.13) | <0.001 |
| HbF (g/L) | 3.16 (1.71–6.36) | 2.56 (1.42–5.18) | 5.72 (2.73–11.72) | <0.001 |
| Iron-related parameters | ||||
| SF (ng/mL) | 2852.7 (1676.8–4495.0) | 3060.9 (1947.1–4850.0) | 2265.4 (1483.9–3412.4) | <0.001 |
| TS (%) | 75.7 (57.9–88.5) | 76.3 (58.4–88.1) | 73.8 (54.7–89.7) | 0.29 |
| TRF (g/L) | 1.36 (1.20–1.53) | 1.36 (1.19–1.53) | 1.36 (1.21–1.53) | 0.75 |
| Ultrasonic imaging index, n (%) | ||||
| Hepatomegaly | 473 (57.8) | 323 (68.3) | 150 (31.7) | 0.85 |
| Splenomegaly | 429 (52.5) | 268 (62.5) | 161 (37.5) | <0.001 |
| Splenectomy | 81 (9.9) | 50 (61.7) | 31 (38.3) | 0.16 |
| Variables | Univariate analysis | Multivariable analysis | ||
|---|---|---|---|---|
| OR (95% CI) |
| OR (95% CI) |
| |
| Age | 0.97 (0.95–1.00) | 0.08 | 0.98 (0.92–1.05) | 0.66 |
| Gender | ||||
| Female | 1.0 (Ref) | |||
| Male | 0.88 (0.67–1.17) | 0.40 | – | – |
| Height (cm) | 0.99 (0.98–1.00) | 0.03* | 1.01 (0.98–1.02) | 0.49 |
| Weight (kg) | 0.98 (0.97–0.99) | 0.005* | 0.98 (0.97–1.01) | 0.99 |
| HBB genotype | ||||
| β 0/β + | 1.0 (Ref) | 1.0 (Ref) | ||
| β 0/β 0 | 1.86 (1.38–2.51) | <0.001* | 1.42 (0.96–2.08) | 0.07 |
| TRF (g/L) | 0.27 (0.16–0.48) | <0.001* | 0.26 (0.14–0.50) | <0.001* |
| HbF (g/L) | 0.95 (0.93–0.96) | <0.001* | 0.94 (0.91–0.98) | 0.03* |
| RBC (1012/L) | 0.67 (0.52–0.86) | 0.002* | 1.22 (0.86–1.72) | 0.24 |
| RDW-CV (%) | 0.92 (0.90–0.95) | <0.001* | 0.94 (0.91–0.98) | 0.004* |
| Ret (1012/L) | 0.06 (0.01–0.33) | 0.001* | 0.97 (0.18–5.14) | 0.97 |
| Chelation-initiation age (yr) | 1.01 (0.96–0.99) | 0.59 | – | – |
| Age at first transfusion (months) | 0.98 (0.97–0.99) | <0.001* | 1.00 (0.99–1.01) | 0.81 |
| Annual blood transfusion volume<br>(mL/kg/yr) | 1.00 (1.01–1.04) | <0.001* | 1.00 (0.99–1.01) | 0.97 |
| Chelation therapy | <0.001* | <0.001* | ||
| Combination therapy | 1.0 (Ref) | 1.0 (Ref) | ||
| DFP | 1.60 (1.10–2.32) | 0.01 | 1.88 (1.25–2.83) | 0.02 |
| DFX | 0.60 (0.42–0.85) | 0.004 | 0.62 (0.42–0.91) | 0.01 |
| Variables | Crude model | Adjusted model 1 | Adjusted model 2 | |||
|---|---|---|---|---|---|---|
| OR (95% CI) |
| OR (95% CI) |
| OR (95% CI) |
| |
| TRF category (median, range) | ||||||
| Q1 (1.09, <1.2 g/L) | Reference | Reference | Reference | |||
| Q2 (1.27, 1.2–1.36 g/L) | 0.66 (0.44–1.01) | 0.05 | 0.67 (0.44–1.04) | 0.07 | 0.56 (0.34–0.92) | 0.02* |
| Q3 (1.44, 1.36–1.53 g/L) | 0.51 (0.33–0.76) | 0.001* | 0.51 (0.33–0.78) | 0.002* | 0.42 (0.26–0.69) | 0.001* |
| Q4 (1.82, >1.53 g/L) | 0.36 (0.24–0.55) | <0.001* | 0.39 (0.25–0.61) | <0.001* | 0.32 (0.20–0.53) | <0.001* |
|
| <0.001* | <0.001* | <0.001* | |||
| Variables | Crude model | Adjusted model 1 | Adjusted model 2 | |||
|---|---|---|---|---|---|---|
| OR (95% CI) |
| OR (95% CI) |
| OR (95% CI) |
| |
| Pretransfusion Hb category | ||||||
| Pretransfusion Hb<9.0 g/dL | Reference | Reference | Reference | |||
| Pretransfusion Hb 9.0 g/dL | 0.80 (0.60–1.06) | 0.13 | 0.81 (0.59–1.10) | 0.17 | 0.79 (0.56–1.10) | 0.17 |
| Journal | Authors | PMID | Year | Case Presentation | Diagnosis | Treatment | Outcome |
|---|---|---|---|---|---|---|---|
| Genet<br>Mol Res | Estev IF<br>et al. | 21491373 | 2011 | Beta-thalassemia patients with HFE<br>gene mutations; analysis of serum<br>ferritin and transferrin saturation. | Beta-thalassemia | None<br>specified | Ferritin levels<br>variable regardless<br>of mutation type |
| Int J<br>Med Sci | Huang Y<br>et al. | 30745811 | 2019 | Patients with transfusion-dependent<br>and non-transfusion-dependent<br>thalassemia; evaluation of<br>erythropoiesis and iron metabolism. | Thalassemia | None<br>specified | Iron overload and<br>erythropoiesis<br>imbalance |
| J Blood<br>Med | Atmakusuma<br>TD et al.<br> | 33883962 | 2019 | Adult thalassemia intermedia patients;<br>correlation of serum ferritin, liver iron<br>concentration, and liver elastography. | Thalassemia<br>intermedia | Iron chelation<br>therapy | Correlation<br>between iron load<br>and liver stiffness |
| Transfus<br>Clin Biol | Rahmani R<br>et al. | 31679808 | 2019 | Beta-thalassemia major patients;<br>investigation of HFE gene mutations<br>and serum ferritin levels. | Beta-thalassemia<br>major | Iron<br>chelation | HFE mutations<br>affect serum<br>ferritin levels |
| Eur J<br>Haematol | Elalfy MS<br>et al. | 26018112 | 2016 | Young beta-thalassemia major<br>patients; evaluation of vitamin C as<br>adjuvant therapy to iron chelators. | Beta-thalassemia<br>major | Vitamin C and<br>iron chelation<br>therapy | Vitamin C<br>improves iron<br>chelation efficacy |
| Br J<br>Haematol | Zaman BA<br>et al. | 36535905 | 2023 | Transfusion-dependent thalassemia<br>patients; post-transfusion changes<br>in the erythropoietin-erythroferrone-hepcidin<br>axis. | Beta-thalassemia<br>major | Blood<br>transfusions | Suppression of<br>erythropoiesis<br>after transfusion |
| J Blood<br>Med | Atmakusuma<br>TD et al. | 34526831 | 2021 | Adult transfusion-dependent<br>beta-thalassemia patients; correlation<br>of transferrin saturation and serum<br>ferritin with bone mass density. | Beta-thalassemia | Iron<br>chelation<br>therapy | Transferrin<br>saturation<br>correlates with<br>bone density |
| Clin Lab | Saeidnia M<br>et al. | 35254032 | 2022 | Beta-thalassemia intermedia patients;<br>effects of curcumin on iron overload. | Beta-thalassemia<br>intermedia | Curcumin | Curcumin reduces<br>iron load |
| Am J<br>Hematol | Elalfy MS<br>et al. | 37401738 | 2023 | Infants with transfusion-dependent<br>thalassemia; evaluation of deferiprone<br>for iron shuttling to transferrin. | Transfusion-dependent<br>thalassemia | Deferiprone | Deferiprone effective<br>in preventing<br>iron overload |
| Cureus | Choudhary F<br>et al. | 36945272 | 2023 | Beta-thalassemia major patients;<br>correlation of T-regulatory<br>cellsand iron status. | Beta-thalassemia<br>major | None<br>specified | Ferritin levels<br>correlate with<br>T-regulatory cells |
| Hematology | Akrawinthawong<br>K et al. | 21418744 | 2011 | Transfusion-independent beta-thalassemia/<br>HbE patients; evaluation<br>of deferiprone’s effectiveness. | Beta-thalassemia/<br>HbE | Deferiprone | Deferiprone<br>reduces iron load<br>and oxidative stress |
| Clin<br>Pharmacokinet | Limenta LM<br>et al. | 21028920 | 2011 | Beta-thalassemia patients; impact<br>of splenectomy and iron status on<br>pharmacokinetics of deferiprone. | Beta-thalassemia | Iron<br>chelation<br>therapy | Splenectomy<br>affects iron chelation<br>efficacy |
| Indian J<br>Hematol<br>Blood Transfus | AlFadhli S<br>et al. | 29075067 | 2017 | Arab beta-thalassemia patients;<br>effects of HFE polymorphisms<br>on iron status. | Beta-thalassemia | None<br>specified | H63D polymorphism<br>alters iron<br>parameters |
| Mediterr<br>J Hematol<br>Infect Dis | Ragab SM<br>et al. | 25745546 | 2015 | Beta-thalassemia children;<br>study of serum haptoglobin and its<br>relation to erythropoietic activity. | Beta-thalassemia | Iron<br>chelation<br>therapy | Serum haptoglobin<br>correlates with<br>erythropoietic<br>activity |
| Phytother<br>Res | Mohammadi E<br>et al. | 29806132 | 2018 | Beta-thalassemia major patients;<br>effects of curcumin on iron<br>overload and liver function. | Beta-thalassemia<br>major | Curcumin | Curcumin<br>improves liver<br>function |
| Pediatr<br>Blood<br>Cancer | Inati A<br>et al. | 27576370 | 2017 | Pediatric thalassemia patients;<br>comparison of phlebotomy with<br>deferasirox for treating iron overload<br>post stem cell transplantation. | Thalassemia<br>major | Phlebotomy<br>and<br>deferasirox | Both<br>treatments reduce<br>iron burden |
| Eur J<br>Haematol | Ghoti H<br>et al. | 19793250 | 2010 | Multi-transfused sickle/beta-thalassemia<br>patients; assessment<br>of myocardial iron overload. | Sickle/beta-thalassemia | Iron<br>chelation<br>therapy | No evidence of<br>myocardial iron<br>overload |
- —National Key Research and Development Program of China (grant nos.2018YFA0507800 and 2018YFA0507803)
- —Open Project of BGI-Shenzhen, Shenzhen 518000, China (BGIRSZ20200008)
Peer Reviews
No public reviews on file for this paper yet. If you reviewed it on a platform where reviews are public (OpenReview, ICLR, NeurIPS, ICML), you can paste yours below so the community can read it here.
Videos
No videos yet. Explain this paper in a talk, walkthrough, or lecture? Add one.
Taxonomy
TopicsHemoglobinopathies and Related Disorders · Iron Metabolism and Disorders · Blood groups and transfusion
Introduction
Beta-thalassemia (β-thalassemia) is a common monogenic hereditary disorder caused by mutationsin the β-globin gene, affecting approximately 1% to 5% of the global population [1]. These mutations result in either reduced synthesis (β^+^ type) or complete absence (β^0^ type) of the β-globin chains, leading to a spectrum of clinical manifestations ranging from mild to severe [1] [2], including hepato splenomegaly, growth retardation, and skeletal deformities. β-thalassemia is categorised into non-transfusion-dependent beta-thalassemia (NTDT) and transfusiondependent beta-thalassemia (TDT) types based on the severity of clinical symptoms [3].
Patients with TDT require regular blood transfusions to suppress the accelerated apoptosis of erythroid precursors. While this essential treatment is life-sustaining, it leads to long-term iron overload [4] [5]. Increased intestinal iron absorption and secondary iron overload [6] can severely compromise patients’ health. Transferrin (TRF), the primary iron transport protein in plasma, is critical in regulating iron metabolism [7]. In β-thalassemia research, TRF has been shown to modulate iron metabolism by inducing hepcidin expression [8], demonstrating its potential toreduce iron accumulation in β-thalassemia mouse models [9] [10].
Serum ferritin (SF), another key biochemical marker, is commonly used to monitor iron overload in the body [11]. Changes in SF levels reflect fluctuations in iron storage and are closely linked to the long-term prognosis of patients [12] [13]. Elevated SF levels are typically associated with iron overload [14], particularly in TDT patients. Therefore, monitoring SF levels is crucial for assessing the effectiveness of iron chelation therapy [15]. In TDT patients, timely and effective management of iron overload is essential for preventing the development of complications such as heart disease, liver disorders, and other related conditions.
This study’s hypothesis is based on the observed phenomenon that patients with different β-thalassemia genotypes exhibit significant variations in iron overload. We propose that this difference may be partially attributed to the varying roles of TRF in iron metabolism. In specific genetic contexts, the expression and function of TRF may regulate iron absorption, utilisation, and storage through unknown mechanisms, thereby influencing the iron overload status of patients. In a large cohort study involving 817 TDT patients, we aim to analyse the interaction between TRF and iron overload markers, such as SF, to determine whether these interactions differ by genotype and assess their potential implications for disease management.
The discovery of this relationship may reveal new biomarkers or therapeutic targets that could be used to develop novel treatment strategies or optimise existing iron chelation therapies. For instance, if TRF is crucial in regulating iron absorption and storage, therapies targeting TRF might be more effective for patients with genotypes that result in higher TRF expression.
The primary objective of this study is to evaluate the specific role of TRF in managing iron overload and to understand how its dynamic relationship with SF influences iron metabolism. We plan to employ advanced biostatistical methods and bioinformatics tools to analyse clinical and biochemical data from patients, aiming to identify interaction patterns between TRF and SF and assess their potential impact on disease progression.
Additionally, by comparing data from patients with different genotypes, we hope to gain deeper insights into how the genetic background of iron metabolism affects treatment response. This analysis helps us understand why some patients respond poorly to standard therapies and may guide the shift toward more personalised treatment approaches.
Materials and methods
Experimental methods
Study design and participant selection
Approved by the Ethics Committee of Nanfang Hospital, Southern Medical University (Approval No. NFEC-2019-039), this study adheres to the Declaration of Helsinki, with informed consentobtained from all patients. Conducted between June 2019 and June 2022 across five provinces in southern China (Guangxi, Guangdong, Fujian, Jiangxi, and Hunan), the research aimed to investigate the iron metabolism characteristics of patients with TDT. A total of 1,020 patients were initially recruited from local medical institutions. After applying strict exclusion criteria, such as age under 3 years, pregnancy, or the presence of active inflammatory diseases, 817 eligible patients were included in the study. These patients were further classified into 560 β^0^/β^0^ homozygotes and 257 β^0^/β^+^ compound heterozygotes, with their HBB genotypes confirmed.
Genotype confirmation
The β-thalassemia genotypes of each participant were confirmed by collecting peripheral blood samples, with initial screening performed using reverse dot blot hybridisation (RDB) and gap-PCR. All samples were subsequently analysed using next-generation sequencing (NGS) technology to ensure the accuracy and reliability of the genotyping, allowing for a more detailed investigation of specific gene mutations and variations.
Clinical data collection
Comprehensive clinical data were collected through detailed medical record reviews and face-to-face interviews. The included basic demographic information (age, gender, weight, height), transfusion-related details (age at first transfusion, transfusion frequency), and detailed records of chelation therapy. All data were meticulously entered into a specially designed electronic database to ensure accuracy and facilitate subsequent analysis.
Physiological measurements
All patients underwent liver and spleen ultrasounds using high-resolution equipment provided byGE Healthcare. It allowed for a precise assessment of these key organs’ size and structural changes, which is crucial for monitoring disease progression and evaluating changes in iron overload.
Laboratory tests
(1) Hemoglobin HbA, HbA_2_, and HbF Measurement: Approximately 2 mL of venous blood was collected from each patient into an EDTA anticoagulation tube for haemoglobin analysis. The HbA, HbA_2_, and HbF levels were measured using high-performance liquid chromatography (HPLC) with the Bio-Rad Variant II system, following the manufacturer’s instructions. This method enables precise quantification of different haemoglobin subtypes, which is crucial for assessing haemoglobin synthesis and iron utilisation efficiency [16].
(2) Complete Blood Count: A full blood count was conducted using the Sysmex pocH-100i automated haematology analyser, providing data for a comprehensive assessment of the patient’s overall blood health.
(3) Iron Metabolism-Related Measurements: SF was measured using a chemiluminescent immunoassay on Siemens’ Dade Behring BN II system. Serum iron (SI) and total iron-binding capacity (TIBC) were determined using Leadman’s TIBC microporous method kit. Transferrin saturation (TS) was then calculated based on these values to evaluate iron metabolism comprehensively.
Data processing and analysis
Normality testing and inter-group comparison methods
At the initial stage of analysis, all variables underwent a normality test. For variables that did not follow a normal distribution, the Mann-Whitney U test was used to compare the two groups. Categorical variables were compared using the X^2^ test. The significance level for all statistical inferences was set at p<0.05.
Criteria for iron overload classification
According to the Chinese guidelines for diagnosing and treating TDT (Subspecialty Groups of Hematology, 2018) and related clinical observations, SF levels exceeding 2,500 ng/mL indicate severe iron overload. Based on this, SF levels were further categorised into 2,500 ng/mL and >2,500 ng/mL to investigate the impact of different iron overload states.
Core analysis of the relationship between TRF and SF
A multivariate logistic regression model analysed the relationship between TRF and SF levels. Initially, univariate logistic regression was employed to identify variables significantly associated with SF levels. All variables with p<0.1 were included in the multivariate model to explore potential associations between TRF and SF, with selection performed using a stepwise backward regression approach. The final model reported the odds ratios (ORs) and 95% confidence intervals (CIs) for each factor, directly reflecting the validation of the core research hypothesis.
Sensitivity analysis
A sensitivity analysis was conducted on the core results, with clinical stratification based on patients’ HBB genotype, pre-transfusion Hb levels, and liver and spleen size. This analysis aimed to assess the stability and consistency of the relationship between SF and TRF across different clinical subgroups.
Dose-response quantitative analysis
The dose-response relationship between TRF levels and the risk of elevated SF was further quantified using the restricted cubic spline (RCS) method. This analysis adjusted for all clinically and biologically relevant variables, offering a progressively detailed analysis from basic to more complex models.
Statistical tools and techniques
All basic descriptive and inferential statistical analyses were performed using SPSS software (version 23.0). For more complex graphical presentations and data analysis, the R language’s ggplot2 package (version 4.2.1) was employed to ensure the results’ accuracy and the charts’ professional quality.
Results
Genotype-phenotype analysis in β-thalassemia patients
We analysed clinical, haematological, iron-related biochemical, and abdominal ultrasound data from 817 patients, as summarised in Table 1. The median age of the patients was 10 years, with 43% female. Patients were classified as either β^0^/β^0^ or β^0^/β^+^ to examine the impact of genotype on disease severity. Patients in the b0/b0 group showed an earlier initiation of transfusion (p<0.001) and a higher transfusion demand (p<0.001) aimed at suppressing ineffective erythropoiesis (0.02×10^12^/L vs 0.06×10^12^/L, p<0.001), which in turn led to an earlier start of chelation therapy (p<0.001). Hematologically, the β^0^/β^0^ group had lower red blood cell (RBC) counts, lower red cell distribution width (RDW), and lower fetal haemoglobin (HbF) levels, with splenomegaly being more common. These findings likely illustrate the influence of long-term transfusion in ameliorating anaemia, progressively diminishing red blood cell size heterogeneity [17]. Regarding iron metabolism, the majority (758/817, 92.7%) of patients suffered from iron overload, with 61.3% (465/758) having SF levels exceeding 2,500 ng/mL. Overall, 61.9% (347/560) of patients in the b0/b0 group and 46.7% (120/257) of patients in the β^0^/β^+^ group had SF levels exceeding 2,500 ng/mL, with significantly higher SF levels observed in the b0/b0 group (p<0.001). The β^0^/β^0^ patients comprised 68.5% (560/817) of the cohort. The median TRF level was 1.36 g/L, below the normal range (2.0–3.6 g/L), with only 11 patients within the normal range. However, no significant differences in TS or TRF levels were observed between the β^0^/β^0^ and β^0^/β^+^ groups.
The median duration of chelation therapy was 5.5 years. All patients required chelation therapy during the study period and adhered to daily medication as prescribed by their physicians. Regarding chelation regimens, 31.8% of patients used deferiprone, 32.8% were treated with deferasirox monotherapy, and 35.4% received a combination or alternation of two chelating agents.
Logistic regression analysis of clinical factors affecting SF levels
The study used logistic regression analysis to explore the clinical factors influencing SF levels (Table 2, Figure 1). The multivariable-adjusted results showed that lower TRF levels were significantly associated with higher SF levels (OR=0.26, p<0.001), suggesting that TRF may play a key role in regulating iron overload. Other significant factors included HbF levels (OR=0.94, p=0.03), coefficient of variation of red cell distribution width (RDW-CV) (OR=0.94, p=0.004), and chelation therapy (p<0.001). However, genotype (β^0^/β^0^vs. β ^0^/β ^+^) was not significantly associated with an increased risk of elevated SF levels (OR=1.42, p=0.07). These findings suggest that TRF and HbF may have independent regulatory roles in iron overload management.
Table 2: Note: Abbreviations: RBC, red blood cell count; RDW-CV%, red cell distribution width-coefficient of variation; Ret, reticulocytes; HbF, fetal haemoglobin; TRF, serum transferrin; DFP, deferiprone; DFX, deferasirox; OR, odds ratio; CI, confidence interval. * represents a significant difference, p<0.05.
Correlation between relevant clinical factors and SF in logistic regression analysis.<br>Note: Hb, haemoglobin; OR, odds ratio; CI, confidence interval
Stratified sensitivity analysis of the association between TRF and SF based on anaemia-related indicators
To assess the association between TRF and SF, we conducted a stratified analysis based on anaemiarelated indicators, including HBB genotype, Hb levels, and liver and spleen size. In these stratified models, the strength of the association between TRF and SF remained consistent with the primary model (Figure 2). The sensitivity analysis confirmed that the correlation between TRF and SF remained robust across various subgroups.
Forest plot of sensitivity analysis for the association between TRF and SF.<br>Note: The results indicate a strong correlation between TRF and SF
Linear negative correlation between TRF and SF
To further investigate the relationship between TRF and SF, patients were divided into quartiles (Q1-Q4) based on their TRF levels, and the association between TRF and SF was analysed (Table 3). The results indicated higher TRF levels (Q3 and Q4) were significantly associated with lower SF levels. Notably, in the adjusted model, patients in the Q2 group had a significantly lower risk of elevated SF compared to the Q1 group (OR=0.56,* p*=0.02). RCS curve analysis further confirmed the negative linear correlation between TRF and SF (non-linearity p=0.707, Figure 3), suggesting that patients with lower TRF levels are more prone to iron overload. TRF may hold significant clinical value as a predictor of iron overload.
Table 3: Association between TRF values and SF.Note: Crude model: unadjusted model; adjusted model 1: adjusted for age, height, weight and HbF; Adjusted model 2: adjusted for age, height, weight, HbF, RBC, RDW, Ret, HBB genotype, age at first transfusion, annual blood transfusion volume and chelation therapy. Abbreviations: TRF, transferrin; OR, odds ratio; CI, confidence interval. * represents a significant difference, p<0.05.
RCS curve analysis of TRF levels and pathological risk.<br>Note: The RCS curve analysis demonstrates the association between TRF and SF after adjusting for age, height, weight,HbF, RBC, RDW, Ret, HBB genotype, age at first transfusion, and annual transfusion volume. The results confirmed a negative linear correlation between TRF and SF. TRF, transferrin; OR, odds ratio; CI, confidence interval.
Preoperative Hb levels and their relationship with SF
According to the Thalassemia International Federation (TIF) guidelines, preoperative Hb levels above 9.0 g/dL are classified as »adequate transfusion. « In this study, only 58.3% of patients successfully received »adequate transfusion« to meet this standard (Figure 4A and Figure 4B). Notably, patients who achieved adequate transfusion also tended to have higher TRF levels and lower TS% (Figure 4C). However, in both the unadjusted and adjusted models, there was no significant difference in the risk of elevated SF between patients who received adequate transfusion and those who did not (Table 4).
*Impact of blood transfusions on TRF levels.<br>Note: (A) Frequency distribution of pre-transfusion Hb levels in the cohort of β-thalassemia patients. (B) Annual transfusion volume based on Hb levels before transfusion (≥9.0 g/dL and <9.0 g/dL) stratified by HBB genotype. (C) TRF and TS levels under different transfusion conditions. The box plots within the dot plots depict quartiles and outliers. Data are presented as mean ± standard error. **p<0.001. Hb, haemoglobin; TRF, transferrin; TS, transferrin saturation.
The protective role of HbF levels on SF
Finally, the study investigated the impact of HbF levels on SF. Previous research has demonstrated that HbF reactivation significantly benefits patients with β-thalassemia [18] [19] [20]. Patients with higher HbF levels typically experience a later onset of transfusion (Figure 5A) and exhibit lower transfusion dependency (Figure 5B). These patients also have significantly lower SF levels and more favourable clinical outcomes (Figure 5C and Figure 5D). These findings support the role of HbF reactivation as an effective therapeutic strategy, particularly in reducing iron overload and improving clinical prognosis. To further clarify the underlying mechanisms, a schematic illustrating the relationships between TRF, SF, and other clinical variables is presented in Figure 6.
*Relationship between HbF and SF in patients with severe β-thalassemia.<br>Note: HbF levels were categorised as high or low based on cut-off values determined by receiver operating characteristic (ROC) curve analysis. Kaplan-Meier curves were used to compare the probability of SF<2,500 ng/mL between high and low HbF groups, with differencesevaluated using log-rank analysis. (A) Elevated HbF levels were associated with delayed initiation of RBC transfusion. The box plots within the violin plots depict quantiles and outliers. (B) Relationship between RBC transfusions and HbF levels. (C) In the HBBgenotype group, SF levels were significantly lower in patients with high HbF. (D) Kaplan-Meier analysis shows the impact of the first transfusion age on iron overload in different HbF groups. Grey dots represent outliers in the box plot. Data are presented as mean ± SEM. *p<0.05, **p<0.001. SF: serum ferritin; HbF: fetal haemoglobin.
Schematic diagram of the association between TRF, SF, and other clinical variables.<br>Note: transferrin (TRF), SF, fetal haemoglobin (HbF), coefficient of variation of red cell distribution width (RDW-CV).
Discussion
New findings in β-thalassemia
The primary findings of this study reveal a significant negative correlation between TRF levels and SF levels in patients with TDT. Multivariable-adjusted logistic regression analysis demonstrated that higher TRF levels were significantly associated with a reduced risk of elevated SF levels, further supporting the key role of TRF in regulating iron overload. This result suggests that TRF may serve as an important biomarker for managing iron overload in TDT patients. Additionally, the study found that despite frequent blood transfusions and iron chelation therapy, most TDT patients had TRF levels below the normal range. This observation implies that iron overload might suppress the synthesis or release of TRF through specific mechanisms, leading to decreased TRF levels. These findings underscore the importance of TRF in managing iron overload in TDT patients and provide new directions for investigating the mechanisms of TRF in iron metabolism.
Role of TRF in iron metabolism regulation in TDT patients
These findings closely align with existing literature, highlighting the crucial role of TRF in maintaining iron metabolism balance, particularly under high iron overload conditions. It further reinforces the central position of TRF in iron metabolism regulation. Studies by Chen et al. [21] and Li et al. [10] indicate that TRF expression levels are closely related to iron load in the body and can influence SF levels by regulating hepatic iron storage. These studies highlight TRF’s critical role in maintaining iron metabolism balance, especially under high iron load conditions, where TRF’s role in regulating iron storage and transport becomes more important.
Unlike previous studies, this research not only validates the pivotal role of TRF in iron load regulation in TDT patients but also reveals a significant negative feedback relationship between TRF and SF levels. This negative correlation suggests that TRF may contribute to maintaining iron homeostasis by reducing excessive iron accumulation, which is important for understanding and managing iron overload in TDT patients. Additionally, TRF as a potential biomarker and therapeutic target opens new avenues for managing iron in TDT patients.
Literature analysis and discussion
A comprehensive review of articles published from 2010 to 2024 in the PubMed database wasconducted using the keywords »In patients with Transferrin, Serum Ferritin« and »Beta-Thalassemias«. Table 5 shows these 22 studies comprehensively analyse the latest findings on clinical manifestations, diagnostic methods, treatment, and prognosis of β-thalassemia patients. The research reveals that iron overload is prevalent among β-thalassemia patients, with significant variability in ferritin levels unrelated to HFE gene mutations [22] [23]. The imbalance in ironmetabolism, combined with ineffective erythropoiesis, exacerbates health issues in these patients [4]. Chelation therapy is widely used in treatment [24] [25] [26], including deferoxamine [27] [28] [29] and vitamin C as adjunct therapy [24]. Some studies have also explored the potential benefits of natural compounds like curcumin in reducing iron load and improving liver function [30] [31]. Additionally, iron overload is linked to health issues in other systems, such as increased oxidative stress [25] [32] and depression [33]. Overall, these studies underscore the importance of managing iron overload to improve prognosis in β-thalassemia patients and highlight the need to explore new therapeutic strategies to address multisystem health impacts and enhance patients’ quality of life.
Clinical significance
This study demonstrates that dynamic changes in TRF levels are more sensitive to iron load increases in the early stages and can serve as an important biomarker for monitoring iron metabolism imbalance. Under iron overload conditions, changes in TRF often precede those in storage markers like SF, making TRF highly promising for early-stage iron load assessment.
In contrast, SF only rises significantly once iron overload reaches a certain threshold. While MRI can accurately assess tissue iron deposition, its high cost and complexity limit its application in early diagnosis. Therefore, incorporating TRF into routine monitoring could enable clinicians to implement timely interventions in the early stages of iron overload, thus more effectively preventing iron accumulation and associated complications.
The 2021 Guidelines for the Treatment of Thalassemia recommend assessing iron overload using SF levels and cardiac and hepatic MRI. However, TRF has not yet been included as a routine monitoring parameter. Dynamic TRF monitoring can aid clinicians in accurately assessing iron load and guide individualised chelation therapy. For high-risk TDT patients, regular TRF monitoring allows for timely identification of iron overload risk, enabling adjustments to chelation dosage and frequency tailored to the patient’s specific needs. This approach optimises treatment and reduces the risk of complications such as cardiac, endocrine, and hepatic dysfunction. For patients with elevated TRF levels and complex iron load management, closer monitoring and adjustments to transfusion strategies and chelation therapy may be necessary to ensure long-term treatment balance and mitigate the risk of complications.
Additionally, studies indicate that increasing fetal haemoglobin (HbF) levels can reduce transfusiondemand, thereby decreasing iron load. Increased HbF can improve haemoglobin levels in patients,reduce dependence on exogenous iron, and further enhance the value of TRF monitoring.
In conclusion, this study supports TRF as a crucial monitoring tool for individualised treatment in TDT patients. Combined with HbF monitoring, TRF enables precise prediction and prevention of iron overload-related complications, enhancing patients’ quality of life and clinical outcomes. This integrated strategy not only advances new directions in iron metabolism management but also lays the foundation for developing personalised treatment plans with broad clinical applications.
Limitations and future research directions
The main limitation of this study lies in its cross-sectional design, which restricts causal inference between TRF and SF. Additionally, adherence to chelation therapy was not fully assessed, potentially affecting the accuracy of the results. Future studies should adopt a longitudinal design to track dynamic changes in TRF and SF and further explore their causal relationship.
At the same time, genome-wide association studies (GWAS) and other methods can analyse genetic polymorphisms affecting TRF expression and function, revealing regulatory mechanisms and providing new insights for individualised treatment in TDT patients.
This study found that elevated TRF levels are often accompanied by a decline in SF, suggesting apossible dose-dependent relationship between them. However, the precise causal relationship remains unclear. To further understand whether TRF directly regulates systemic iron load, future studies should utilise animal models or clinical longitudinal studies to investigate TRF’s role in iron metabolism. For instance, in thalassemia mouse models, modulating TRF expression and observing its effects on iron load and SF levels may provide more direct evidence supporting TRF’s role in managing iron overload.
Iron metabolism is a complex network of regulatory interactions involving transferrin (TRF), ferritin,hepcidin, ferroportin, and divalent metal transporter 1 (DMT1). Future research should focus on the interplay between TRF and these proteins under different iron overload conditions, providing a broader perspective on TRF’s functional role in iron metabolism.
Longitudinal clinical studies can help evaluate the dynamic relationship between TRF and SF, clarifying their temporal sequence and verifying TRF’s potential regulatory role in iron metabolism. If increasing TRF is proven to directly reduce iron overload, it could serve as a therapeutic target, enabling more effective personalised treatment strategies for patients with transfusion-dependent thalassemia (TDT).
Future treatment approaches should further advance toward precision and individualised therapy. By considering patients’ genotypes and iron metabolism profiles, clinicians can develop more targeted strategies to manage iron overload and reduce related complications. Personalised treatment plans may include gene therapy, targeted drugs, and novel combination therapies, particularly optimised for patients with specific genetic profiles.
Conclusion
This study investigates the relationship between TRF and SF in patients with TDT. Genotypic and phenotypic analyses were conducted on 817 patients, revealing a significant inverse linear relationship between elevated TRF levels and reduced SF levels. Logistic regression and RCS analyses further confirmed this dose-response relationship, suggesting that TRF may be protective in regulating iron overload. These findings indicate that TRF is not only associated with iron metabolism but may also serve as an important biomarker for managing iron overload and preventing its related complications.
This study identifies TRF as a novel biomarker for managing iron overload in patients with β-thalassemia. Monitoring and regulating TRF levels may be crucial in reducing iron burden and preventing complications caused by iron overload, such as heart disease and liver disorders. Clinically, assessing TRF levels could enable physicians to predict the risk of iron accumulation more accurately, leading to the development of more personalised and effective treatment strategies. Moreover, these findings provide a theoretical foundation for future therapeutic innovations.
Although this study provides valuable insights into the relationship between TRF and SF, several limitations should be acknowledged. First, it is difficult to establish a causal relationship as a cross-sectional study. Second, the sample was limited to TDT patients with specific genotypes, which may affect the generalizability of the findings. Additionally, the study did not account for all variables influencing iron metabolism, such as dietary habits and other underlying health conditions, which may have impacted the results.
Future research should consider adopting a longitudinal design to more accurately determine the causal relationship between TRF and SF. Including a broader population and a wider range of variables will also help validate the universality and robustness of these findings. Moreover, exploring the role of TRF in other types of iron overload disorders presents a promising avenue for future investigation. Based on these findings, developing TRF-targeted therapies could offer a novel strategy for treating iron overload diseases, which warrants further exploration and validation in future clinical trials.
Dodatak
Acknowledgements
None.
Ethics statement
This study was approved by the ethics committee of Nanfang Hospital, Southern Medical University (approval no. NFEC-2019-039), and the ethics committees at each local hospital. All subjects and/or their guardians provided signed informed consent for participation. This study adhered to the Declaration of Helsinki.
Author contributions
YL designed the study. YL and YH analysed the data. YL and YY drafted the manuscript. BL conducted the experiments. XZ, BH, LL, YH, KH, JL, XF, XL, ZL, WZ, LY, DT, and TZ were responsible for patient recruitment. XX supervised the research. All authors reviewed and approved the final manuscript.
Funding
This work was supported by grants from the National Key Research and Development Program of China (grant nos.2018YFA0507800 and 2018YFA0507803) and the Open Project of BGI-Shenzhen, Shenzhen 518000, China (BGIRSZ20200008).
Data availability
All data can be provided as needed.
Conflict of interest statement
All the authors declare that they have no conflict of interest in this work.
List of abbreviations
CIs, confidence intervals;<br>DMT1, divalent metal transporter 1;<br>GWAS, genome-wide association studies;<br>Hb, haemoglobin;<br>HbF, fetal haemoglobin;<br>HPFH, hereditary persistence of fetal haemoglobin;<br>NGS, next-generation sequencing;<br>NTDT, non-transfusion-dependent beta-thalassemia;<br>ORs, odds ratios;<br>PCR, polymerase chain reaction;<br>RBC, red blood cell;<br>RCS, restricted cubic spline;<br>RDB, reverse dot blot;<br>RDW, red cell distribution width;<br>RDW-CV, coefficient of variation of red cell distribution width;<br>ROC, receiver operating characteristic;<br>SF, serum ferritin;<br>SI, serum iron;<br>TDT, transfusion-dependent beta-thalassemia;<br>TIBC, total iron-binding capacity;<br>TIF, Thalassemia International Federation;<br>TRF, transferrin;<br>TS, transferrin saturation;<br>β-thalassemia, beta-thalassemia.
The reference list from the paper itself. Each links out to its DOI / PubMed record.
- 160961919201710.1038/gim.2016.173 Origa R Genet Medb-Thalassemia 27811859 · doi ↗ · pubmed ↗
- 2329433539201810.15537/smj.2018.4.21360 Alaithan M A Abdulazeez S Borgio J Saudi Med JA comprehensive review of the prevalence of beta globin gene variations and the co-inheritance of related gene variants in Saudi Arabians with beta-thalassemia 29619482 PMC 5938644 · doi ↗ · pubmed ↗
- 3121202010.1186/s 12881-019-0925-5 Zhu Y Shen N Wang X Xiao J Lu Y BMC Med Genet Alpha and beta-Thalassemia mutations in Hubei area of China PMC 694389531906886 · doi ↗ · pubmed ↗
- 430221016201910.7150/ijms.27829 Huang Y Lei Y Liu R et al Int J Med Sci Imbalance of erythropoiesis and iron metabolism in patients with thalassemia 30745811 PMC 6367537 · doi ↗ · pubmed ↗
- 536108362688202210.1111/bcp.15343 Chauhan W Shoaib S Fatma R Zaka ur Rab Z Afzal M Br J Clin Pharmacol Beta-thalassemia and the advent of new interventions beyond transfusion and iron chelation 35373382 · doi ↗ · pubmed ↗
- 6112548112548146202210.1016/j.biopha.2021.112548 Zhou X Huang L Wu J Qu Y Jiang H Zhang J Qiu S Liao C Xu X Xia J Lian Q Biomed Pharmacother Impaired bone marrow microenvironment and stem cells in transfusion-dependent beta-thalassemia 34923340 · doi ↗ · pubmed ↗
- 72262396201510.1016/j.redox.2015.07.018 Voskou S Aslan M Fanis P Phylactides M Kleanthous M Redox Biol Oxidative stress in b-thalassaemia and sickle cell disease 26285072 PMC 4543215 · doi ↗ · pubmed ↗
- 82602272105202010.3324/haematol.2019.232124 Camaschella C Nai A Silvestri L Haematologica Iron metabolism and iron disorders revisited in the hepcidin era 31949017 PMC 7012465 · doi ↗ · pubmed ↗