Concurrent Changes in Diet Quality and Physical Activity and Association With Adiposity in Adults
Shayan Aryannezhad, Fumiaki Imamura, Emanuella De Lucia Rolfe, Simon J. Griffin, Nicholas J. Wareham, Soren Brage, Nita G. Forouhi

TL;DR
Improving diet and physical activity together leads to the most significant reduction in body fat and belly fat in adults.
Contribution
The study shows that combined improvements in diet and physical activity have greater benefits for reducing adiposity than either alone.
Findings
Improvements in diet and physical activity were independently linked to less body fat and visceral fat gain.
Combined improvements in both behaviors led to the greatest reduction in visceral fat.
The benefits were stronger in people who were overweight or inactive at the start.
Abstract
This cohort study investigates independent and joint associations of changes in diet quality and physical activity with body composition indices among adults in the UK. Are there independent and joint associations of changes in diet quality and physical activity with changes in adiposity? In this cohort study of 7256 UK adults, improvements in diet quality and physical activity were independently associated with a lesser increase in total body fat and visceral fat, with the greatest benefit observed when both health behaviors improved together. The finding for visceral fat persisted after adjusting for total body fat, and no compensatory or synergistic interaction was found. These findings suggest that improving diet quality and physical activity over time may be most effective for managing overall and central adiposity and achieving a healthier adiposity profile. Diet and physical…
Genes, proteins, chemicals, diseases, species, mutations and cell lines named across the full text — each resolved to its canonical identifier and authoritative record.
Click any figure to enlarge with its caption.
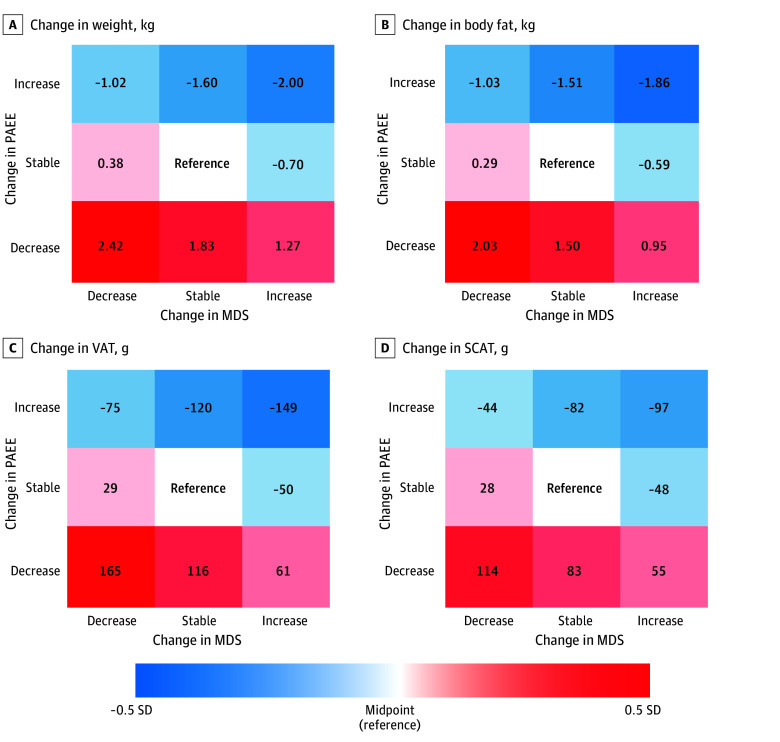 Figure 1
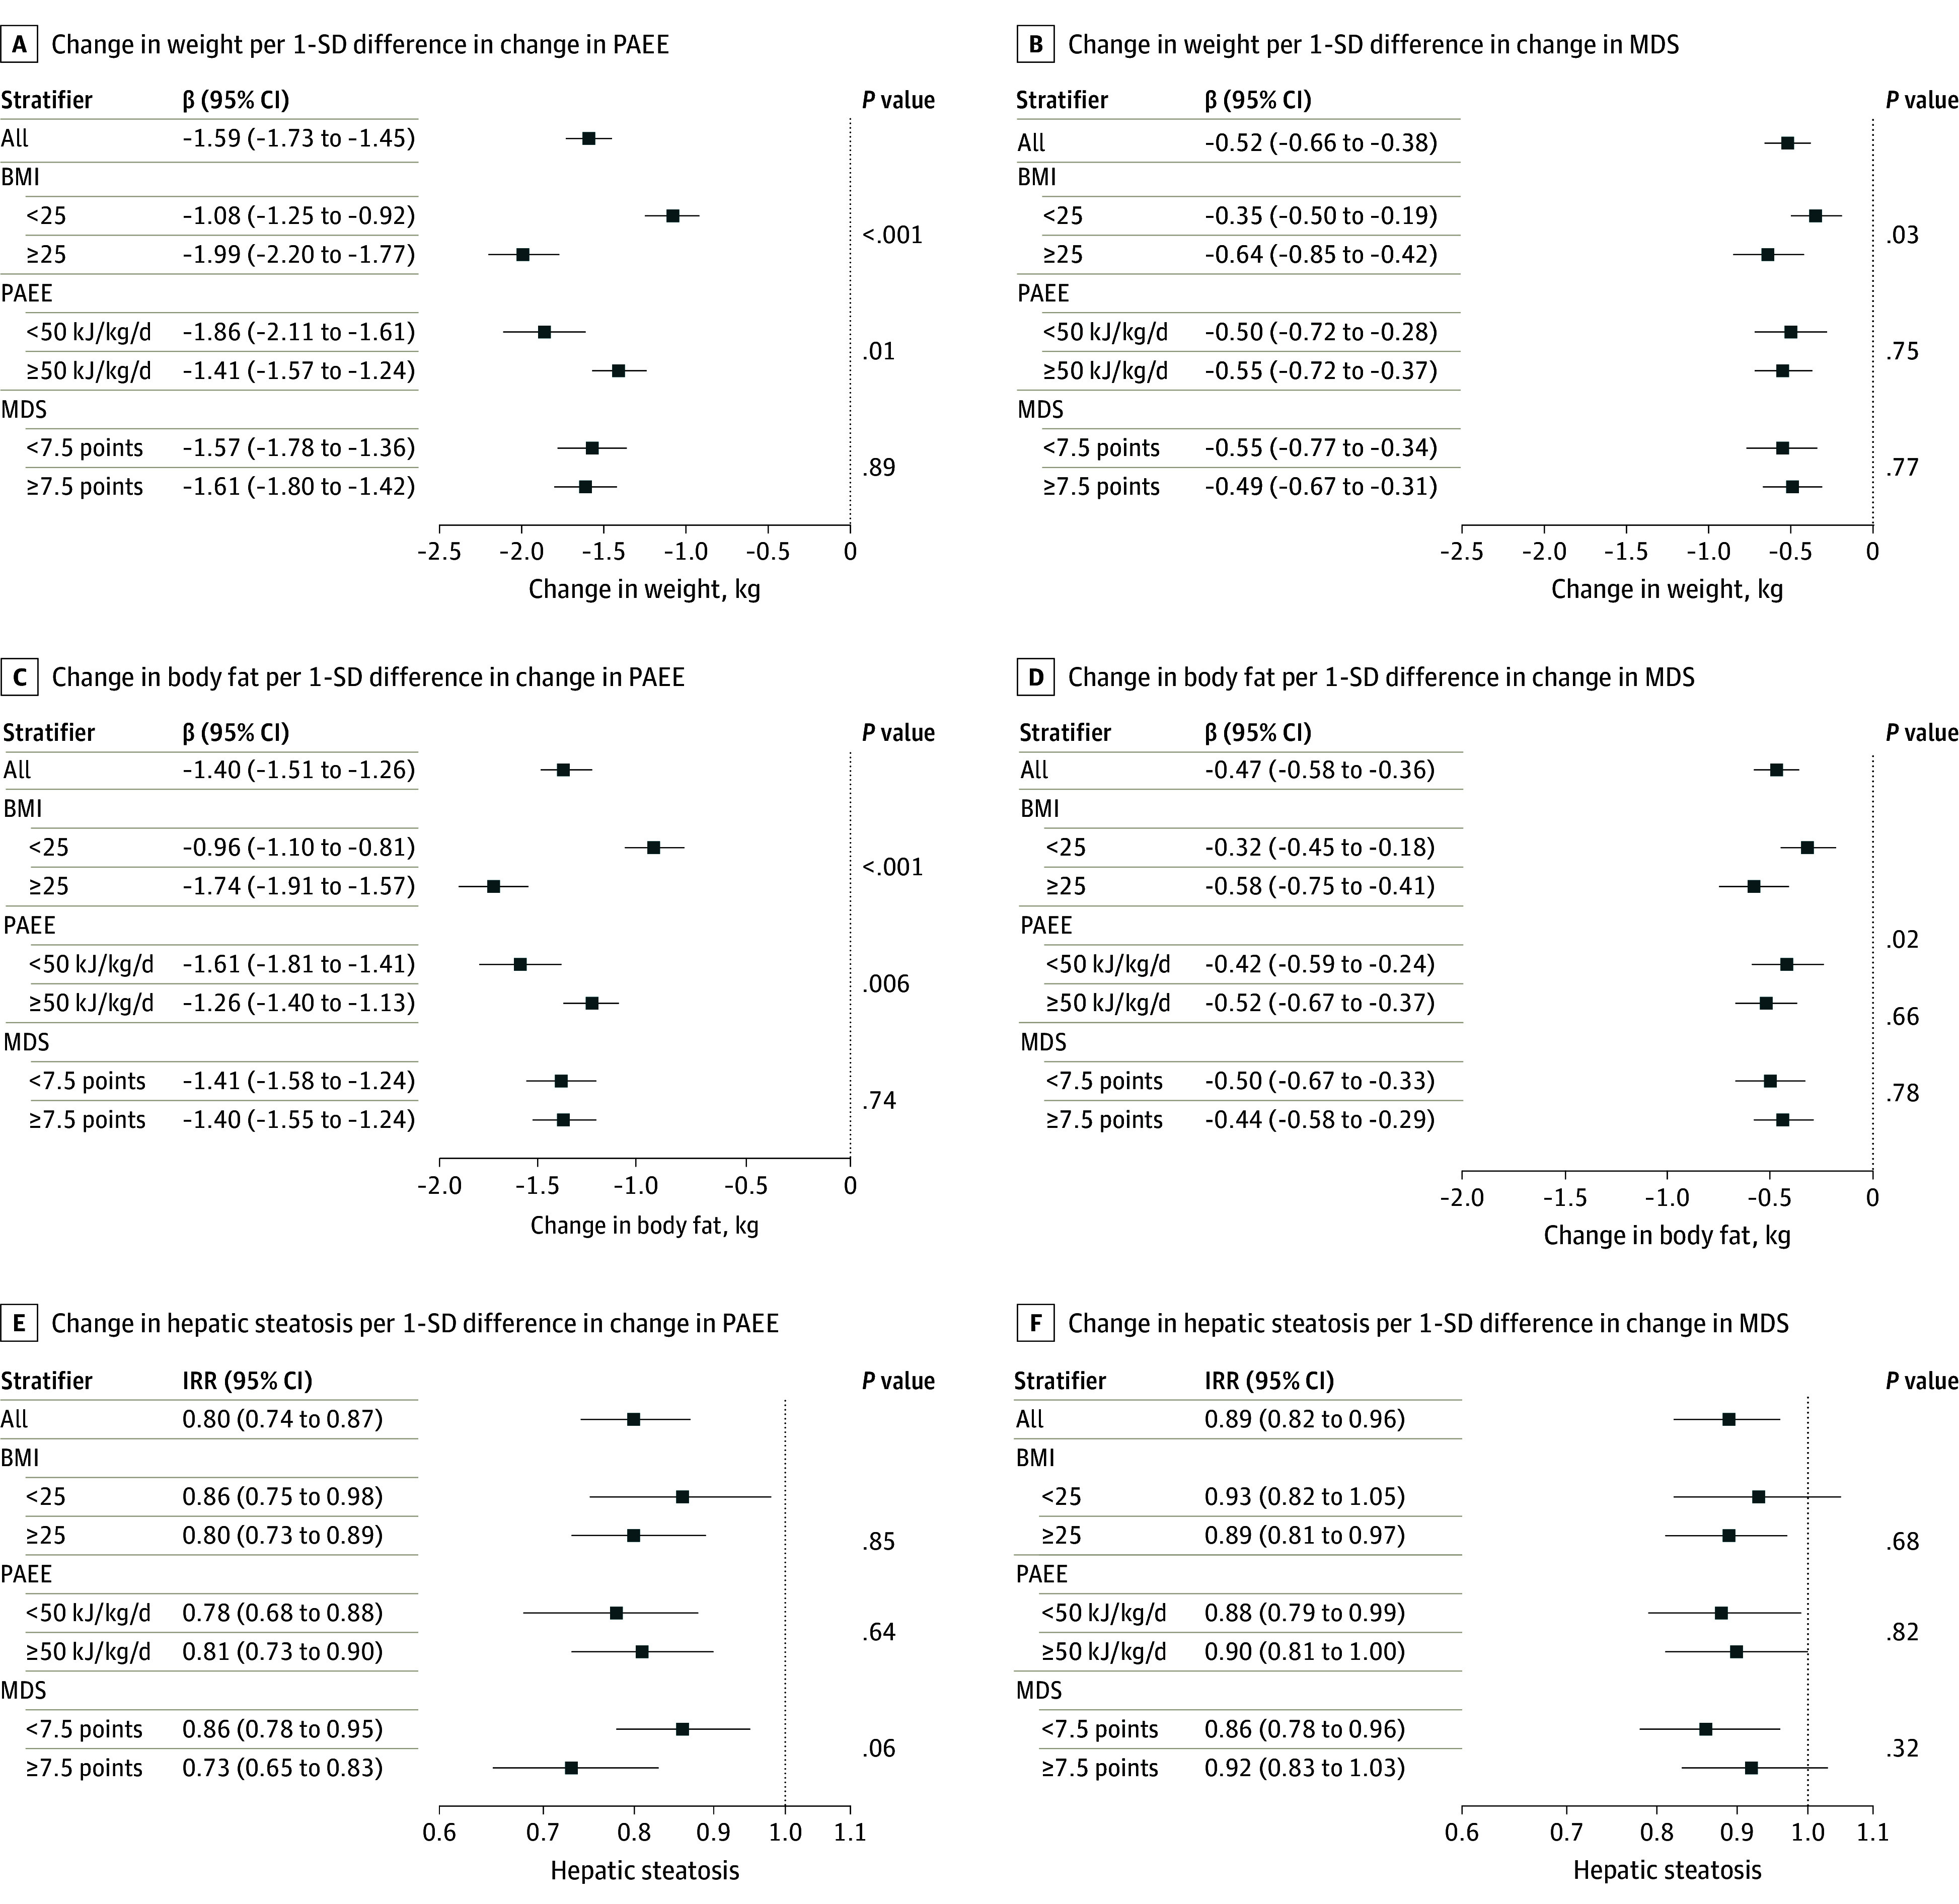 Figure 2
| Characteristics and covariates | Participants, No. (%) (N = 7256) | Change in variable | |
|---|---|---|---|
| Phase 1 (baseline) | Phase 2 (repeated assessment) | ||
| Age, mean (SD), y | 48.8 (7.4) | 56.0 (7.1) | NA |
| Time elapsed between phases, mean (SD), y | NA | NA | 7.2 (2.0) |
| Sex | |||
| Female | 3748 (51.7) | NA | NA |
| Male | 3508 (48.3) | NA | NA |
| Test site | |||
| Cambridge | 2928 (40.4) | 2952 (40.7) | NA |
| Ely | 2571 (35.4) | 2586 (35.6) | NA |
| Wisbech | 1757 (24.2) | 1718 (23.7) | NA |
| Education level | |||
| ≤Compulsory | 1206 (16.6) | NA | NA |
| Further education | 3287 (38.1) | NA | NA |
| Higher education | 2763 (45.3) | NA | NA |
| Occupation type | |||
| Managerial or professional | 4449 (61.3) | 4484 (61.8) | NA |
| Other job type | 2527 (34.8) | 2714 (37.4) | NA |
| Marital status | |||
| Single | 469 (6.5) | 480 (6.6) | NA |
| Married or living as married | 4840 (66.7) | 6036 (83.2) | NA |
| Widowed, separated, or divorced | 507 (7.0) | 726 (10.1) | NA |
| Not available | 745 (10.3) | 14 (0.2) | NA |
| Annual household income, £ | |||
| <20 000 | 767 (10.6) | 868 (12.0) | NA |
| 20 000–40 000 | 2407 (33.2) | 2164 (29.8) | NA |
| >40 000 | 3935 (54.2) | 4045 (55.8) | NA |
| Smoking status: | |||
| Never smoker | 4143 (57.1) | 4251 (58.6) | NA |
| Former smoker | 2467 (34.0) | 2568 (35.4) | NA |
| Current smoker | 633 (8.7) | 426 (5.9) | NA |
| Energy intake, mean (SD), kcal/d | 1942 (562) | 1847 (546) | NA |
| Alcohol intake, mean (SD), g/d | 10.5 (13.4) | 9.3 (12.0) | NA |
|
| |||
| PAEE, mean (SD), kJ/kg/d | 54.3 (21.7) | 57.5 (22.7) | 3.2 (19.0) |
| MDS, mean (SD), points | 7.6 (1.5) | 8.0 (1.5) | 0.3 (1.3) |
| Weight, mean (SD), kg | 77.4 (15.7) | 77.9 (16.1) | 0.6 (5.7) |
| BMI, mean (SD) | 26.4 (4.5) | 26.7 (4.7) | 0.3 (2.0) |
| WC, mean (SD), cm | 90.1 (13.0) | 92.1 (13.5) | 2.1 (6.3) |
| Body fat, mean (SD), kg | 25.6 (8.8) | 26.5 (9.3) | 0.9 (4.6) |
| Body fat, percentage of total body weight | 32.8 (7.5) | 33.8 (7.9) | 1.0 (3.5) |
| VAT, mean (SD), g | 945 (763) | 1078 (851) | 145 (400) |
| VAT proportion of total body weight, mean (SD), % | 1.1 (0.8) | 1.3 (0.8) | 0.2 (0.4) |
| SCAT, mean (SD), g | 1320 (651) | 1310 (621) | −1 (343) |
| SCAT proportion of total body weight, mean (SD), % | 1.7 (0.7) | 1.7 (0.7) | 0 (0.3) |
| Hepatic steatosis | 1445 (23.2) | 1872 (25.8) | 2.6 |
| Outcome | Point estimate (95% CI) | |
|---|---|---|
| Per change in PAEE | Per change in MDS | |
| Change in adiposity markers, β coefficient | ||
| Weight, kg | −1.59 (−1.73 to −1.45) | −0.52 (−0.66 to −0.38) |
| BMI | −0.54 (−0.59 to −0.49) | −0.19 (−0.24 to −0.15) |
| WC, cm | −1.7 (−1.8 to −1.5) | −0.7 (−0.8 to −0.5) |
| Body fat, kg | −1.40 (−1.51 to −1.26) | −0.47 (−0.58 to −0.36) |
| SCAT, g | −75 (−83 to −67) | −28 (−36 to −20) |
| VAT, g | −108 (−118 to −98) | −45 (−55 to −35) |
| Hepatic steatosis, IRR | 0.80 (0.74 to 0.87) | 0.89 (0.82 to 0.96) |
| Outcome | Point estimate coefficient (95%CI) | |
|---|---|---|
| Per change in PAEE | Per change in MDS | |
|
| ||
| Change in weight, kg | ||
| +Adjusted for baseline height | −1.61 (−1.76 to −1.47) | −0.53 (−0.67 to −0.40) |
| +Adjusted for change in height | −1.58 (−1.72 to −1.44) | −0.53 (−0.67 to −0.39) |
| Change in WC, cm | ||
| +Adjusted for baseline height | −1.68 (−1.83 to −1.52) | −0.68 (−0.83 to −0.52) |
| +Adjusted for change in height | −1.66 (−1.82 to −1.50) | −0.68 (−0.83 to −0.52) |
| +Adjusted for baseline BMI | −1.59 (−1.74 to −1.44) | −0.67 (−0.82 to −0.52) |
| +Adjusted for change in BMI | −0.22 (−0.31 to −0.13) | −0.20 (−0.29 to −0.11) |
| +Adjusted for baseline body fat | −0.16 (−0.25 to −0.07) | −0.17 (−0.26 to −0.08) |
| +Adjusted for change in body fat | −0.08 (−0.18 to 0.01) | −0.15 (−0.24 to −0.07) |
| Change in body fat, kg | ||
| +Adjusted for baseline height | −1.41 (−1.52 to −1.29) | −0.48 (−0.59 to −0.36) |
| +Adjusted for change in height | −1.38 (−1.50 to −1.27) | −0.47 (−0.58 to −0.36) |
| +Adjusted for baseline BMI | −1.39 (−1.51 to −1.28) | −0.47 (−0.58 to −0.36) |
| +Adjusted for change I BMI | −0.18 (−0.22 to −0.14) | −0.04 (−0.08 to 0.00) |
| Change in SCAT, g | ||
| +Adjusted for baseline height | −75.22 (−83.59 to −66.84) | −28.30 (−36.54 to −20.05) |
| +Adjusted for change in height | −74.48 (−82.86 to −66.09) | −28.22 (−36.46 to −19.98) |
| +Adjusted for baseline BMI | −72.81 (−81.21 to −64.42) | −27.12 (−35.36 to −18.88) |
| +Adjusted for change in BMI | −3.99 (−9.84 to 1.86) | −2.47 (−8.05 to 3.11) |
| +Adjusted for baseline body fat | −2.99 (−8.87 to 2.89) | −2.08 (−7.66 to 3.50) |
| +Adjusted for change in body fat | 7.16 (1.68 to 12.64) | 0.28 (−4.89 to 5.45) |
| Change in VAT, g | ||
| +Adjusted for baseline height | −107.81 (−118.07 to −97.55) | −45.35 (−55.47 to −35.22) |
| +Adjusted for change in height | −105.12 (−115.31 to −94.93) | −45.04 (−55.09 to −35.00) |
| +Adjusted for baseline BMI | −103.57 (−113.78 to −93.36) | −44.34 (−54.38 to −34.30) |
| +Adjusted for change in BMI | −21.45 (−28.68 to −14.23) | −15.76 (−22.66 to −8.86) |
| +Adjusted for baseline body fat | −21.05 (−28.30 to −13.79) | −15.66 (−22.56 to −8.76) |
| +Adjusted for change in body fat | −8.79 (−15.54 to −2.03) | −12.68 (−19.08 to −6.29) |
|
| ||
| +Adjusted for baseline BMI | 0.86 (0.79 to 0.93) | 0.92 (0.85 to 0.99) |
| +Adjusted for change in BMI | 0.96 (0.89 to 1.05) | 0.96 (0.89 to 1.04) |
| +Adjusted for baseline body fat | 0.99 (0.91 to 1.08) | 0.96 (0.89 to 1.04) |
| +Adjusted for change in body fat | 1.00 (0.92 to 1.09) | 0.97 (0.89 to 1.04) |
| +Adjusted for baseline VAT | 0.99 (0.91 to 1.08) | 0.96 (0.89 to 1.04) |
| +Adjusted for change in VAT | 1.00 (0.92 to 1.09) | 0.97 (0.90 to 1.05) |
Peer Reviews
No public reviews on file for this paper yet. If you reviewed it on a platform where reviews are public (OpenReview, ICLR, NeurIPS, ICML), you can paste yours below so the community can read it here.
Videos
No videos yet. Explain this paper in a talk, walkthrough, or lecture? Add one.
Taxonomy
TopicsNutritional Studies and Diet · Nutrition and Health in Aging · Bariatric Surgery and Outcomes
Introduction
Nearly 3 billion people worldwide are living with overweight or obesity.^1^ This represents a major global health concern imposing profound impacts on the incidence of cardiometabolic diseases, cancer, and premature mortality.^2^ Projections suggest that the prevalence of overweight and obesity will continue to increase unless effective preventive strategies are implemented.^1^ Research evidence for the benefits associated with diet and physical activity has largely been based on weight-loss trials among adults with overweight or obesity,^3,4^ but evidence is limited for the role of these health behaviors for the primary prevention of weight gain that often occurs gradually over years. In particular, there are research gaps for approaches that consider the complex interplay between diet and physical activity (PA) and their joint association with markers of adiposity.
Evidence of the association of diet and PA with adiposity at the population level comes mostly from prospective cohort studies that examined these 2 health behaviors separately, limiting insights into their synergistic association with weight management and metabolic health.^5,6^ Moreover, these studies used single-time assessments of health behaviors in association with later weight status, which increases measurement error and the possibility that estimates of associations may be affected by regression dilution bias. However, consistent and biologically plausible associations between lifestyle factors and long-term weight gain are observed when evaluating concurrent changes in them through repeated assessments, not through single-time assessment.^7^ This may be due to the issue of compensatory health behaviors, when a change in 1 behavior prompts a compensatory change in another in individuals living in natural settings.^8^ Small-scale, short-duration trials have reported synergism between diet quality and PA in the association with adiposity.^9^ However, this needs to be tested in larger, population-based studies and over longer follow-up periods to confirm its generalizability.
Some cohort studies^10,11,12^ have examined associations of concurrent changes in diet and PA with adiposity. However, they primarily focused on self-reported weight as the outcome, which is prone to error and bias and does not assess body fat distribution. Total body weight or body mass index (BMI; calculated as weight in kilograms divided by height in meters squared) alone do not differentiate between various adiposity components, such as visceral and subcutaneous fat or hepatic fat, which have distinct metabolic effects, but their use is currently underrepresented in the literature.^13,14^ These weight change studies^10,11,12^ also relied on self-reported PA measures, which may introduce measurement error and bias. This could be reduced through the use of objective measures, thereby improving the validity and precision of these analyses. In this study, we aimed to investigate how changes over time in overall diet quality and objectively measured PA may be associated with concurrent changes in several markers of adiposity, including body composition indices assessed using dual-energy x-ray absorptiometry (DEXA) and ultrasonography-diagnosed hepatic steatosis.
Methods
The Fenland study is an ongoing population-based cohort study involving 12 435 adults in the UK born between 1950 and 1975 and registered with general practices in Cambridge, Ely, and Wisbech. People were excluded if they had known preexisting diabetes, were pregnant or breastfeeding, were unable to walk unaided for at least 10 minutes, had psychosis, or had a terminal illness. The study used a prospective design and collected detailed health and health behavior information from participants in phase 1 between 2005 and 2015 and phase 2 between 2014 and 2020, with a minimum interval of 4 years between the 2 phases.^15^ The Fenland study was approved by the Cambridge Local Research Ethics Committee (National Research Ethics Service Committee East of England-Cambridge Central) and was performed in agreement with the Helsinki Declaration and its former amendments. Informed consent was obtained from all participants. This study is reported following the Strengthening the Reporting of Observational Studies in Epidemiology (STROBE) reporting guideline.
Measurements
Habitual diet was assessed using a validated 130-item food frequency questionnaire, and diet quality was evaluated with the Mediterranean diet score (MDS).^16,17,18,19^ Physical activity was measured using individually calibrated combined heart rate and movement sensors, summarized as mean daily physical activity energy expenditure (PAEE).^20,21,22,23,24,25^ Covariates included sociodemographic and behavioral characteristics assessed by questionnaire. Adiposity was assessed using anthropometry, DEXA, and waist circumference. Liver fat was measured using ultrasonography scored against standardized criteria.^26^ Full details of dietary, physical activity, covariate, and adiposity assessments are provided in the eMethods in Supplement 1.
Statistical Analysis
Among 7831 participants who attended both baseline and follow-up visits, 193 individuals with missing food frequency questionnaire or wearable sensor data were excluded, as were 382 individuals with inadequate movement sensor time or implausible energy intake. Adequate movement sensor time was defined as a total wear time of 72 hours or more, with a sum of more than 8 hours of wear time in each day quadrant (12 am to 6 am, 6 am to 12 pm, 12 pm to 6 pm, and 6 pm to 12 am) over the wear time. Implausible energy intake was considered as that outside the ranges of 500 to 3500 kcal/d for females and 800 to 4000 kcal/d for males. Exclusions resulted in an analytical sample of 7256 participants. Depending on the availability of adiposity variables for participants, sample sizes varied by the outcome (for details of participant selection, see eFigure 1 in Supplement 1).
We used multivariable linear regression models to estimate the regression coefficient (β) and 95% CIs for associations between concurrent changes over time in mutual exposures − longitudinal within-person changes in MDS (change in MDS) and PAEE (change in PAEE) and changes in adiposity markers (change in adiposity indices). We assessed potential nonlinear associations visually using restricted cubic spline regression. Poisson regression was modeled to evaluate the association of change in MDS and change in PAEE with the risk of hepatic steatosis at the first follow-up among 4784 participants without hepatic steatosis at baseline. We adjusted primary models for potential confounders, including age, sex, baseline PAEE, baseline MDS, baseline value of the outcome adiposity marker, follow-up time, test site, education, marital status, occupation type, time-updated household income, time-updated smoking status, baseline energy intake, and change in energy intake.
We used a stepwise approach to explore whether the association was independent of total body mass or body fat (ie, specific to the localized adiposity site). This involved further adjusting models for baseline and change in height, baseline and change in BMI, and baseline and change in body fat. For hepatic steatosis, additional adjustment for baseline and change in visceral adipose tissue (VAT) was made.
To test the hypothesis that joint associations of change in MDS and change in PAEE with adiposity markers were above and beyond the summation of each individual association, we tested the change in MDS–change in PAEE interaction by including the cross-product term (change in PAEE × change in MDS) in models. To estimate joint associations additionally, categorical variables were created to represent tertiles of change in MDS and change in PAEE, categorized as decrease, stable, and increase. These categories were then cross-classified to form 9 joint trajectory groups. The stable-stable group served as the reference category in the regression model.
We conducted a series of ancillary and sensitivity analyses to assess the robustness of the main findings. These included tests for potential interactions by baseline age, sex, BMI, smoking status, MDS, and PAEE. In addition, we examined cross-sectional associations, longitudinal associations of PA and diet quality at baseline with changes in adiposity markers over the follow-up, minimally adjusted associations, and complete case analysis. We made additional adjustments for seasonality, family history of diabetes, menopause, and hormone replacement therapy in female participants. Diet quality was alternatively measured using plasma vitamin C as a biomarker of fruit and vegetable intake. Furthermore, where appropriate, we expressed adiposity markers in association with body weight, reported the incidence of overweight or obesity as a binary outcome, and expressed adiposity outcomes in SD units. Statistical analyses were conducted using Stata statistical software version 17 (StataCorp). All tests were 2-sided, and results were considered statistically significant at P < .05. Data were analyzed from January 2024 through April 2025.
Results
Among 7256 participants (mean [SD; range] age at baseline, 48.8 [7.4; 29-65] years; 3748 female [51.7%]) (Table 1), a mean (SD) of 7.2 (2.0) years passed between the 2 follow-up phases. At phase 1, the mean (SD) PAEE was 54.3 (21.7) kJ/kg/d, with an increase over time (mean [SD] change in PAEE, 3.2 [19.0] kJ/kg/d). Similarly, the mean (SD) MDS at phase 1 was 7.6 (1.5) points, with a mean (SD) increase over time of 0.3 (1.3) points. The mean (SD) BMI at baseline was 26.4 (4.5), with a mean (SD) increase over time of 0.3 (2.0). Similarly, mean values for all other adiposity markers, including weight, waist circumference (WC), body fat, and VAT, increased from phase 1 to phase 2, but this was not true for subcutaneous adipose tissue (SCAT). The prevalence of hepatic steatosis was 1445 of 6229 participants with available data (23.2%) at phase 1, which increased to 1872 of 7256 participants (25.8%) at phase 2.
In multivariable regression models adjusted for potential confounders, each 1-SD (19.0 kJ/kg/d) increase in change in PAEE was negatively associated with changes in all adiposity markers (change in body fat: β = −1.40 kg; 95% CI, −1.51 to −1.26 kg; change in VAT: β = −108 g; 95% CI, −118 to −98 g) and each 1-SD (1.27 points) increase in change in MDS was also negatively associated with changes in all adiposity marker (change in body fat: β = −0.47 kg; 95% CI, −0.58 to −0.36 kg; change in VAT: β = −45 g; 95% CI, −55 to −35 g) (Table 2). The direction of the associations was similar for change in PAEE and change in MDS, but the magnitude of the β in these associations was greater for change in PAEE compared with change in MDS. There was no evidence of interaction between change in PAEE and change in MDS for any outcome (eTable 1 in Supplement 1).
A series of stepwise adjustments for other adiposity markers was conducted to evaluate whether observed associations were independent or mediated through changes in other adiposity markers (Table 3). Adjustment for BMI attenuated observed associations for change in WC, change in body fat, and change in VAT, but those associations remained. For change in SCAT, adjusting for BMI nullified associations, and further adjustment for body fat showed the association of change in PAEE (β = 7.16 g; 95% CI, 1.68 to 12.64 g per 1-SD in change in PAEE) to be positive while there was no association for change in MDS (β = 0.28 g; 95% CI, −4.89 to 5.45 g per 1-SD change in MDS). For hepatic steatosis, there were no longer associations after further adjustment for BMI, body fat, or VAT.
Figure 1 shows joint associations of changes in health behaviors with changes in adiposity markers on SD scales, allowing for a comparison across different adiposity markers. In joint association analyses, increases in change in MDS or change PAEE, when not in opposite directions, were negatively associated with adiposity changes across all markers compared with relatively stable change in MDS and change in PAEE. In contrast, decreases were positively associated with adiposity changes across all markers (Figure 1; eFigure 2 and eTable 2 in Supplement 1). Similarly, individuals who increased diet quality and activity concurrently experienced the most adiposity loss, while those who reduced both exposures had the greatest adiposity gain during the follow-up. For example, simultaneous increases in MDS and PAEE were associated with a greater magnitude of decrease in adiposity (β = −149 g; 95% CI, −187 to −111 g for change in VAT among participants in higher joint change in MDS and change in PAEE tertiles). Participants whose diet and activity behaviors changed in opposite directions experienced associations with adiposity changes that had modest β values. In the decrease-decrease trajectory group, the association with the largest positive β among body fat measures was for change in body fat (β = 2.03 kg; 95% CI, 1.60 to 2.47 kg, which corresponds to 0.44 SD of the mean[SD] change in body fat over follow-up of 0.91 [4.56] kg) and the smallest for change in SCAT (β = 114 g; 95% CI, 82 to 146 g, which corresponds to 0.33 SD of the mean [SD] change in SCAT over follow-up of −1 g [343] g). In the increase-increase group, the association with the largest negative β among body fat measures was for change in body fat (β = −1.86 kg; 95% CI, −2.28 to −1.44 kg, which corresponds to 0.40 SD of the mean [SD] change in body fat over follow-up) and the smallest for change in SCAT (β = −97 g; 95% CI, −128 to −66 g, which corresponds to 0.28 SD of the change in SCAT over follow-up).
Joint Associations of Concurrent Changes Over Time in Physical Activity and Diet Quality With AdiposityBlue to red colors indicate −0.5 SD to 0.5 SD in the change in the adiposity marker compared with the reference. Change in MDS indicates changes in Mediterranean diet score over time; change in PAEE, changes in physical activity energy expenditure over time; SCAT, subcutaneous adipose tissue; VAT, visceral adipose tissue.
For change in MDS and change in PAEE, interactions by baseline BMI were observed for changes in weight, BMI, body fat, and VAT (Figure 2; eTable 3 and eTable 4 in Supplement 1). There was no evidence for interaction that indicated heterogeneous directions in an association between strata. For change in body fat, for example, per 1-SD difference in change in PAEE the β was −0.96 kg (95% CI, −1.10 to −0.81 kg) when baseline BMI was 25 and −1.74 kg (95% CI, −1.91 to −1.57 kg) when baseline BMI was 25 (P for interaction < .001). For change in PAEE, interactions were observed depending on baseline PAEE, with a greater magnitude of associations in individuals with lower baseline PAEE. Change in MDS showed no evidence for any interaction based on baseline MDS.
Stratified ResultsAssociations are shown of concurrent changes over time in physical activity and diet quality with adiposity markers in different strata of baseline body mass index (BMI; calculated as weight in kilograms divided by height in meters squared), physical activity energy expenditure (PAEE), and Mediterranean diet score (MDS). Results are shown as β coefficients and 95% CIs from multivariable linear regression analyses and incidence rate ratios (IRRs) and 95% CIs from Poisson regression. Change in PAEE indicates changes in PAEE over time; change in MDS, changes in MDS over time. P values are for subgroup interaction.
Findings were consistent across sensitivity analyses of the main approach, including minimally adjusted models (eTable 5 in Supplement 1), complete case analysis (eTable 6 in Supplement 1), and models additionally adjusted for seasonality (eTable 7 in Supplement 1), as well as family history of diabetes, menopause, and hormone-replacement therapy in female participants (eTable 8 in Supplement 1). No interactions were observed by baseline menopause or hormone-replacement therapy status in female participants. In another sensitivity analysis, diet quality measured via plasma vitamin C yielded similar results to those based on MDS (eTable 9 in Supplement 1). Ancillary analyses supported the main approach, including cross-sectional associations (eTable 10 in Supplement 1) and models assessing associations between phase 1 exposures and changes in adiposity (eTable 11 in Supplement 1), when adiposity was expressed as a proportion of total body weight (eTable 12 in Supplement 1), in SD units (eTable 13 in Supplement 1), or as the incidence of overweight or obesity (eTable 14 in Supplement 1). Spline regression showed linear associations of change in PAEE and change in MDS with all adiposity outcomes (eFigures 3 and 4 in Supplement 1).
Discussion
Using repeated measure data from the Fenland study, this cohort study found that increases in diet quality and physical activity over time were independently associated with concurrent decreases or less gain in weight, overall fat mass, and regional fat and a lower incidence of hepatic steatosis. Simultaneous improvements in both behaviors were associated with the greatest adiposity loss, while improvement in only 1 behavior was associated with relatively modest changes in body composition. Even after adjusting for BMI (a crude measure of total mass loss of all types), associations of change in MDS and change in PAEE with adiposity markers known to be metabolically unhealthy (ie, change in WC, change in body fat, and change in VAT) remained, although attenuated, as expected due to mediation through overall weight change. In contrast, after adjustment for BMI, associations with change in SCAT, a more metabolically healthy adiposity marker,^27^ were not present, and after further adjustment for body fat, the association of improving health behaviors with change in SCAT became positive. This suggests that the potential beneficial outcomes associated with changes in diet quality and physical activity may be strongly associated with reductions in unhealthy fat depots, such as VAT and central adiposity, and if anything, positively associated with SCAT when accounting for the role of other adiposity markers. Therefore, targeting improvements in diet and physical activity may be not only associated with weight loss, but also particularly effective in associations with reduced metabolically harmful fat and an overall healthier adiposity profile, which could have important implications for long-term health outcomes.
Furthermore, assessing comparative changes in different adiposity markers based on SD units showed that various body composition indices had different outcomes in association with changes in diet and activity. Total body fat and VAT showed the greatest degree of alternations over time, while SCAT exhibited smaller changes. This may be due to structural and functional differences between different adipose depots. VAT is more metabolically active and prone to mobilization during energy deficits because it is more vascular and innervated and contains a larger number of inflammatory and immune cells compared with SCAT, which is less insulin resistant and serves as a more stable fat deposit.^28^ Previous reviews suggested that VAT loss generally mirrors overall fat loss^29,30^; however, we found that combined diet and activity improvements may be associated with different outcomes for VAT and SCAT.
Our finding of an interaction between both health behaviors and baseline adiposity suggests that the potential benefits associated with improving diet quality and increasing physical activity are greater in individuals with overweight or obesity than those with reference range weight. Similar to our findings, results from other cohorts demonstrated stronger associations between changes in lifestyle habits and weight change in adults with overweight.^10,31,32^ For change in PAEE, an interaction was observed with baseline physical activity levels, indicating that individuals who were less active at baseline experienced potential benefits associated with increases in physical activity over time. These findings could be useful in guiding more personalized health advice, with potential tailoring of health behavior interventions based on individual characteristics.
Consistent with our findings, a study in the US^33^ reported that each 1-SD increase in a diet quality index was inversely associated with changes in BMI (−0.39), WC (−0.90 cm), and weight (−1.14 kg). Compared with our findings, their larger effect sizes may be due to the longer follow-up (20 years vs 7.2 years) and greater weight gain in their population (15.8 kg vs 0.6 kg). Thus, their results reflect associations between diet and decreased adiposity gain, while we observed associations with adiposity loss. Also in line with our findings, previous studies have reported that increasing activity levels over time are associated with less weight and WC gain.^34,35,36^ However, a direct comparison of their results to ours is challenging due to the use of different PA exposure units. Additionally, their findings are limited by the lack of adjustment for diet quality as a confounding factor, time-varying confounders, and the reliance on self-reported, subjective PA measures unlike our objective assessment of PA. Results from 3 US cohorts^10,11,12^ that have examined the joint associations of 4-year changes in diet quality and PA with weight change demonstrated that concurrent improvements in both behaviors were associated with the least amount of weight gain, without any interaction between diet and PA, which is consistent with our findings. We have advanced these findings by incorporating continuous measures of PA and diet quality in our models, which increases the precision of our estimates; using objectively measured PA; and using detailed DEXA-measured adiposity indices instead of relying on self-reported weight. These approaches collectively allow for a more accurate and comprehensive assessment of the association between health behavior changes and various body composition indices.
Strengths and Limitations
Strengths of this study include the use of objective and validated assessment methods for health behavior exposures, detailed DEXA-measured assessments of adiposity, and repeated measurements of exposures and outcomes, which allowed for a change-on-change analysis over time in a large sample, enhancing the accuracy and robustness of our findings. Our study also has some limitations, including its observational design, which means we cannot establish causality; the potential lack of generalizability to other race and ethnicity groups due to the predominance of White participants in our study; and the inevitable presence of measurement errors and residual confounding that is common in observational studies, although we adjusted for a comprehensive range of potential confounding factors. Additionally, lean mass measures were not included in outcomes of this study but would be relevant to more fully characterizing body composition changes.
Conclusions
Findings from this cohort study suggest that increasing diet quality and PA was associated with not only weight loss, but also a healthier overall adiposity profile, as demonstrated by improvements in different measures of fat distribution. Although improvements in either behavior alone were associated with lower adiposity over time, addressing both behaviors simultaneously could be associated with a substantial increase in the magnitude of potential adiposity benefits. These findings emphasize the importance of targeting both health behaviors to reduce unhealthy fat depots and promote better metabolic health.
The reference list from the paper itself. Each links out to its DOI / PubMed record.
- 1Global Obesity Observatory. Obesity Atlas 2023. World Obesity Federation. Accessed October 20, 2025. https://data.worldobesity.org/publications/?cat=19
- 2GBD 2021 Risk Factors Collaborators. Global burden and strength of evidence for 88 risk factors in 204 countries and 811 subnational locations, 1990-2021: a systematic analysis for the Global Burden of Disease Study 2021. Lancet. 2024;403(10440):2162-2203. doi:10.1016/S 0140-6736(24)00933-4 38762324 PMC 11120204 · doi ↗ · pubmed ↗
- 3Rotunda W, Rains C, Jacobs SR, . Weight loss in short-term interventions for physical activity and nutrition among adults with overweight or obesity: a systematic review and meta-analysis. Prev Chronic Dis. 2024;21:E 21. doi:10.5888/pcd 21.230347 38573796 PMC 10996390 · doi ↗ · pubmed ↗
- 4Olateju IV, Opaleye-Enakhimion T, Udeogu JE, . A systematic review on the effectiveness of diet and exercise in the management of obesity. Diabetes Metab Syndr. 2023;17(4):102759. doi:10.1016/j.dsx.2023.102759 37084486 · doi ↗ · pubmed ↗
- 5Lotfi K, Saneei P, Hajhashemy Z, Esmaillzadeh A. Adherence to the Mediterranean diet, five-year weight change, and risk of overweight and obesity: a systematic review and dose-response meta-analysis of prospective cohort studies. Adv Nutr. 2022;13(1):152-166. doi:10.1093/advances/nmab 092 34352891 PMC 8803490 · doi ↗ · pubmed ↗
- 6Cleven L, Krell-Roesch J, Nigg CR, Woll A. The association between physical activity with incident obesity, coronary heart disease, diabetes and hypertension in adults: a systematic review of longitudinal studies published after 2012. BMC Public Health. 2020;20(1):726. doi:10.1186/s 12889-020-08715-4 32429951 PMC 7238737 · doi ↗ · pubmed ↗
- 7Smith JD, Hou T, Hu FB, . A comparison of different methods for evaluating diet, physical activity, and long-term weight gain in 3 prospective cohort studies. J Nutr. 2015;145(11):2527-2534. doi:10.3945/jn.115.214171 26377763 PMC 4620721 · doi ↗ · pubmed ↗
- 8Reily NM, Pinkus RT, Vartanian LR, Faasse K. Compensatory eating after exercise in everyday life: insights from daily diary studies. P Lo S One. 2023;18(3):e 0282501. doi:10.1371/journal.pone.0282501 36920917 PMC 10016725 · doi ↗ · pubmed ↗