Risk Factors Associated With Incidence of Lung Cancer in Never-Smokers: A Systematic Review and Meta-Analysis
Sindhu Bhaarrati Naidu, Allegra Wisking, Akul Karoshi, Sarah Burdett, Peter J. Godolphin, Sanjay Popat, Sam M. Janes, Neal Navani

TL;DR
This study identifies risk factors for lung cancer in never-smokers, including pollution and rheumatoid arthritis, and highlights regional differences in risk.
Contribution
The study quantifies global risk factors for lung cancer in never-smokers and identifies regional variations, such as family history differences between East Asia and the West.
Findings
Female sex, rheumatoid arthritis, and pollution are significant risk factors for lung cancer in never-smokers.
Family history of lung cancer is a risk factor in East Asia but not in Western countries.
The study analyzed 16 million never-smokers across 54 studies to identify these risk factors.
Abstract
Lung cancer is the leading cause of cancer mortality globally. Although often associated with smoking, up to 25% of cases worldwide and 50% in East Asia occur in “never-smokers.” There are currently no robust tools for predicting lung cancer in individuals who have never smoked (LCINS) for populations outside East Asia. Together with a group of patient representatives, the authors of this study aimed to summarise risk factors for LCINS and quantify risk in different geographical regions. This study was prospectively registered (PROSPERO-CRD42022379253). The systematic review and meta-analysis included studies published from 2017 and aimed to comprehensively investigate risk factors associated with LCINS incidence. Risk of bias was assessed using Newcastle-Ottawa Scale. A total of 6725 reports were identified and 54 studies were included, with multivariable analysis of 192 factors in…
Genes, proteins, chemicals, diseases, species, mutations and cell lines named across the full text — each resolved to its canonical identifier and authoritative record.
Click any figure to enlarge with its caption.
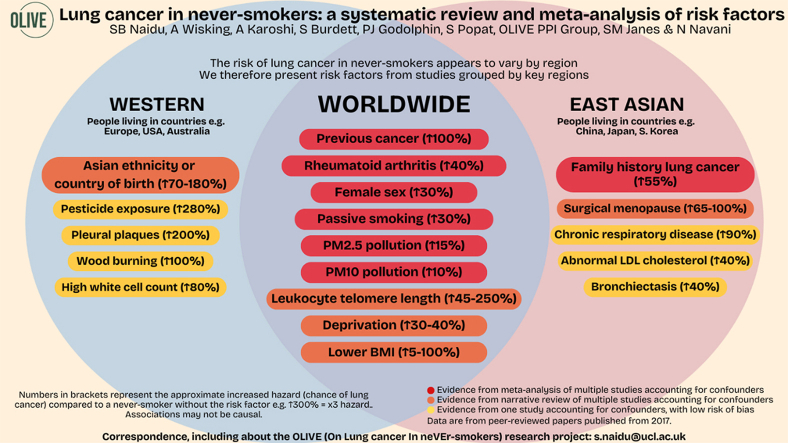 Figure 1
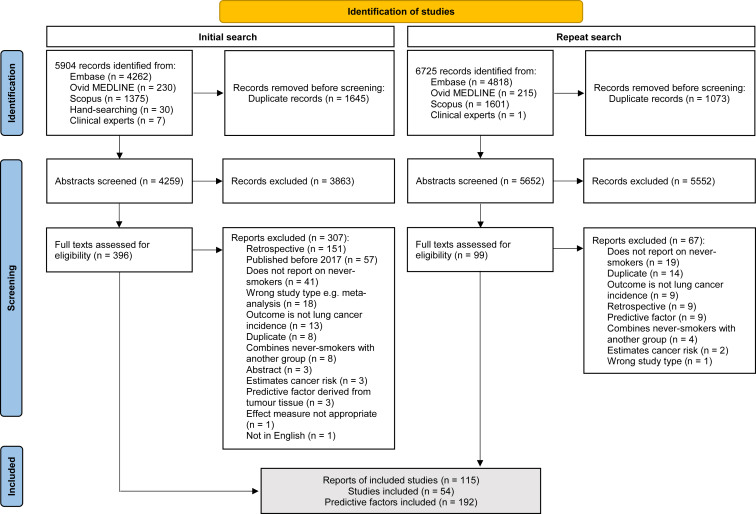 Figure 2
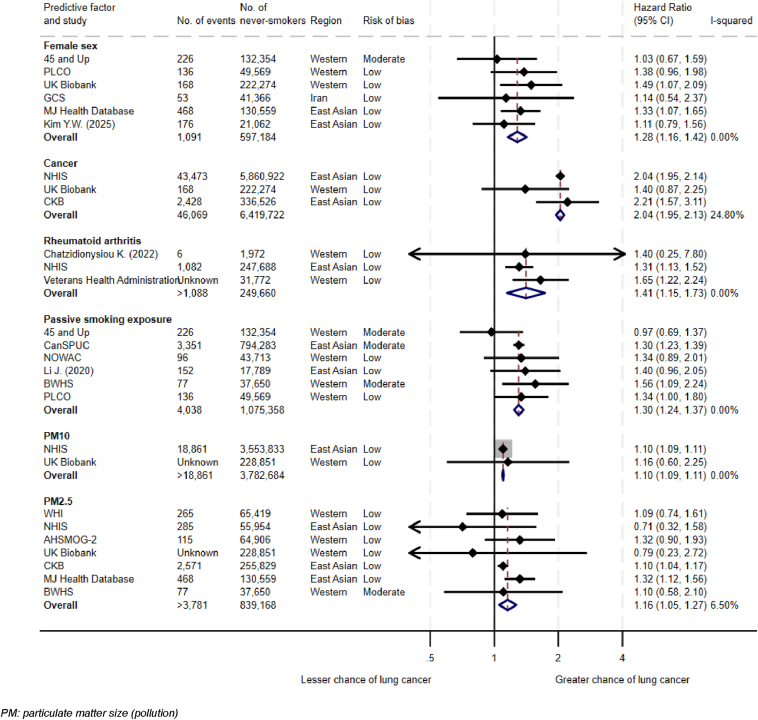 Figure 3
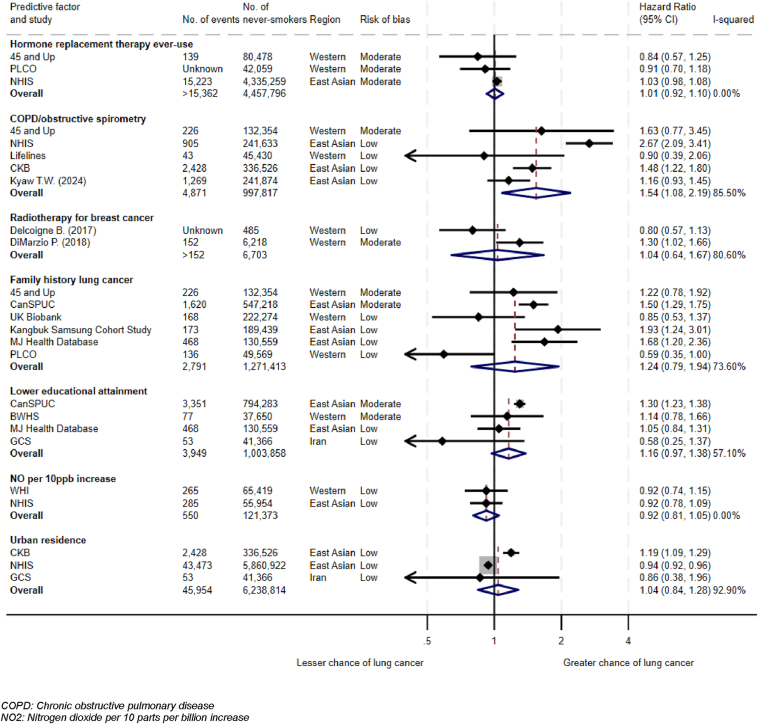 Figure 4
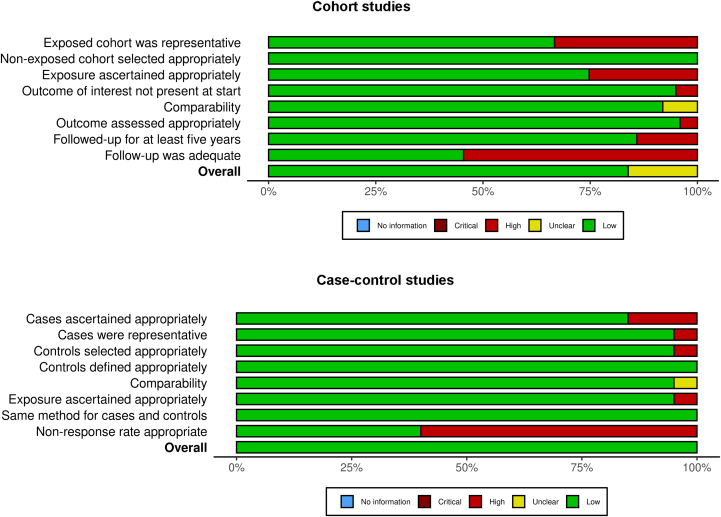 Figure 5
Peer Reviews
No public reviews on file for this paper yet. If you reviewed it on a platform where reviews are public (OpenReview, ICLR, NeurIPS, ICML), you can paste yours below so the community can read it here.
Videos
No videos yet. Explain this paper in a talk, walkthrough, or lecture? Add one.
Taxonomy
TopicsLung Cancer Treatments and Mutations
Introduction
Lung cancer is the largest cause of cancer-related death worldwide, with 2,480,675 adults diagnosed and 1,817,469 people dying from it in 2022.1 Although often associated with smoking, reports from 2000 and 2020 respectively suggest up to 25% of lung cancer worldwide and 50% in East Asian countries occurs in “never-smokers” who have smoked less than 100 tobacco cigarettes in their lifetime.2^,^3 If considered separately, lung cancer in individuals who have never smoked (LCINS) is the seventh largest cause of cancer death worldwide.2
Approximately half of all individuals with lung cancer are diagnosed at stage IV, which is usually not curable and associated with increased mortality and poorer quality of life.4 A third of all individuals have multiple primary care presentations before being referred for further investigations, a higher proportion compared with most cancers.5 Never-smokers may experience longer delays to receiving a medical appointment and be more likely to have late-stage disease at diagnosis.2^,^6 There are now programs to improve early detection in individuals who have ever smoked, such as screening with low-dose computed tomography scans. Such programs have led to marked stage shifts, enabled the identification of individuals with early-stage disease, and contributed to marked improvements in mortality.7 Screening for LCINS has been introduced in some East Asian countries; most notably, in Taiwan, the prospective Taiwan Lung Cancer Screening in Never-Smoker Trial (TALENT) study reported on 12,011 participants, most (93.3%) of whom were never-smokers with the remaining being individuals who smoked less than 10 pack-years, aged 55 to 75 years with at least one risk factor of family history of lung cancer, passive smoking, tuberculosis, chronic pulmonary obstructive disease (COPD), high cooking index, or cooking without ventilation.8 The rate of screen-detected invasive lung cancer was 2.0% in the baseline round. Comparatively, randomized controlled trials such as Nederlands–Leuvens Longkanker Screenings Onderzoek (NELSON) and National Lung Screening Trial (NLST) screened individuals with significant smoking histories and reported rates of 0.9% to 1.0%.9^,^10 However, such trials also demonstrated a reduction in lung cancer-related mortality, paving the way for the widespread recommendation of screening for lung cancer in high-risk individuals who have ever smoked. As TALENT had no comparison arm, it was unable to demonstrate a reduction in lung cancer–related mortality. Furthermore, TALENT may have higher rates of overdiagnosis, especially as never-smokers may have more indolent lesions. The balance between benefits and risks and the efficacy of screening individuals who have never smoked remains widely debated. One way to maximize benefit may be to use risk-prediction models to identify high-risk individuals, rather than risk factor–based screening.11 However, there are currently no robust risk-prediction models to identify high-risk never-smokers who may benefit from such interventions in populations outside of East Asia.3 The lack of early detection programs for LCINS results in significantly fewer individuals identified with early-stage disease and lost opportunities for curing them.
Knowledge of risk factors would enable the identification of high-risk never-smokers who may benefit from such early detection interventions. Well-recognized risk factors include environmental exposures, such as passive smoking.12 There is a growing body of research investigating risk factors for LCINS, and summarizing this evidence is essential to ensure maximum benefit for patients. One systematic review, published in 2022, is available. However, it is not sufficiently comprehensive as it only included cohort studies.13 Furthermore, LCINS risk seems to vary by region. For example, most germline genetic variants associated with LCINS risk identified among East Asians are not found in Europeans.14 Moreover, somatic genomic architectures of LCINS in East Asians are different to Western populations, potentially reflecting varied etiologies.2
This study aimed to summarize the impact of risk factors on LCINS incidence worldwide and separately for Western and East Asian countries.
Methods
This study was prospectively registered (CRD42022379253) on PROSPERO.15 Reporting standards are in accordance with the Preferred Reporting Items for Systematic Reviews and Meta-Analyses (PRISMA) guidelines.16
Eligibility Criteria
Studies that reviewed the association of any risk factor with an outcome of primary LCINS incidence and which adjusted for confounding factors were included. The authors of this study chose to limit studies to those published from 2017. This was to ensure that this review reflects current evidence to maximize its relevance to never-smokers today, and that it would be feasible to complete given the large number of studies identified. Full criteria are listed in Table 1. Of note, potential confounding by individuals who have ever smoked was mitigated by ensuring appropriate identification of never-smokers, for example through study questionnaires.Table 1. Inclusion and Exclusion CriteriaCriteriaInclusionExclusionParticipant
-
•Adults aged ≥18 y old
-
•Never-smokers
-
•Combine never-smokers with individuals who have previously smoked Risk factor
-
•Any risk factor other than those meeting exclusion criteria
-
•Factors identified retrospectively from participants diagnosed with lung cancer
-
•Factors derived from tumor tissue or somatic profile Outcome
-
•Incidence of primary lung cancer
-
•Mortality from lung cancer
-
•Risk of outcome estimated from modelling data instead of derived from study participants
-
•Cancer from other organs which has metastasized to the lungs
-
•Only reported on carcinoid tumors Studies
-
•Published since 2017
-
•Not available in English
-
•Not peer reviewed
-
•Systematic reviews, meta-analyses, case reports, or series
-
•Conference abstracts
Search Strategy
With an experienced medical librarian, a search strategy was created and performed for MEDLINE via OVID, EMBASE, and Scopus (Appendix 1). Two reviewers (SBN and AW/AK) independently screened the abstracts and then the full text. Disagreements were resolved by discussion. Additional studies were identified by hand-searching reference lists of included articles and through prior knowledge of clinical experts.
Data Extraction
Data were extracted using a predefined spreadsheet (Appendix 2) by one reviewer (AW/AK) and validated by a second (SBN). Study investigators were contacted at least twice for missing data.
Risk of Bias
Two reviewers (SBN and AW/AK) independently appraised the studies using the Newcastle-Ottawa Scale (NOS).17 Discrepancies were resolved by discussion. NOS was chosen as it is appropriate for different study designs. Each study could receive a maximum total score of nine, with scores of zero to three, four to six, and seven to nine judged as high, moderate, and low risk of bias, respectively.
Statistical Analysis
Following recommendations from the PROGRESS framework,18 effect estimates such as hazard ratios (HRs) that adjusted for confounding factors were extracted or calculated.19 Meta-analyses were performed if equivalent effect measures were available for at least two studies using a random-effects model with restricted maximum likelihood (REML) estimator. If more than five studies were included, Hartung-Knapp-Sidik-Jonkman correction was applied.20 Narrative synthesis was used where meta-analysis was not possible. Study cohorts were systematically reviewed for potential overlap before synthesis by comparing recruitment sites and time frames.
Heterogeneity was evaluated using Cochran’s Q test, with an a priori significance level of 10% and I^2^ to assess inconsistency between studies. The authors of this study aimed to perform study-level subgroup analyses by region (Western and East Asian), meta-regression by mean age of cohort, and sensitivity analyses excluding studies at high risk of bias.
Analyses were performed in STATA 17.21
Patient and Public Involvement
The aim of patient and public involvement (PPI) was to review the protocol to ensure that it would meet diverse needs and provide insight on findings. Five patients with LCINS and two members of the public were consulted through 30-minute one-to-one meetings. These adults represented different ages, genders, and ethnicities and were compensated for their involvement. A checklist was consulted to report PPI.22
Results
Overview of Included Studies
Of 6,725 reports identified, 115 were included in this systematic review (Fig. 1). These reports were from 54 different studies reporting on 16,153,321 never-smokers; data for number of never-smokers were unavailable for two studies. Thirty-three studies with 8,241,269 never-smokers were in Western countries (including Australia, Europe, and USA), 20 studies with 7,870,686 never-smokers were in East Asian countries (including China, Japan, and South Korea), and one study in Iran. Study characteristics including gender and ethnicity breakdown where available are reported in Appendix 3.Figure 1. Preferred Reporting Items for Systematic Reviews and Meta-Analyses flow diagram. Adapted from: Page MJ, et al. The PRISMA 2020 statement: an updated guideline for reporting systematic reviews. BMJ 2021;372:n71. https://doi.org/10.1136/bmj.n71
This study reports on 192 risk factors investigated through multivariable analysis. The confounding factors adjusted for in these analyses are reported in Appendix 3. A summary of meta-analyses is available in Figures 2 and 3. Factors found to be associated with LCINS are summarized in Table 2.23, 24, 25, 26, 27, 28, 29, 30, 31, 32, 33, 34, 35, 36, 37, 38, 39, 40, 41, 42, 43, 44, 45, 46, 47, 48, 49, 50, 51, 52, 53, 54, 55, 56, 57, 58, 59, 60, 61, 62, 63, 64, 65, 66, 67, 68, 69, 70, 71, 72, 73, 74, 75, 76 A full list of meta-analyses performed and risk factors extracted is available in Appendices 4 to 5.Figure 2. Meta-analyses of risk factors associated with LCINS. LCINS, lung cancer in individuals who have never smoked.Figure 3. Meta-analyses of risk factors not associated with LCINS. LCINS, lung cancer in individuals who have never smoked.Table 2. Factors Associated With LCINS in Meta-Analyses and Single StudiesFactorStudiesHazard Ratio (95% CI)p ValueNo. of Never-SmokersRisk of BiasFactors associated with womenFemale sex (6 of 7 studies)45 and Up23**1.28 (1.12–1.47)**0.005597,1846PLCO247UK Biobank259MJ Health Database267GCS279Kim et al.,28 20258BreastfeedingNHIS29**0.94 (0.90–0.98)0.0084,907,6976CanSPUC305JPHC316Menopausal statusCanSPUC30Natural menopause: RefSurgical:****1.67 (1.32–2.11)0.0002529,8235JPHC31Premenopausal: RefNatural: 1.46 (0.85–2.50)Surgical:1.99 (1.10–3.59)**0.170.0242,6156Benign breast diseaseCanSPUC30**1.24 (1.10–1.41)**0.0007529,8235Respiratory comorbiditiesPleural plaquesARDCO32**3.13 (1.04–9.35)**0.041,3059BronchiectasisNHIS331.44 (1.31–1.57)<0.0012,323,6059Pulmonary tuberculosisNHIS34**1.42 (1.04–1.95)Without COPD:0.91 (0.62–**1.33)0.030.6432,0867Obstructive sleep apneaNHS35**2.96 (1.42–6.18)**0.00431,3236Chronic respiratory diseaseCanSPUC361.94 (1.24-**3.04)0.00475,9177Other comorbiditiesRheumatoid arthritisChatzidionysiou et al.,37 20221.41 (1.15–1.73)**0.001281,4328NHIS388Veterans Health Administration397CancerUK Biobank252.04 (1.95–2.13)<0.00016,419,7229CKB408NHIS419HypertensionNHIS29**1.16 (1.01–1.34)**0.045,260,1016MJ Health Database267CanSPUC425Symptomatic peripheral arterial diseaseARIC43**9.08 (1.16–71.34)**0.045,5488Hepatobiliary diseaseCanSPUC421.29 (1.21–1.37)<0.0001794,2835Gastrointestinal diseasesCanSPUC421.30 (1.22–1.38)<0.0001794,2835Oral microbiomeSMHS and SWHS44Some associated with increased risk, e.g., Lactobacillales order medium vs. low OR 2.15 (1.03–4.47), some with decreased, e.g., Bacteroidetes order high vs. low OR 0.31 (0.15–0.64)Various1808MedicationAnti-hypertensives (1 of 2 studies)NHIS45CCB: RefARB: 0.64 (0.42–0.99)0.0439,7849Oral bisphosphonateWHI460.57 (0.39–0.84)0.00475,9627Metformin use for diabetesNHIS47Compared with non-diabetics:0.86 (0.74–0.99)Compared with diabetics who had never used metformin:0.87 (0.71–1.07)0.040.18515,1009Aspirin, statin, and metforminNHIS47Use ≥547.5 d:0.38 (0.20–0.73)0.003515,1009Family historyNumber of relatives with lung cancerCanSPUC421.31 (1.24–1.39)<0.0001794,2835FatherCanSPUC482.15 (1.66–2.77)<0.0001547,2186MotherCanSPUC481.33 (1.14–1.57)0.0005547,2186SiblingsCanSPUC482.02 (1.30–3.12)0.002547,2186Family history of any cancerCanSPUC421.31 (1.24–1.40)<0.0001794,2835Sociodemographic factorsDeprivation (2 of 3 studies)BWHS491.30 (1.03–1.63) per 10 U increase of neighborhood concentrated disadvantage index0.0237,6505THIN50Womena:1 (least deprived): Ref2: 1.01 (0.88–1.16)3: 0.92 (0.79–1.07)4: 0.98 (0.83–1.15)5: 1.13 (0.94–1.36)Mena:1 (least deprived): Ref2: 0.98 (0.84–1.15)3: 1.01 (0.85–1.20)4: 1.24 (1.04–1.48)****5: 1.42 (1.15–1.76)0.310.0023,679,8317EthnicityDeRouen et al.,51 2022Non-Hispanic white: RefAANHPI: 1.69 (1.38–2.02)Black: Not availableHispanic: 0.84 (0.56–1.23)a<0.00010.39889,8706PLCO51Non-Hispanic white: RefHispanic: 0.76 (0.11–5.58)Asian: 1.00 (0.41–2.50)0.790.99549,5697Country of birth45 and Up23Asian: 2.83 (1.64–4.89)****0.0002132,3546Physical measurementsBMI (5 of 9 studies)SIDIAP770.95 (0.91–1.00) per 5 kg/m^2^ increase0.032,339,363845 and Up23<18.5: 1.98 (1.16–3.39)18.5–25: Ref≥ 25–< 30: 0.92 (0.65–1.30)≥ 30: 1.01 (0.64–1.59)0.05132,3546NHIS29<18.5: 0.93 (0.83–1.03)18.5–<23: Ref23–<25: 0.95 (0.91–0.99)****25–<30: 0.95 (0.91–0.99)≥30: 0.97 (0.90–1.05)0.190.020.020.454,335,2596CKB40<18.5: 1.45 (1.21–1.73)****18.5–23.9: 1.17 (1.08–1.27)≥24: Ref<0.001<0.001336,5268MJ Health Database26<18.5: 0.77 (0.50–1.18)18.5–23.9: Ref24–27.9: 0.80 (0.64–0.99)≥28: 0.72 (0.51–1.03)0.230.040.08130,5597BMI changeKailuan52Major loss <1.0 kg/m^2^/y:**1.97 (1.12–3.45)Major gain ≥1.0 kg/m^2^/y:2.15 (1.15–4.02)0.020.0237,0857Lifestyle factorsSleep duration (<6 or >9 h)CanPath531.52 (1.01–2.29)b0.00089507Environmental factorsPassive smoking45 and Up231.30 (1.22–1.40)<0.00011,075,3586CanSPUC425BWHS495PLCO247NOWAC547Li et al.,55 20207PM_10_NHIS561.10 (1.09–1.11)<0.0013,782,6848UK Biobank579PM_2.5_WHI581.16 (1.03–1.30)0.02839,1688NHIS599AHSMOG-2607UK Biobank579CKB619MJ Health Database267BWHS495Wood-burningSister Study781–29/d/y:1.64 (0.87–3.10)≥1 mo/y:****1.99 (1.02–3.89)0.130.0428,2907Pesticides, e.g., chlorimuron-ethylAHS62Non-exposed: Ref<median: 2.17 (0.92–5.11)>median: 3.80 (1.53–9.48)0.080.00426,8597Distance to A1 (busy London road) (m)WHI58>200: Ref50–<200: 0.82 (0.34–1.98)<50: 5.23 (1.94–14.13)**0.670.00165,4198Occupational exposure to hazardous substancesCanSPUC42**1.29 (1.21–1.37)<0.0001794,2835Air pollutionCanSPUC421.29 (1.22–1.37)<0.0001794,2835Cooking oil fumesCanSPUC421.29 (1.22–1.37)<0.0001794,2835Dietary intakeAHEI-2010 (2 of 3 studies)MEC6325.1–56.6: Ref56.7–62.2: 0.83 (0.64–1.08)62.3–67.1: 0.82 (0.63–1.06)67.2–72.6: 0.91 (0.71–1.18)72.7–104.5: 0.66 (0.50–0.87)0.160.140.480.00380,6359WHI64Q1: RefQ2: 0.69 (0.47–1.02)Q3: 0.60 (0.40–0.91)Q4: 0.59 (0.39–0.93)Q5: 0.98 (0.67–1.43)0.060.020.020.9241,9507Laboratory testsWhite blood cell countUK Biobank65Women≤5.55: Ref5.55–6.51: 1.27 (0.76–2.13)6.51–7.67: 1.09 (0.64–1.88)>7.67: 1.82 (1.10–3.00)**0.370.750.02232,5289Neutrophil-to-lymphocyte ratioUK Biobank65Women: **1.20 (1.01–1.43)Men: 1.06 (0.85–1.33)0.030.62232,5289Platelet countUK Biobank66Women: 1.18 (1.04–1.34)Men: 1.13 (0.95–1.34)0.010.18222,8938eGFRMJ Health Database26≥90: Ref60–89: 1.58 (1.25–2.00)****45–59: 1.85 (1.23–2.79)<45: 1.47 (0.54–**4.06)<0.0010.0030.45130,5597Total cholesterolKailuan67**Q1: 1.42 (1.05–1.93)Q2: RefQ3: 1.46 (1.07–2.00)Q4: 1.24 (0.90–**1.70)**Q5: 1.38 (1.01–1.89)**0.020.020.190.0456,0977LDL-CKailuan67**Q1: 1.39 (1.02–1.89)Q2: RefQ3: 1.17 (0.83–**1.65)**Q4: 1.58 (1.14–2.20)****Q5: 1.42 (1.00–2.02)**0.040.380.0060.0556,0977FolateCHHRS68<6.72 ng/mL: **1.72 (1.11–2.66)**b0.0155585-mTHFCHHRS68<5.80 ng/mL: **1.58 (1.02–2.43)b0.045558CEAMJ Health Database261.06 (1.04–1.08)<0.001130,5597sIL-6RSWHS69Q1: RefQ2: 1.20 (0.69–**2.10)**Q3: 1.91 (1.12–3.23)****Q4: 2.37 (1.40–4.02)b0.540.020.0015119IL-21SWHS69Q1: RefQ2: 0.99 (0.59–**1.64)**Q3: 0.51 (0.29–0.89)**Q4: 0.53 (0.31–0.93)b0.970.020.025119Genetic informationLeukocyte telomere lengthSingapore Chinese Health Study70AdenocarcinomaQ1 (shortest): RefQ2: 1.22 (0.65–2.29)Q3: 1.53 (0.84–2.81)Q4: 1.39 (0.74–**2.60)Q5: 3.14 (1.80–5.49)0.550.170.31<0.00118,0348SMHS71Q1 (shortest): RefQ2: 1.37 (0.71–2.62)Q3: 3.48 (1.85–6.57)Q4: 1.85 (0.99–3.44)b0.350.00010.053238SWHS71Q1 (shortest): RefQ2: 1.45 (1.05–2.02)****Q3: 1.76 (1.28–2.43)****Q4: 2.10 (1.52–2.90)0.030.0005<0.000115908UK Biobank72Per IQR change:1.45 (1.23–1.71)<0.001234,3028Lung cancer–related CpG sitesNOWAC73Various, including cg10151248-PC0.36 (0.17-0.77)b and cg13482620-B3GNTL10.31 (0.14-0.67)bVarious717Urinary testsUrine metabolomicsSWHS74pos_2.61_127.0382m/z0.57 (0.46–0.72)bneg_2.60_369.0408m/z0.97 (0.96–0.98)bpos_2.61_184.0325n0.55 (0.43–0.71)b5-methyl2-furoic acidTertile 1: RefT2: 0.52 (0.34–0.80)****T3: 0.46 (0.30–0.70)b<0.001<0.001<0.0010.003<0.0015649Urinary phytoestrogensSWHS75IsoflavonesQ1: RefQ2: 0.57 (0.39–0.83)****Q3: 0.64 (0.44–0.92)****Q4: 0.60 (0.41–0.86)b0.049568Urinary benzothiazole, benzotriazole, and derivativesQEEHH76Urinary 2-hydroxy-benzothiazole2.44 (1.29–4.62)b<0.012288Note: Values in bold are statistically significant.5-mTHF, etabolically active folate; BMI, body mass index; CCB, calcium channel blocker; CEA, carcinoembryonic antigen test; CI, confidence interval; COPD, chronic obstructive pulmonary disease; eGFR, estimated glomerular filtration rate; IL, interleukin; IQR, interquartile range; LCINS, lung cancer in individuals who have never smoked; LDL-C, low density lipoprotein-cholesterol; PM, particulate matter; Ref, reference; sIL-6R, soluble interleukin-6 receptor.aIncidence rate ratio.bOR.
Factors Associated With Women
Female sex was associated with LCINS in meta-analysis of six studies (adjusted HR [aHR] 1.28 [95% CI 1.12–1.47], p = 0.005, I^2^ = 0.0%, Hetp = 0.73, n = 597,184; Fig. 2).23, 24, 25, 26, 27, 28
Breastfeeding (aHR 0.94 [95% CI 0.90–0.98], p = 0.008, I^2^ = 0.0%, Hetp = 0.66, n = 4,907,697)29, 30, 31 was minimally protective against LCINS in meta-analysis of three studies.
Individuals with surgical menopause were more likely to have LCINS than those who had undergone natural menopause (aHR 1.67 [95% CI 1.32–2.11], n = 529,823)30 and those who were premenopausal (aHR 1.99 [95% CI 1.10–3.59], n = 42,615) when adjusted for age and other confounders.31
None of the other factors associated with women reported in multiple studies, including hormone replacement therapy (Fig. 3, Appendix 5), were consistently associated with LCINS.
Of four factors reported in one study each, only benign breast disease (aHR 1.24 [95% CI 1.10–1.41], n = 529,823) was associated with LCINS.30
All studies had low-moderate risk of bias.
Respiratory Comorbidities
There was no statistical evidence that COPD/obstructive spirometry was associated with LCINS in meta-analysis of five studies with low-moderate risk of bias (aHR 1.54 [95% CI 0.94–2.54], p = 0.07, I^2^ = 85.5%, Hetp < 0.0001, n = 997,817; Fig. 3).23^,^40^,^79, 80, 81 None of these studies accounted for pollution exposure as a confounder; all confirmed never-smoking status through questionnaires.
Of factors reported in single studies with low risk of bias, pleural plaques in a study adjusting for asbestos exposure (aHR 3.13 [95% CI 1.04–9.35], n = 1305),32 bronchiectasis (aHR 1.44 [95% CI 1.31–1.57], n = 2,323,605),33 and chronic respiratory disease (aHR 1.94 [95% CI 1.24–3.04], n = 75,917)36 were associated with LCINS. In a study with moderate risk of bias, obstructive sleep apnea (aHR 2.96 [95% CI 1.42–6.18], n = 31,323)35 was associated with LCINS; this was adjusted for body mass index (BMI). Although pulmonary tuberculosis was associated with LCINS (aHR 1.42 [95% CI 1.04–1.95]) in a study with low risk of bias, this association did not persist among participants without COPD (aHR 0.91 [95% CI 0.62–1.33], n = 32,086).34
Other Comorbidities
Meta-analysis was performed for nine factors (Appendix 4). Previous history of cancer (aHR 2.04 [95% CI 1.95–2.13], p < 0.0001, I^2^ = 24.8%, Hetp = 0.27, n = 6,419,722; Fig. 2)25^,^40^,^41 was associated with LCINS in three studies, all with very low risk of bias.
Rheumatoid arthritis (aHR 1.41 [95% CI 1.15–1.73], p = 0.001, I^2^ = 0.0%, Hetp = 0.41, n = 281,432; Fig. 2)37, 38, 39 was associated with LCINS in three studies, all with low risk of bias. One of these studies also reported that mortality from lung cancer in participants with rheumatoid arthritis was similar to incidence, reducing the likelihood that this association is due to lead-time bias and increased imaging.
Hypertension (aHR 1.16 [95% CI 1.01–1.34], p = 0.04, I^2^ = 93.5%, Hetp < 0.0001, n = 5,260,101; Appendix 4)26^,^29^,^42 was associated with LCINS in three studies with low-moderate risk of bias.
Notably, meta-analysis of two studies with low-moderate risk of bias did not find receiving radiotherapy for primary breast cancer (aHR 1.04 [95% CI 0.64–1.67], p = 0.56, I^2^ = 80.6%, Hetp = 0.02, n = 6703; Fig. 3)82^,^83 was associated with LCINS.
Symptomatic peripheral arterial disease (aHR 9.08 [95% CI 1.16–71.34], n = 5548)43 was associated with LCINS in a single study with low risk of bias. This association persisted even after adjustment for possible confounders, including cardiovascular disease and diabetes. Certain oral microbiome was also associated with LCINS in a study with low risk of bias (Table 2).
In studies with moderate risk of bias, hepatobiliary (aHR 1.29 [95% CI 1.21–1.37])42 and gastrointestinal diseases (aHR 1.30 [95% CI 1.22–1.38], both n = 794,283)42 were associated with LCINS.
Family History
Meta-analysis of six studies globally with low-moderate risk of bias did not find family history of lung cancer to be associated with LCINS (aHR 1.24 [95% CI 0.79–1.95], p = 0.03, I^2^ = 73.6%, Hetp = 0.002, n = 1,271,413; Fig. 3).23, 24, 25, 26^,^48^,^84 Three of these studies adjusted for passive smoking and another adjusted for pollution.
Of note, subgroup analysis found that family history of lung cancer differed by region (p value for subgroup differences = 0.006); it was associated with LCINS in three studies with low-moderate risk of bias in East Asia (aHR 1.56 [95% CI 1.23–1.98], I^2^ = 0.0%, n = 867,216) but not in three studies with low-moderate risk of bias in Western countries (aHR 0.86 [95% CI 0.35–2.11], I^2^ = 52.8%, n = 404,197).
One East Asian study, which had moderate risk of bias, did report an association between LCINS and maternal, sibling, and especially paternal lung cancer (paternal lung cancer aHR 2.15 [95% CI 1.66–2.77], n = 547,218), even after adjusting for passive smoking.48 It also found an increasing number of relatives with lung cancer increased risk of LCINS (aHR 1.31 [95% CI 1.24–1.39], n = 794,283).42
An East Asian study with moderate risk of bias also found that family history of any cancer (aHR 1.31 [95% CI 1.24–1.40], n = 794,283) was associated with LCINS.42
Sociodemographic Factors
There was no association between educational attainment and LCINS in meta-analysis of four studies with low-moderate risk of bias (aHR 1.16 [95% CI 0.97–1.38], p = 0.10, I^2^ = 57.10%, Hetp = 0.07, n = 1,003,858; Fig. 3).26^,^27^,^42^,^49
Two of three studies reporting on deprivation found an association with LCINS (Appendix 5); men living in more deprived areas (highest deprivation score: incidence rate ratio [IRR] 1.42 [95% CI 1.15–1.76], n = 3,679,831)50 were more likely to have LCINS in one study with low risk of bias, whereas living in a more deprived neighborhood (aHR 1.30 [95% CI 1.03–1.63], n = 37,650)49 was associated with LCINS in another study with moderate risk of bias.
There was no association between LCINS and income in two studies with moderate risk of bias (Appendix 5).29^,^49
Two studies performed a multivariable analysis of LCINS and ethnicity. Both studies were of individuals living in America. One study with low risk of bias found that Hispanic and Asian ethnicities were not associated with LCINS (e.g., Asian ethnicity aHR 1.00 [95% CI 0.41–2.50], n = 49,569).24 Another larger study but with moderate risk of bias reported an increased incidence of LCINS among women of Asian American, Native Hawaiian, and Pacific Islander ethnicity (IRR 1.69 [95% CI 1.38–2.02], n = 889,870) compared with non-Hispanic white women.51 In addition, an Australian study with moderate risk of bias found participants who had been born in Asian countries had increased risk of LCINS (aHR 2.83 [95% CI 1.64–4.89], n = 132,354) compared with those born in non-Asian countries.23
Physical Measurements
Of nine studies with low-moderate risk of bias, five found lower BMI associated with LCINS (n = at least 7,366,661 with one study having unknown number of never-smokers; Table 2). For example, two studies reported BMI less than 18.5 was associated with LCINS (aHR 1.98 [95% CI 1.16–3.39] compared with BMI 18.5–25, n = 132,35423 and aHR 1.45 [95% CI 1.21–1.73] compared with BMI more than or equal to 24, n = 336,526).40 Furthermore, BMI change of more than or equal to 1.0 kg/m^2^/y was associated with LCINS (loss: aHR 1.97 [95% CI 1.12–3.45], gain: aHR 2.15 [95% CI 1.15–4.02], n = 37,085) in a study with low risk of bias.52
Three of five studies (n = at least 542,737) with low-moderate risk of bias did not find an association between LCINS and height (Appendix 5).
Lifestyle Factors
Only two of eight studies (n = at least 4,501,339) with low-moderate risk of bias reported an association between LCINS and physical inactivity, and only one of six studies (n = at least 5,458,489) with low-moderate risk of bias reported an association with alcohol consumption (Appendix 5).
One study with low risk of bias found sleep duration of less than six or more than nine hours was associated with LCINS (aOR 1.52 [95% CI 1.01–2.29], n = 950).
Environmental Factors
Meta-analysis of six studies with low-moderate risk of bias found an association between passive smoking and LCINS (aHR 1.30 [95% CI 1.22–1.40], p < 0.0001, I^2^ = 0.0%, Hetp = 0.55, n = 1,075,358; Fig. 2).23^,^24^,^42^,^49^,^54^,^55 Two studies, both with low risk of bias, further reported on in utero85 and childhood smoking exposure24; neither was associated with LCINS.
Meta-analysis of two studies with low risk of bias found pollution as measured by PM10 was associated with LCINS (aHR 1.10 [95% CI 1.09–1.11], p < 0.001, I^2^ = 0.0%, Hetp = 0.88, n = 3,782,684; Fig. 2).56^,^57^,^59 Meta-analysis of seven studies, of which six had low and one had moderate risk of bias, found pollution as measured by PM2.5 was also associated with LCINS (aHR 1.16 [95% CI 1.03–1.30], p = 0.02, I^2^ = 6.5%, Hetp = 0.38, n = 839,168; Fig. 2).26^,^49^,^57, 58, 59, 60, 61 Only one of these studies adjusted for other pollution measures.
Neither meta-analysis of two studies reporting nitrogen dioxide (NO_2_) per 10 ppb (aHR 0.92 [95% CI 0.81–1.05], p = 0.22, I^2^ = 0.00%, Hetp = 1.00, n = 121,373; Fig. 3)58^,^59 nor a single study reporting NO_2_ per 10 μg/m^3^ (aHR 0.98 [95% CI 0.85–1.13], n = 246,664; Appendix 5)57 found an association with LCINS. All three studies had low risk of bias.
Neither meta-analysis of three studies reporting on hazard of urban residence (aHR 1.04 [95% CI 0.84–1.28], p = 0.71, I^2^ = 92.90%, Hetp < 0.0001, n = 6,238,814; Fig. 3)27^,^40^,^41 nor a single study reporting incidence rate ratios (Appendix 5)50 found an association with LCINS. All four studies had low risk of bias.
Of factors reported in single studies with low risk of bias, exposures to wood-burning more than one month a year (aHR 1.99 [95% CI 1.02–3.89], n = 28,290),78 a busy London road (aHR 5.23 [95% CI 1.94–14.13], n = 65,419),58 and pesticides such as chlorimuron-ethyl (aHR 3.80 [95% CI 1.53–9.48], n = 26,859)62 were associated with LCINS. In a study with moderate risk of bias (n = 794,283), occupational exposures to hazardous substances (aHR 1.29 [95% CI 1.21–1.37]), air pollution, and cooking oil fumes (both aHR 1.29 [95% CI 1.22–1.37]) were also associated with LCINS.42 Of note, occupational radon exposure was not associated with LCINS (Appendix 5).86
Laboratory Tests
Blood Tests
The association between LCINS and testosterone, C-reactive protein, and bilirubin was reviewed in two studies each with low-moderate risk of bias; there was no consistent association of these blood tests with LCINS (Appendix 5).
In single studies with low risk of bias, women with high white blood cell count (aHR 1.82 [95% CI 1.10–3.00]),65 neutrophil-to-lymphocyte ratio (aHR 1.20 [95% CI 1.01–1.43], both n = 232,528),65 and platelet count (aHR 1.18 [95% CI 1.04–1.34], n = 222,893)66 and adults with deranged kidney function (eGFR 45–59 aHR 1.85 [95% CI 1.23–2.79], n = 130,559),26 total cholesterol, and low-density lipoprotein-cholesterol (Table 2; n = 56,097) were more likely to have LCINS.67 Low folate (aOR 1.72 [95% CI 1.11–2.66]) and 5-mTHF (metabolically active folate, aOR 1.58 [95% CI 1.02–2.43], both n = 555) were associated with LCINS.68 Carcinoembryonic antigen (CEA) was also associated with LCINS (aHR 1.06 [95% CI 1.04–1.08], n = 130,559).26
In a study with low risk of bias, certain immune markers including high s-IL6R (a regulator of inflammatory response, aOR 2.37 [95% CI 1.40–4.02]) and low IL-21 (involved in immune cell proliferation and differentiation, aOR 0.53 [95% CI 0.31–0.93], all n = 511) (Table 2) were associated with LCINS at mean follow-up of 7.5 years.69
Of note, vitamin D level was not associated with LCINS in a study with low risk of bias.87
Genetic Information
Meta-analysis of two studies with low risk of bias found no association between LCINS and mosaic loss of chromosome Y (aHR 0.99 [95% CI 0.75–1.32), p = 0.97, I^2^ = 17.4%, Hetp = 0.27, n = 117,392)88 or clonal hematopoeisis (aHR 1.55 [95% CI 1.00–2.41], p = 0.05, I^2^ = 0.0%, Hetp = 0.85, n = 1273).89
Leukocyte telomere length was reported in four studies with low risk of bias (n = 254,249, Table 2) and all were suggestive of an association between longer length and LCINS (e.g., per interquartile range (IQR) change aHR 1.45 [95% CI 1.23–1.71], n = 234,302).72
In a single study with low risk of bias, various lung cancer–related CpG sites were found to be associated with LCINS. For example, cg10151248-PC and cg13482620-B3GNTL1 were found to be associated with reduced future risk of LCINS (aOR 0.36 [95% CI 0.17–0.77] and aOR 0.31 [95% CI 0.14–0.67], respectively; n = 71).73
Factors associated with medication, dietary intake, and urine laboratory tests are available in Appendix 6.
Subgroup Analyses by Geographic Region
Prespecified subgroup analysis by geographic region was able to be performed for 11 of 32 meta-analyses (Appendix 7). Only two factors differed by region: family history of lung cancer (discussed previously, p value for subgroup differences = 0.006) and periodontitis (p value for subgroup differences = 0.001).
Periodontitis was associated with LCINS in one study with low risk of bias in East Asia (aHR 3.56 [95% CI 2.68–4.72], n = 90,947) but not in two studies with low-moderate risk of bias in Western countries (aHR 1.11 [95% CI 0.61–2.03], I^2^ = 47.6%, n = 36,944). None of these studies adjusted for socioeconomic status as a possible confounder.
Subgroup Analyses by Age
Subgroup analysis by age was able to be performed for 12 of 32 meta-analyses (Appendix 7); there was no evidence that mean age affected association of any risk factor with LCINS.
Risk of Bias
No studies were assessed as having high risk of bias (Appendix 8). Of note, 16 of 32 meta-analyses included studies with low risk of bias. These include meta-analyses of studies reviewing history of cancer, rheumatoid arthritis, cardiovascular disease, PM10, and NO_2_.
The overall risk of bias across each domain is summarized in Figure 4.90 Cohort studies scored lowest for adequacy of follow-up, with 45.5% of reports accounting for at least 90% of subjects or describing participants lost to follow-up. Only 67.3% used a cohort which was representative of an average never-smoker in the community. Case-control studies scored lowest for response rate, with 40.0% specifying the same rate for both groups.Figure 4. Summary of risk of bias for cohort and case-control studies.
Discussion
This study comprehensively reviewed and summarized 192 risk factors with 32 meta-analyses for LCINS. Meta-analysis of studies using multivariable analysis to account for possible confounding factors quantifies the association of factors associated with LCINS diagnosis, including female sex, previous history of cancer, rheumatoid arthritis, passive smoking, and pollution as measured by PM10 and PM2.5. Of note, in planned subgroup analyses, family history of lung cancer was associated with LCINS in East Asian but not Western countries. Narrative review also suggests that surgical menopause, deprivation, Asian ethnicity and country of birth, lower BMI, increased height and leukocyte telomere length are associated with LCINS. No studies were assessed as having high risk of bias.
Lung cancer referral guidelines and risk assessment tools usually prioritize smoking status and may not relate specifically to never-smokers, making such tools less valuable for identifying high-risk never-smokers.91 These factors are therefore useful for clinicians to review during consultations to guide appropriate referral and investigations.
This systematic review also provides a basis for further research and designing early diagnosis interventions. Together with their patient representatives, the authors of this study advocate prioritizing four areas. First, the review provides evidence for and quantifies the association of factors that may be combined to develop risk prediction models for screening.
Second, their patients also advocate investigating the causality of these factors. Of note, female sex was associated with LCINS. However, among factors associated with women, only surgical menopause was significantly associated with LCINS, whereas other factors including hormone replacement therapy, hormonal contraception, and parity were not associated. Further research to determine causality could lead to more effective risk mitigation strategies in this important group.
Third, although this study aimed to review differences between Western and East Asian countries, few studies were found outside these areas and further studies in other geographical areas should be supported. In Ghana, for example, 61% of lung cancer is identified in never-smokers,92 but risk factors are poorly understood.
Finally, heterogeneity in reporting risk factors complicates public health messaging and undermines early detection interventions.93 A global registry of lung cancer risk studies with standardized methods and a minimum data set including data such as sex and smoking status would significantly improve understanding of risk factors and research applicability. This study also identifies multiple factors that were only reported by single studies, and further evidence is required to validate the findings.
This review is unique for its inclusion of PPI who developed and supported the study and co-designed an infographic for dissemination of key findings. Researchers felt that there were important positive consequences from PPI input. Patient feedback helped researchers to understand what was important and led to protocol amendments; for example, subgroup analyses by geographical region and age were prespecified. Patients reviewed findings to provide their perspective and would like to highlight its importance to different groups. For example, factors such as passive smoking and deprivation, if addressed by individuals or organizations, can affect LCINS incidence. Factors such as rheumatoid arthritis are important for clinicians to be aware of when reviewing patients to ensure prompt investigation and referral of symptoms.
This review has other strengths. The authors of this study were comprehensive in their summary by extracting relevant information on never-smokers only from studies with mixed populations of individuals who have never and ever smoked. The applicability of the findings is increased as recommended review methodology was used.18 Furthermore, no studies had high risk of bias.
Nevertheless, this review has some limitations. Many risk factors were reviewed by a small number of studies with high heterogeneity, limiting further analysis including subgroup and reporting bias. Risk factors reported as not associated with LCINS may therefore reflect a lack of statistical significance. Furthermore, these limited data preclude reviewing subgroup differences by ethnicity and between people of East Asian ethnicity living in Western and East Asian countries. As LCINS rates likely differ between ethnic groups, the impact of risk factors on people from different ethnicities requires further study.94 Data on risk factors associated with lung cancers with specific mutations such as EGFR were also unavailable in this review. Furthermore, some studies did not account for any confounding factors and were not included in this review. Others did not adjust for potentially important confounding factors. In particular, pollution exposure was rarely measured or adjusted for and cannot be excluded as a confounder, for example, in the relationship between family history of lung cancer and LCINS. There were also challenges with data extraction and synthesis. For example, many studies categorized continuous data. Therefore, meta-analyses were performed where this was appropriate and narrative synthesis used otherwise.
In summary, this study evaluated 192 risk factors and summarized and quantified key factors associated with LCINS worldwide, including female sex, rheumatoid arthritis, and pollution, for use in a potential tool to identify high-risk never-smokers for the early detection of LCINS.
CRediT Authorship Contribution Statement
Sindhu Bhaarrati Naidu: Conceptualization, Methodology, Formal analysis, Investigation, Data curation, Writing - original draft, Writing - review & editing, Visualization, Project administration, Funding acquisition.
Allegra Wisking: Investigation, Writing - review & editing.
Akul Karoshi: Investigation, Writing - review & editing.
Sarah Burdett: Methodology, Formal analysis, Validation, Writing - review & editing, Visualization.
Peter J. Godolphin: Methodology, Formal analysis, Validation, Writing - review & editing, Visualization.
Sanjay Popat: Writing - review & editing.
OLIVE PPI Group: Conceptualization, Methodology, Writing - review & editing, Visualization.
Sam M. Janes: Resources, Writing - review & editing, Supervision, Funding acquisition.
Neal Navani: Conceptualization, Methodology, Validation, Resources, Writing - original draft, Writing - review & editing, Visualization, Supervision, Project administration, Funding acquisition.
Disclosure
Popat has received consulting fees and/or is on advisory boards for AnHeart Therapeutics, Amgen, AstraZeneca, Bayer, Arcus Biosciences, Bristol Myers Squibb, Boehringer Ingelheim, Ellipses, Erasca, Daiichi Sankyo, Gilead, GlaxoSmithKline, Guardant Health, IO Biotech, Janssen, Lilly, Merck KGaA, Mirati, Merck Sharp & Dohme, Novocure, Novartis, Pharmamar, Roche, Sanofi, Takeda, Pfizer, Pierre Fabre, Turning Point Therapeutics, and Regeneron. He reports receiving honoraria from Amgen, AstraZeneca, Bayer, Gilead, Guardant Health, Janssen, Merck KGaA, Roche and Takeda. He has received travel expenses from Gilead. He had unpaid leadership roles in British Thoracic Oncology Group, ALK Positive UK, Lung Cancer Europe, Ruth Strauss Foundation, and ETOP-IBCSG Partners Foundation Board. Janes has received fees for advisory board membership in the last three years from Bard1 Lifescience. He has received grant income from GRAIL Inc. He is an unpaid member of a GRAIL advisory board. He has received lecture fees for academic meetings from Cheisi and AstraZeneca. His wife works for AstraZeneca. Navani reports receiving honoraria for non-promotional educational talks or advisory boards from Amgen, AstraZeneca, Boehringer Ingelheim, Bristol Myers Squibb, EQRx, Fujifilm, Guardant Health, Intuitive, Janssen, Lilly, Merck Sharp & Dohme, Sanofi, Olympus, and Roche. The remaining authors declare no conflict of interest.
The reference list from the paper itself. Each links out to its DOI / PubMed record.
- 1Bray F.Laversanne M.Sung H.Global cancer statistics 2022: GLOBOCAN estimates of incidence and mortality worldwide for 36 cancers in 185 countries CA Cancer J Clin 7420242292633857275110.3322/caac.21834 · doi ↗ · pubmed ↗
- 2Sun S.Schiller J.H.Gazdar A.F.Lung cancer in never smokers — a different disease Nat Rev Cancer 720077787901788227810.1038/nrc 2190 · doi ↗ · pubmed ↗
- 3Kerpel-Fronius A.Tammemägi M.Cavic M.Screening for lung cancer in individuals who never smoked: an International Association for the Study of Lung Cancer early detection and screening committee report J Thorac Oncol 17202256663445506510.1016/j.jtho.2021.07.031 · doi ↗ · pubmed ↗
- 4National Lung Cancer Audit State of the Nation 2024 https://www.natcan.org.uk/wp-content/uploads/2025/07/NLCA-State-of-the-Nation-2024_16.05.24_V 2.0-1.pdf Published Online 2024
- 5Lyratzopoulos G.Neal R.D.Barbiere J.M.Rubin G.P.Abel G.A.Variation in number of general practitioner consultations before hospital referral for cancer: findings from the 2010 National Cancer Patient Experience Survey in England Lancet Oncol 1320123533652236549410.1016/S 1470-2045(12)70041-4 · doi ↗ · pubmed ↗
- 6Dias M.Linhas R.Campainha S.Conde S.Barroso A.Lung cancer in never-smokers – what are the differences?Acta Oncol 5620179319352851493110.1080/0284186 X.2017.1287944 · doi ↗ · pubmed ↗
- 7UK National Screening Committee Targeted Screening for Lung Cancer in Individuals at Increased Riskhttps://view-health-screening-recommendations.service.gov.uk/lung-cancer/Published Online September 2022
- 8Chang G.C.Chiu C.H.Yu C.J.Low-dose CT screening among never-smokers with or without a family history of lung cancer in Taiwan: a prospective cohort study Lancet Respir Med 1220241411523804216710.1016/S 2213-2600(23)00338-7 · doi ↗ · pubmed ↗