Using biodiversity features to promote an Ecosystem-Based Conservation framework in terrestrial ecosystems
Florence Godfrey Tarimo, Francis Moyo, Linus Kasian Munishi

TL;DR
This paper explores how biodiversity features can improve conservation efforts in Tanzania's terrestrial ecosystems, highlighting gaps in current protected areas.
Contribution
The study introduces a new ecosystem-based conservation framework using biodiversity data from multiple taxonomic groups in Tanzania.
Findings
Montane forests in Tanzania have the highest biodiversity features but less than a third of their area is protected.
Only 41% of biodiversity features in Tanzania's ecosystems are within protected areas.
Invertebrates are often overlooked in conservation planning, indicating a need for broader strategies.
Abstract
Biodiversity features are important indicators for monitoring conservation success and have been adopted to assess the extent of biodiversity loss in ecosystems affected by anthropogenic pressures. Protected areas (PAs) form the basis of the modern conservation framework and are the heart of conserving biodiversity. Despite PAs being the cornerstones for biodiversity conservation, they are limited in extent and their ability to inclusively conserve and safeguard biodiversity. We performed a literature review and spatial analysis across terrestrial ecosystems in Tanzania to investigate how biodiversity features can guide and promote an ecosystem-based conservation approach. We compiled biodiversity features for three taxonomic groups (plants, vertebrates, and invertebrates), resulting in a total sum of 22,987 features across eight terrestrial ecosystems in Tanzania. Our results revealed…
Genes, proteins, chemicals, diseases, species, mutations and cell lines named across the full text — each resolved to its canonical identifier and authoritative record.
Click any figure to enlarge with its caption.
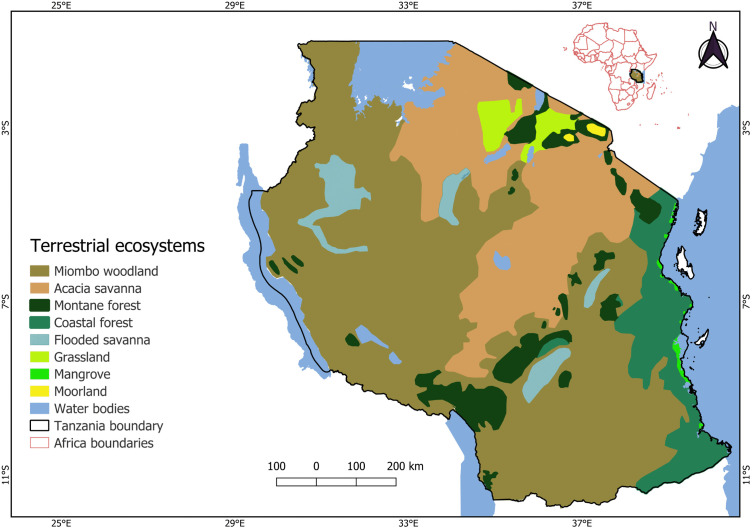 Fig 1
Fig 1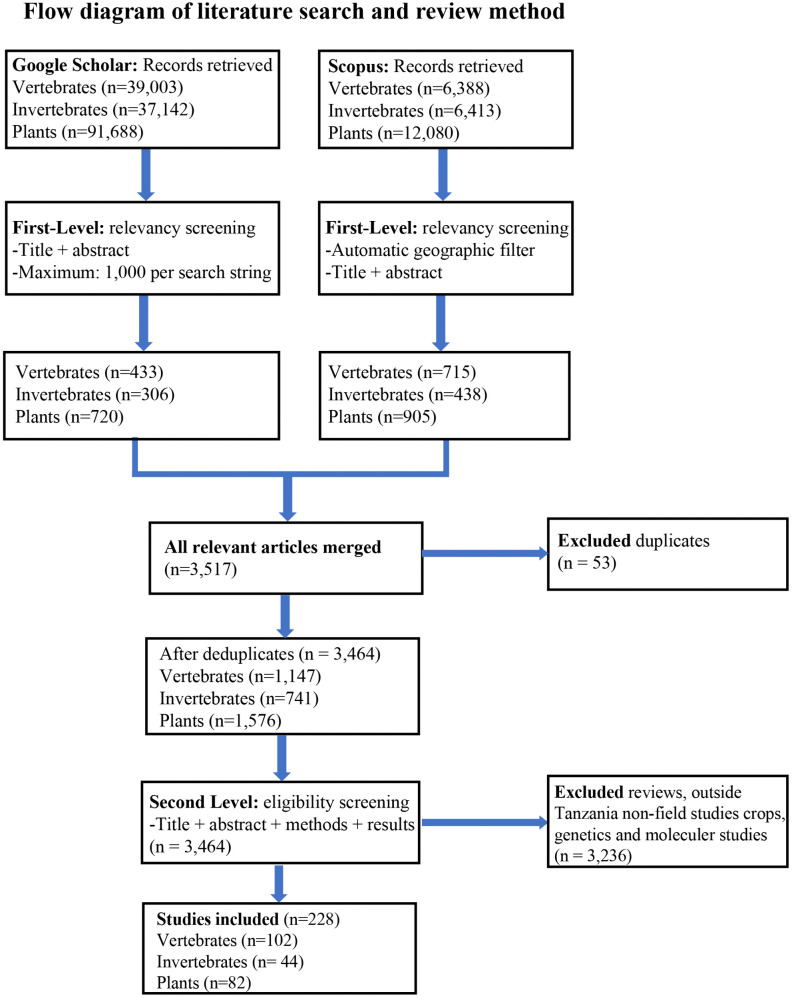 Fig 2
Fig 2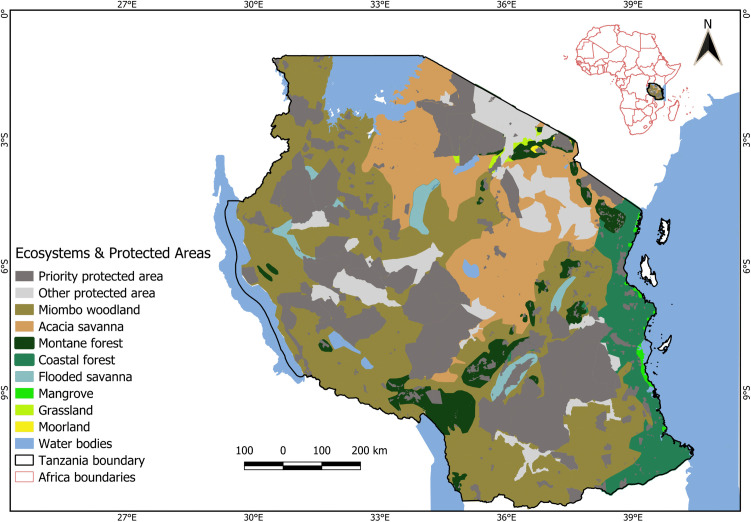 Fig 3
Fig 3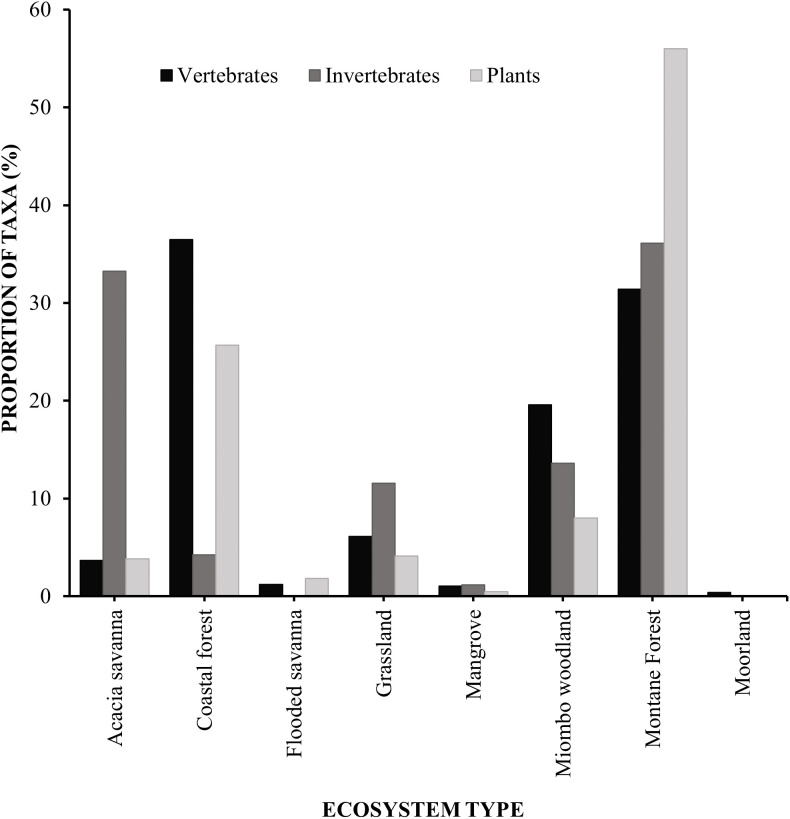 Fig 4
Fig 4Peer Reviews
No public reviews on file for this paper yet. If you reviewed it on a platform where reviews are public (OpenReview, ICLR, NeurIPS, ICML), you can paste yours below so the community can read it here.
Videos
No videos yet. Explain this paper in a talk, walkthrough, or lecture? Add one.
Taxonomy
TopicsEcology and Vegetation Dynamics Studies · Land Use and Ecosystem Services · Conservation, Biodiversity, and Resource Management
Introduction
Protected areas (PAs) form the basis of modern conservation frameworks and are at the heart of conserving biodiversity [1,2]. Despite global efforts under the Aichi Targets, biodiversity loss continues, with wildlife populations declining by an average of over 50% [3]. In December 2022, the Conference of the Parties to the Convention on Biological Diversity (COP15) adopted the Kunming-Montreal Global Biodiversity Framework, which includes four global goals for 2050 and 23 targets aiming to achieve by 2030 [4–6]. This Framework calls for urgent action, including conserving areas vital for both biodiversity conservation and ecosystem services provision. Although PAs have been regarded as cornerstones for biodiversity conservation, mounting evidence shows that they are not immune to species loss, particularly in terms of vertebrate species [7]. Whilst evidence from around the world indicates that protected area (PA) networks are expanding, they often exclude ecologically important landscapes, limiting their ability to maintain intact natural ecosystems and/or achieve biodiversity conservation targets [8,9]. Regional frameworks, such as the Kigali Call to Action (2022), also emphasise the need to incorporate unprotected areas into conservation planning. These developments signal a shift towards more inclusive, ecosystem-level conservation approaches that could offer a better solution to improve the effectiveness of PAs in halting ongoing biodiversity loss [10–12]. A more inclusive conservation framework is, therefore, needed because current conservation strategies are unlikely to meet these global biodiversity commitments [13], underscoring the need for conservation approaches that extend beyond PAs, to effectively safeguard biodiversity right across dynamic social-ecological systems [14].
In Africa, conservation has evolved as a result of the intersection of ecological, cultural, institutional and economic factors [15,16]. Precolonial societies used customary laws to manage resources [17]. The colonial era imposed ‘preservationist’ model often disregarding indigenous knowledge [18,19]. Post-independence, maintained expansion of national parks often impacted local communities but by late 1990s, community-based natural resource management had emerged [20]. More recently CBD-inspired frameworks have promoted holistic approaches integrating social-ecological values and climate change adaptation measures [21–23].
Biodiversity conservation is recognised for both its intrinsic values, and the vital ecosystem services it offers to humanity [24,25]. Yet, challenges remain in implementing and sustaining effective conservation efforts, largely due to challenges in moving conservation beyond mere ‘protection’ into long-term rehabilitation and enhancement of ecosystems that can function and bring benefits beyond the limitations posed by PA boundaries. Biodiversity exists beyond formal boundaries and, as defined by CBD (1992), recognising and conserving ecosystem functions across spatial levels from species to landscapes, is critical for sustainability. In addition to these spatial challenges, existing conservation frameworks are often faced with incomplete data in terms of estimates of biodiversity features including species distributions at the ecosystem level. These challenges have received little academic attention to date, and it is imperative to address them by adopting the ecosystem level as the defined unit of analysis. What is needed is a holistic approach that acknowledges the interconnectedness of ecosystems and addresses biodiversity threats that exist within and beyond PA boundaries.
Ecosystem-based conservation has received considerable attention primarily through the Ecosystem-based Approach (EBA), established by the Convention on Biological Diversity [26,27]. The EBA is based on a framework that integrates the management of land, water, and living resources, recognising ecosystems as “dynamic complexes of plant, animal, and microorganism communities and their non-living environment interacting as a functional unit” [27]. However, EBA has rarely been operationalised for biodiversity assessment and planning. In this study, we propose an Ecosystem-Based Conservation (EBC) framework as a step forward on EBA, serving as an operational conservation strategy to increase conservation efforts beyond PAs. The EBC framework treats the ecosystems as social-ecological units, where native biota and human communities have co-evolved over time. These interactions have generated Traditional Ecological Knowledge (TEK), supporting coexistence and generating nature’s contributions to people through ecosystem service bundles [28]. In Tanzania, eight major terrestrial ecosystems exist, each with distinct biota and communities with unique TEK. These ecosystems and associated communities provide different opportunities for sustaining biodiversity conservation and provision of ecosystem services [29–31]. Unlike the PA approach, which confines conservation within boundaries, the EBC framework promotes biodiversity conservation as well as incentives for stewardship beyond the boundaries of PAs. The framework, therefore, offers a more inclusive biodiversity conservation strategy outside protected areas and a complementary strategy for effective biodiversity conservation at ecosystem level. Understanding biodiversity features that are unique to a specific ecosystem and how people and biodiversity overlap and interact outside protected area networks is crucial for establishing realistic, sustainable targets for guiding biodiversity conservation and ecosystem service delivery beyond protected areas. However, how unprotected areas of ecosystems and communities can sustain or enhance ecosystem services through improved conservation requires novel frameworks such as EBC that can guide biodiversity conservation and sustainable management at the ecosystem level; thus, optimising conservation efforts and benefits beyond protected areas.
Assessing biodiversity distribution across multiple ecosystems is crucial for informing ecosystem-based conservation strategies. Measuring and assessing aspects of biodiversity, even for well-studied taxa like birds and large mammals, however, remains challenging [32,33]; hence, biodiversity proxies are often used. In conservation science, biodiversity features such as species richness, indicator species, species-area curve, and biomass are commonly used proxies. Ecosystem services and bio-indicator species also help in the evaluation of ecosystem integrity [34,35]. In this study, biodiversity features refer to a group taxon level (i.e., key taxonomic groups, including vertebrates, plants, and invertebrates), that represent biological diversity within ecosystems. In many countries, including Tanzania, biodiversity data remain sparse and uneven, particularly outside protected areas and for less-studied taxa [36,37]. Literature-based data compilation is, therefore, a pragmatic method to estimate ecosystem-level biodiversity distribution [38]. We used the sum of reported biodiversity features in each of the three taxonomic groups as a proxy to estimate how biodiversity is distributed across different terrestrial ecosystems in Tanzania. While such data are shaped by sampling and publication biases, they still provide critical insights into underrepresented taxa and overlooked ecosystems. This approach aligns with recent Kunming-Montreal Global Biodiversity Framework targets [6,39] of supporting inclusive spatial management (Target 1); restoring degraded ecosystems (Target 2); increasing green and blue spaces in urban areas (Target 12), as well as evidence-based conservation planning.
Tanzania is a biodiversity-rich country that has expanded its PAs network, covering marine, terrestrial, and inland water areas, surpassing Global Biodiversity Framework Target 3 by protecting over 40% of its total area [40]. Despite these efforts, Tanzania, widely regarded as a key country for conservation in mainland Africa, is experiencing a rapid decline in biodiversity [41–43]. This loss is undermining ecosystem resilience and diminishing nature’s capacity to support human well-being [44–46]. Consequently, this study has focused on Tanzania to assess and delineate (i) terrestrial ecosystems found in Tanzania, (ii) PAs and their proportions across different ecosystems; and (iii) distribution estimates of biodiversity features in each ecosystem, as a proxy for species richness. The resulting data provide a foundation for developing and promoting a new and effective EBC framework, as a complementary strategy to enhance biodiversity conservation beyond PA boundaries.
Methods
Study area
This study was conducted in eight major terrestrial ecosystems (Fig 1) on the mainland of Tanzania. Tanzania has an exceptionally high diversity of terrestrial ecoregions and biomes within the Afrotropical realm, making it one of the most ecologically diverse countries in Africa [47]. Tanzania is located between 29⁰E and 41⁰E and 1⁰S and 12⁰S, covering 945,100 km² and is endowed with a rich variety of landscapes from coastal plains, upland areas and mountains including Mount Kilimanjaro, Africa’s highest peak, at 5,895 meters above sea level. The country has various bioclimatic and topographic zones, ranging from dry regions with precipitation levels below 400 mm to humid regions with precipitation levels exceeding 2000 mm annually [48]. Across these zones, temperatures vary broadly, typically ranging from 5.3⁰C to 33.1⁰C [49]. The country’s climate is tropical and divided into four main climatic zones: hot humid coastal plain, semi-arid central plateau, high rainfall lake regions, and the temperate highlands [50].
Major terrestrial ecosystems in Tanzania.
Classification of ecosystems
A map of terrestrial ecosystems in Tanzania was created using the shapefiles of Terrestrial Ecoregions of the World [47], that are available under a CC BY 4.0 licence. These shapefiles were clipped to Tanzania’s national boundaries and reclassified into ecosystem types following the UNEP [51] classes. All spatial operations, including clipping, reclassification, and visualisation, were conducted in QGIS version 3.38.0. The resulting map depicts eight types; grasslands, miombo woodland, acacia savanna, coastal forest, mangrove, moorland, montane forest, and flooded savanna (Fig 1).
Delineating PAs and their proportions in different ecosystems
PAs are clearly defined geographical spaces, recognised, dedicated, and managed, through legal or other effective means, to achieve the long-term conservation of nature and associated ecosystem services and cultural values as defined by the IUCN [52]. For our study, we used three categories of land use within ecosystems: 1) Priority protected areas (PPAs) which included National parks, Ngorongoro conservation area, Nature reserves, Game reserves, and Forest reserves; 2) other protected areas (OPAs) which included Wildlife Management Areas, Game Controlled Areas and Game Open Areas; and 3) unprotected areas (UAs) which included included settlements, farmlands and pastures. PPAs differ from OPAs based on the level of human intervention allowed. In PPAs, human activities are either prohibited (e.g., nature reserves, national parks) or very limited (e.g., only sport hunting in game reserves). OPAs, on the other hand, allow human activities such as settlements, cultivation, and livestock keeping, while focusing on the sustainable use of natural resources. We analysed PA coverage across different ecosystem types using a spatial dataset from the Tanzania Wildlife Research Institute (TAWIRI). We used the QGIS intersect tool to determine the area of each ecosystem type within each category (Fig 3). We also determined the number of PAs within each ecosystem type, and for any PA that extended beyond one ecosystem type, its count was assigned to the ecosystem where the largest portion of its area was located.
Flow diagram of literature search and review method.
Establishing distribution estimates of biodiversity features
As a consequence of a general lack of biodiversity information at ecosystem level, we derived a pragmatic approach for obtaining distribution estimates of three biodiversity features across different ecosystems, to assess progress towards achieving the Kunming-Montreal Global Biodiversity Framework goals. We assessed biodiversity distribution by conducting a literature search of biodiversity occurrence within Tanzania’s major terrestrial ecosystems, focused on three biodiversity features (vertebrates, invertebrates, and plants), which are the most studied in terrestrial ecosystems [34]. Ecosystem boundaries guided this as our primary unit of analysis.
We conducted a comprehensive literature search in Scopus and Google Scholar databases from May 2023 to August 2023. These databases were chosen for their ease of access and extensive coverage. In both databases, results were restricted to peer-reviewed articles, sorted by relevance, and without time limitation. We utilised tailored search strings that were designed to be ecosystem- and taxon-specific, combining habitat descriptors with biodiversity and taxonomic keywords using Boolean operators (AND, OR). The complete set of search strings is included in the supplementary materials (S1 Table). Each search string was applied in each database separately for vertebrates, invertebrates, and plants within a given ecosystem, and the number of articles retrieved was recorded per database, per ecosystem and per taxon. In Google Scholar, we screened abstracts of up to 1,000 articles per search string, due to Google Scholar platform constraints, whereas in Scopus, all retrieved articles were screened. The search date and the number of articles retrieved were documented for each ecosystem-taxon combination.
The first-level screening assessed titles and abstracts when necessary to determine whether each study was biodiversity-related and conducted in Tanzania. In Scopus, the geographic filter automatically excluded non-Tanzanian studies, while biodiversity relevance was assessed manually. In Google Scholar, both biodiversity relevance and geographic scope were determined manually from titles and abstracts. Studies were excluded at this stage only if they were clearly irrelevant to biodiversity or explicitly indicated a study area outside Tanzania. For each database, the number of studies identified as relevant after screening was recorded by taxon and ecosystem. All Studies retained after the first-level screening were merged across databases by taxon and ecosystem, and duplicates were eliminated so that each study was only counted once in the aggregation (Fig 2).
At the second-level screening, we reviewed the title, abstract, methods, and results sections, while the introduction and discussion sections were not considered. Each study was initially assigned to a terrestrial ecosystem based on the search string under which it was retrieved. If the reported study area did not match the ecosystem implied by the search string, the study was reassigned. Final assignments were verified using the study’s area description (e.g., habitat, geographic location, coordinates, or maps) provided in the methods or results sections. Full eligibility criteria were then applied; studies were included if they reported field-based primary data, presented in absolute numbers on biodiversity distribution or species richness within Tanzania’s terrestrial ecosystems. Studies were excluded if they were conducted outside Tanzania, focused on aquatic systems or crops, relied solely on molecular/genetic approaches or modelling without field data, or presented non-primary literature such as reviews (Fig 2).
From the final pool of eligible studies, biodiversity data were extracted in a standardised manner. When article reported aggregated counts of species (e.g., insects, snails, birds, reptiles, amphibians, trees, bryophytes), these were summed within the appropriate biodiversity feature category: vertebrates, invertebrates, or plants. When species-level inventories were provided, species were counted individually, and the total count was assigned to their respective taxonomic group. Therefore, the number of biodiversity features reported in this study represents the aggregate totals of species within the three key taxonomic groups (plants, vertebrates, and invertebrates) as presented in each reviewed article, rather than unique species inventories. The number of articles contributing data for each taxon is summarised in Supplementary Materials (S1 Table).
For each study, we documented the total counts of biodiversity features reported within each taxon and ecosystem. These counts, whether presented as individual species or aggregated groups (e.g., number of bird species), were summed across all included studies to obtain totals per taxonomic group and ecosystem. The specific counts extracted from each article are provided in the supplementary materials (S2 Data). The combined sum of reported biodiversity features from all three taxonomic groups within each ecosystem was expressed as a number per 100 km^2^ [53]. In addition, the summed totals for each taxonomic group within each ecosystem were converted into percentages to enable comparisons across taxa and ecosystems.
While biodiversity is inherently complex and difficult to quantify precisely, our approach provides a practical framework for ecosystem-level assessment. We adopted the CBD (1992) definition of biodiversity, which encompasses diversity within species, between species and of ecosystems, allowing us to capture representative information necessary for developing and improving conservation strategies at ecosystem-scale. The articles that were reviewed were used to estimate the presence or absence of key biodiversity features within each ecosystem. Although the exact locations of individual species were not specified in the studies, the species were assumed to occur across various habitat areas within the respective ecosystem. Whilst this approach does not provide exact estimates of species richness, it serves as a pragmatic proxy for assessing biodiversity distribution at ecosystem-level.
Results
Protected and unprotected areas in different ecosystems
The scale of Tanzania’s terrestrial ecosystems are summarised along with the proportions of protected and unprotected areas within them (Table 1; Figs 1 and 3). Miombo woodland was the largest, covering 484,942 km² (55%), while moorland being the smallest, covering 1,426 km² (0.2%) (Fig 1). The total amount of protected land varied, with protected areas (PPAs and OPAs) covering 41% (358,528 km²) of the land, with the remaining 59% (523,361 km²) being unprotected (outside formal designations). In grassland ecosystem, 89.2% of the land area was protected, whilst for mangrove ecosystem only 8% were under protection. For montane forest ecosystem less than a third of the total area was protected. Over half of the area in most ecosystems lacked protection with coastal, and montane forests particularly vulnerable with 77% and 70% of their total areas respectively unprotected (Table 1). Fig 3 shows the proportions of these ecosystems that were protected under PPA and OPA categories.
Table 1: Terrestrial ecosystems in Tanzania, their scale and levels of protection.
Extent of PA coverage across different terrestrial ecosystems in Tanzania.
PPAs covered 29% (254,632 km²) of the total terrestrial land area within Tanzania whilst OPAs covered an additional 12% (103,897 km²). PPAs covered 80% of the moorland and 54% of grassland ecosystems, respectively. In mangrove ecosystem, PPAs covered only 8% of its total area. In contrast, 32% of miombo woodland ecosystem were under PPAs designations, with an additional 12% under OPAs designations (Table 1). The total number of PPAs was 640, while the number of OPAs was 37. Miombo woodland and montane forest ecosystems were covered by the most PPAs with 232 and 194 respectively, whilst moorland was only covered by one PPA (Table 1). In terms of OPAs, miombo woodland had the highest number [19], with mangrove ecosystem completely lacking any designated OPAs (Table 1).
Distribution and abundance estimate of biodiversity features
The literature search yielded a total of 3,464 published articles, after removal of duplicates, that were initially considered relevant to the study objective. Of these, 1,576 related to plant species; 1,147 related to vertebrates; and 741 related to invertebrates (Fig 2). Following application of inclusion and exclusion criteria, a total of 228 articles were selected for data extraction, including 102 articles for vertebrates, 82 for plants, and 44 for invertebrates (Fig 2). From these articles, 22,987 biodiversity feature estimates were included from eight terrestrial ecosystems in Tanzania. Of the 22,987 biodiversity features, plants comprised 12,595 counts; vertebrates accounted for 5,963 counts; and invertebrates accounted for 4,429 counts (see S2 Data). These figures are the sum total of biodiversity features reported in each ecosystem category and not unique species.
Across ecosystem categories, the montane forest stood out with the highest number of reported biodiversity features at 18 per 100 km², followed by coastal forest and grassland ecosystems, which both had eight features per 100 km². In contrast, acacia savanna, flooded savanna, and miombo woodland ecosystems each had just one biodiversity feature per 100 km² (Table 2).
Table 2: Biodiversity features and their estimates per 100 km2 as drawn from the literature.
Reported biodiversity features varied considerably between ecosystems and taxonomic groups. Based on the reviewed literature, montane forest ecosystem had the highest biodiversity features totals across all three taxa, with 7,053 plant records (56.0%); 1,600 invertebrate records (36.1%); and 1,874 vertebrate records (31.4%). Coastal forest ecosystem ranked second, with 3,235 plant records (25.7%); 2,176 vertebrate records (36.5%); and 189 invertebrate records (4.3%). In contrast, moorland ecosystem had the lowest number with only 24 vertebrate records (0.4%) and 5 plant records (0.04%) (Table 2; Fig 4).
Proportions of biodiversity features estimated in various Tanzanian ecosystems, based on the literature search.
Discussion
Unprotected areas within terrestrial ecosystems tend to receive less scientific attention [54,55] and are often overlooked in conservation frameworks. As a result, they can often face increasing threats from human activities. This study used literature-based species occurrence data to provide a broad assessment of biodiversity distribution across Tanzania’s terrestrial ecosystems. Given that conserving global biodiversity is a critical challenge, particularly in the face of a changing climate and increasing anthropogenic pressures, the lack of protection for fragile ecosystems is worrying [56–58]. Understanding the distribution of biodiversity features and the extent to which they are conserved in different ecosystems is vital for evidence-based, effective conservation planning. In regions where field-based inventories are limited or unavailable, such literature-derived estimates can serve as a practical proxy for assessing biodiversity distribution at the ecosystem scale and informing conservation planning. The results generated in this study contain information that is essential for effective conservation planning and for developing a robust, ecosystem-based conservation approach that can support efforts to halt biodiversity loss. The sum of biodiversity features estimated here can be extrapolated to highlight species abundance at ecosystem level, given that the method is based on abundance and diversity studies in similar ecosystems (e.g., tropical forests hosting over 60% of global terrestrial vertebrates and comprising a substantial portion of global biodiversity) [59]. The majority of the biodiversity taxa in Tanzania, in non-protected areas of these species-rich, diverse ecosystems, have received little conservation attention. This suggests many species are inadequately protected, given that the proportion of unprotected areas within these ecosystems ranges from 11% in the most protected to 92% in the least protected. These results should be useful not only to national and international decision-makers, but to everyone with a stake in Tanzania’s diverse ecosystems [60]. In order to address the current gaps in awareness, conservation protection and formal designation, it is crucial to adopt the EBC framework that encompasses whole ecosystems, thus broadening the current but fragmented protected area approach to biodiversity conservation. This EBC framework is particularly timely as conservation efforts intensify in response to biodiversity loss, alongside recognition of the need for conservation actions to incorporate multiple knowledge types and stakeholder groups, to achieve balanced environmental as well as socio-economic and cultural outcomes.
Level of protection versus biodiversity conservation
In common with Brazil and Venezuela, Tanzania has successfully designated more than 39% of its terrestrial land [61,62] as PAs [40], exceeding conservation targets [63]. This includes PAs, such as National Parks, Conservation Areas, Nature Reserves, Forest Reserves, Forest Nature Reserves, Game Reserves, Marine Parks and Reserves, Game-Controlled Areas, Open Game Areas, and Wildlife Management Areas [40,63]. Despite the proportion of designated PAs in Tanzania exceeding the Global Biodiversity Framework Target 3 [6], our findings show that more than 50% of the majority of terrestrial ecosystems in Tanzania lack formal protection. Most conservation efforts currently tend to focus on the protection of biodiversity found within PAs, even though significant biodiversity is known to occur beyond these areas [64]. For example, 56% of Wildebeest movements occurred outside of the protection of Tarangire, Manyara, and Lake Natron National Parks [65]; and 10–20% of Tanzania tree species are found outside PAs [66]. Whilst the PA-oriented conservation approach is long recognized as a cornerstone in safeguarding biodiversity [67], its effectiveness in halting ongoing biodiversity loss is limited [7]. Amongst the reasons for this is a prevalent misconception surrounding conservation frameworks, where the term “conservation” is often erroneously equated with “protection”. This misinterpretation implies that conservation efforts should mostly focused on PAs. To address this gap, an ecosystem-based conservation framework is urgently needed to ensure biodiversity conservation is properly integrated into broader social-ecological landscapes management, processes that extend well beyond PAs [68,69].
Distribution and abundance estimates of biodiversity features and levels of protection
Our results show indicative estimates of the distribution of biodiversity features in Tanzanian ecosystems. Montane forest ecosystem had the highest sum total of reported biodiversity features, reflecting its important role as a biodiversity hotspot and a refuge for many endemic species, particularly closed-forest specialists [70]. In contrast, other ecosystems including miombo woodland and savannas, had a lower sum total of biodiversity features, suggesting spatial heterogeneity in biodiversity distribution.
Tanzania has 677 PAs, with over 90% classified as PPAs. However, the distribution of PAs is uneven, and a high number of PAs does not necessarily align with areas of high biodiversity richness, or the presence of key endemics. Many ecosystems with important biodiversity features remain underrepresented within the PA network. For instance, montane forests harbour endemic species that are increasingly threatened by forest loss and fragmentation, reducing habitat quality and connectivity, and posing further challenges for their long-term survival, yet 70% of this ecosystem remains outside of formal protection designations in Tanzania.
These patterns highlight the limitations of relying solely on PA coverage for effective biodiversity conservation. The EBC framework, by contrast, can complement the PA network by addressing gaps in conservation, promoting landscape-scale connectivity, and facilitating participatory restoration and conservation efforts. Adopting EBC strategies in underrepresented ecosystems provides important opportunities to enhance the resilience and sustainability of biodiversity conservation efforts across terrestrial ecosystems.
Implications of PA approach on conservation and management of biodiversity
Despite surpassing the global target for PAs as set by the CBD (2010), Tanzania ranks 11^th^ globally and 2^nd^ in Africa (behind Madagascar) for the highest number of threatened species on the IUCN Red List (2023). This includes nearly 200 native vertebrate species, 137 invertebrate species, and 1,031 plant species, which are classified as threatened, vulnerable, endangered, or critically endangered (IUCN, 2023). These figures highlight that broad PA coverage alone is not enough to prevent high levels of biodiversity loss. Consistent with this, our findings have shown that a significant proportion of most Tanzanian ecosystems remained unprotected, indicating that key biodiversity areas are potentially at risk. Furthermore, invertebrate taxa were reported in fewer studies compared with other taxonomic groups (see S2Data). This aligns with broader evidence that biodiversity monitoring and conservation planning often show taxonomic bias, with PAs disproportionately focused on certain taxa, while neglecting others [71]. For instance, Casanelles‐Abella, Fontana [72] reported a spatial mismatch between invertebrate hotspots and PAs, while Wu, Yu [73] showed that the existing network of PAs in southwest China has less than a quarter of overlap with conservation hotspots, and only a fraction of these hotspots receive adequate protection. Taken together, these results emphasize that PAs as a conservation approach often fail to address crucial ecological processes such as individual home ranges and propagule dispersal [74], suggesting that relying solely on PAs is inadequate for fully understanding biodiversity distribution and abundance patterns across taxa and ecosystems.
Similar limitations have been documented across East Africa, where PAs cover just 10% of the geographic range of endemic/near-endemic vertebrate species, and only 26% of endemic species have at least half of their range protected [75]. Such limited spatial coverage undermines the effectiveness of PAs in conserving biodiversity and exacerbates risks from habitat loss and fragmentation, particularly for wide-ranging and long-distance dispersal species [76] under accelerating climate change [77]. Williams, Rondinini [78] have further demonstrated that many mammal species remain without effective population-level protection, especially in tropical biodiversity hotspots where PA coverage is minimal.
The concentration of conservation efforts only within PAs also compromises habitat connectivity. In Tanzania, about half of PAs remain connected, while many forest reserves exist as isolated fragments [63,79,80]. Wildlife corridors that are essential for maintaining ecological connectivity between PAs have declined in both number and functional integrity due to increasing land-use change and human encroachment [81]. For instance, in the Tarangire-Manyara ecosystems [65], and in the Kilombero valley [79], key corridors have experienced severe degradation. Kitendeni wildlife corridor in northern Tanzania, once 10 km wide [82], has narrowed to 6 km [83]. Such losses mirror a global trend where migratory routes are increasingly overlooked in conservation planning, leading to widespread disruption of animal movements [84,85]. Collectively, these patterns underscore the urgent need for conservation approaches that extend beyond PA boundaries and reinstate ecosystem-scale connectivity to enhance biodiversity resilience and the long-term sustainability of conservation efforts.
The need for an Ecosystem-Based Conservation framework
While the international commitment to protect 30% of the world’s surface by 2030 is necessary, achieving meaningful biodiversity conservation requires inclusive and elevated conservation approaches that extend beyond PAs. Despite wide agreement that PPAs (IUCN category I-III) are the best approach for conserving biodiversity, they are limited in extent and exclude many species of key conservation importance [86]. In Africa, extending conservation practices beyond PAs remains underutilised, despite its potential to safeguard diverse taxa [87]. Our results indicate that a large proportion of Tanzania’s ecosystems remain unprotected, reinforcing the need for ecosystem-scale approaches that can complement formal PAs.
Rapid human population growth in Africa is projected to increase fivefold by the year 2100 [88,89], exacerbating pressures on ecosystems. OPAs (IUCN category IV-VI), which comprise over 60% of the global protected-area network, are often undervalued for biodiversity conservation in Africa due to their limited populations of large charismatic mammals [86]. Similarly, unprotected areas of ecosystems remained overlooked, as conservation frameworks and funding continue to prioritise PAs, assuming that they are the most cost-effective and logistically feasible option (Cuthbert et al., 2022; Gallardo et al., 2022). Yet evidence shows that substantial biodiversity exists outside PA boundaries, and in some cases even exceeds that within [90]. This highlights the need of complementary conservation approaches at ecosystem scale.
The EBC framework can address these gaps by treating ecosystems as social-ecological units, where native biota and human communities have co-evolved over time, generating traditional ecological knowledge that underpins both coexistence and resource use. By linking biodiversity features with ecosystem service bundles, the EBC framework provides a mechanism to incentivise communities to engage in conservation beyond PAs. For instance, in Tanzania’s montane forest ecosystem, bundles of services such as water provision, carbon storage, and ecotourism have been demonstrated [29–31], while in savanna rangelands, fodder and grazing resources play a critical role [91]. The generation of these ecosystem service bundles shows how sustaining native biota in these ecosystems generates multiple benefits that can continuously support human well-being and biodiversity simultaneously. Importantly, the EBC framework remains highly relevant for Tanzania, where PA coverage already exceeds global recommendations but biodiversity loss continues. This paradox reflects the fact that biodiversity does not follow administrative or PA boundaries.
By building on TEK and the incentives provided by ecosystem service bundles, EBC can mobilise local stewardship, promote sustainable use, and help reverse biodiversity loss, particularly in unprotected areas of these ecosystems. In Tanzania, different ecosystems are inhabited by diverse ethnic communities that interact with biodiversity features, particularly plant taxa, which are unique to their respective ecosystems and provide multiple values and ecosystem services. Among biodiversity features of these terrestrial ecosystems, some plant species occur in multiple locations and are known by different vernacular names and primary uses [92]. Of the various known plant species in these ecosystems, most are used for food, while others serve medicinal, material, or ritual purposes. The EBC framework can serve as an operational and inclusive strategy to incentivise communities to actively conserve plant species that sustain their livelihoods and support their well-being in these ecosystems in Tanzania and beyond.
By encompassing both formal PAs and their contiguous surroundings, the EBC framework aligns with IUCN connectivity conservation guidelines [69] and safeguards biodiversity, cultural values, and traditional resource management systems, particularly those practiced by indigenous and local communities. This way, EBC provides not only a framework to expand conservation beyond PAs but also a pathway for equitable cost-benefit sharing between communities and ecosystems. Implementing this framework requires context-specific prioritisation, ecosystem-level biodiversity monitoring, and engagement with communities who hold the knowledge and incentives to sustain biodiversity over the long term. Positioned alongside PAs, the EBC framework can enhance the resilience of ecosystems, maintain nature’s contributions to people, and ensure that conservation efforts respond to both ecological and social realities.
Although advances in connectivity science, biodiversity data availability, and computational modelling now enable more sophisticated assessments of functional diversity [93–97], keeping track of these advances is challenging for practitioners and stakeholders. Our study relies on literature-based biodiversity features as proxies for species distribution estimates. Accordingly, our analysis focuses on the presence or absence of key biodiversity features rather than unique species, since not all studies reported individual species. To allow comparisons across ecosystems, combined totals were standardised per 100 km²; however, these values should be interpreted as indicative of biodiversity representation rather than absolute measures. While this approach is constrained by uneven research effort, publication bias, and unequal ecosystem and taxon representation, it provides a reasonable estimate of the distribution of the three key biodiversity features across ecosystems [96,97]. Whilst PAs remain crucial for biodiversity conservation, our study has demonstrated that effective biodiversity conservation requires a broader ecosystem-level framework engaging all stakeholders. Implementing the EBC framework alongside PAs can help to better address biodiversity loss, particularly outside PAs, and enhance the long-term resilience of both ecosystems and human communities. Conservation or restoration of multiple patches of ecosystems is critical, particularly in fragmented habitats, and future studies should prioritise ecosystem-level biodiversity inventories comparing PAs and areas outside of PAs, to better understand variations in species abundance and diversity.
Supporting information
S1 TableSummary of literature search results for taxa-specific biodiversity studies across eight terrestrial ecosystems in Tanzania.This table presents search terms, databases (Google Scholar and Scopus), total articles retrieved, relevant articles identified, and those included for data extraction for vertebrates, invertebrates, and plants across each ecosystem type.(PDF)
S2 DataCompiled dataset of biodiversity records extracted from published studies across Tanzania’s eight terrestrial ecosystems.The dataset summarises the sum of taxonomic group (vertebrates, invertebrates, plants) species counts, and their corresponding references.(PDF)
The reference list from the paper itself. Each links out to its DOI / PubMed record.
- 1Pecl GT, Araújo MB, Bell JD, Blanchard J, Bonebrake TC, Chen I-C, et al. Biodiversity redistribution under climate change: Impacts on ecosystems and human well-being. Science. 2017;355(6332):eaai 9214. doi: 10.1126/science.aai 9214 28360268 · doi ↗ · pubmed ↗
- 2Dinerstein E, Vynne C, Sala E, Joshi AR, Fernando S, Lovejoy TE, et al. A Global Deal For Nature: Guiding principles, milestones, and targets. Sci Adv. 2019;5(4):eaaw 2869. doi: 10.1126/sciadv.aaw 2869 31016243 PMC 6474764 · doi ↗ · pubmed ↗
- 3Westveer J, Freeman R, Mc Rae L, Marconi V, Almond R, Grooten M. A deep dive into the living planet index: A technical report. Gland, Switzerland: WWF. 2022.
- 4Carroll C, Hoban S, Ray JC. Lessons from COP 15 on effective scientific engagement in biodiversity policy processes. Conserv Biol. 2024;38(2):e 14192. doi: 10.1111/cobi.14192 37768193 · doi ↗ · pubmed ↗
- 5Environment CC, Secretariat D. Post-2020 global biodiversity conservation. Green recovery with resilience and high quality development. Springer. 2023.
- 6Global Biodiversity Framework. Kunming-Montreal Global Biodiversity Framework. 2022.
- 7Craigie ID, Baillie JEM, Balmford A, Carbone C, Collen B, Green RE, et al. Large mammal population declines in Africa’s protected areas. Biological Conservation. 2010;143(9):2221–8. doi: 10.1016/j.biocon.2010.06.007 · doi ↗
- 8Rodríguez-Rodríguez D, Martínez-Vega J. Effectiveness of Protected Areas in Conserving Biodiversity: A Worldwide Review. Cham, Switzerland: Springer. 2022.