Stool-Based Proteomic Signature for the Noninvasive Classification of Crohn's Disease and Ulcerative Colitis Using Machine Learning
Elmira Shajari, David Gagné, Francis Bourassa, Mandy Malick, Patricia Roy, Jean-François Noël, Hugo Gagnon, Maxime Delisle, François-Michel Boisvert, Marie Brunet, Jean-François Beaulieu

TL;DR
This study uses stool proteins and machine learning to noninvasively distinguish Crohn's disease from ulcerative colitis with high accuracy.
Contribution
A novel noninvasive proteomic signature and machine learning model for classifying Crohn's disease and ulcerative colitis.
Findings
A predictive model achieved an area under the curve of 0.96 on both training and test datasets.
Sixteen stool proteins were identified as significant biomarkers for distinguishing Crohn's disease from ulcerative colitis.
The Naive Bayes model outperformed other machine learning algorithms in classification accuracy.
Abstract
Crohn's disease (CD) and ulcerative colitis (UC) have overlapping symptoms, but they differ in pathology and treatment. Currently, distinguishing between these diseases involves invasive procedures such as colonoscopy and histopathology. Fecal proteins, stable and in direct contact with inflammation, offer a noninvasive alternative. This study focuses on using high-throughput data-independent acquisition mass spectrometry and machine learning to develop an accurate biomarker signature from complex stool samples. Stool samples obtained from 69 active patients were analyzed. Analysis of the stool proteome led to the identification and quantification of approximately 1,250 proteins. The samples were divided into training and testing groups. After data processing, various feature selection algorithms were applied on the training group to determine proteins that were significantly different…
Genes, proteins, chemicals, diseases, species, mutations and cell lines named across the full text — each resolved to its canonical identifier and authoritative record.
Click any figure to enlarge with its caption.
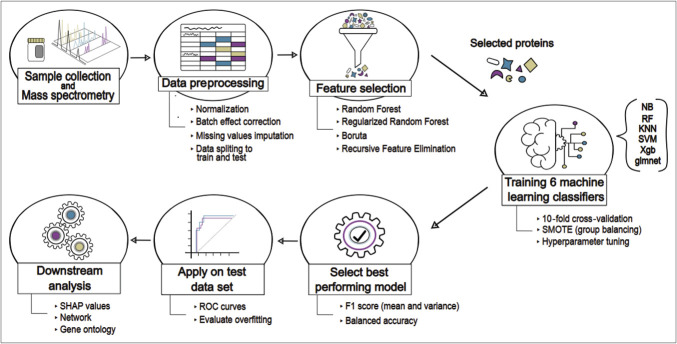 Figure 1
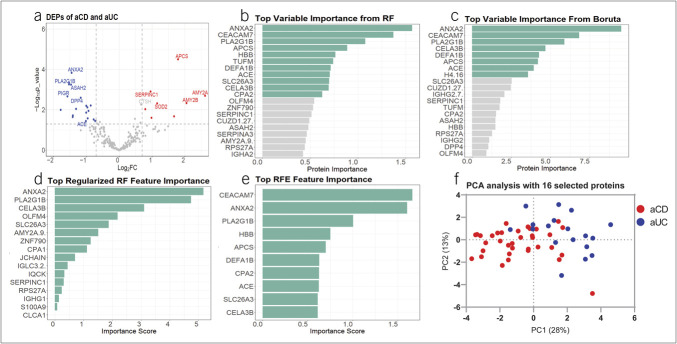 Figure 2
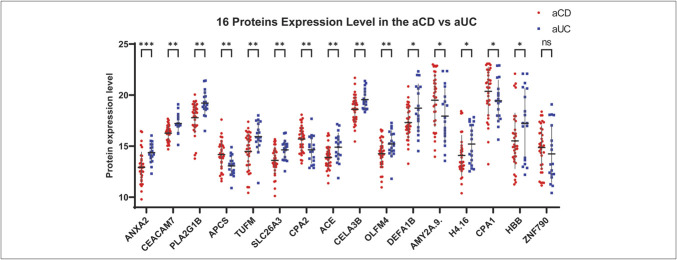 Figure 3
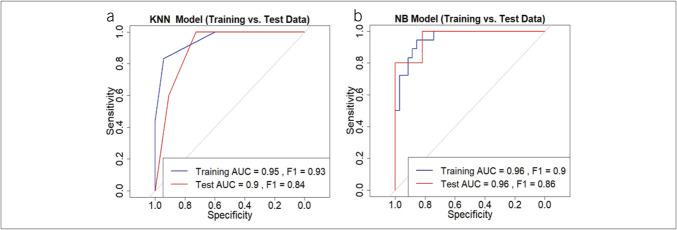 Figure 4
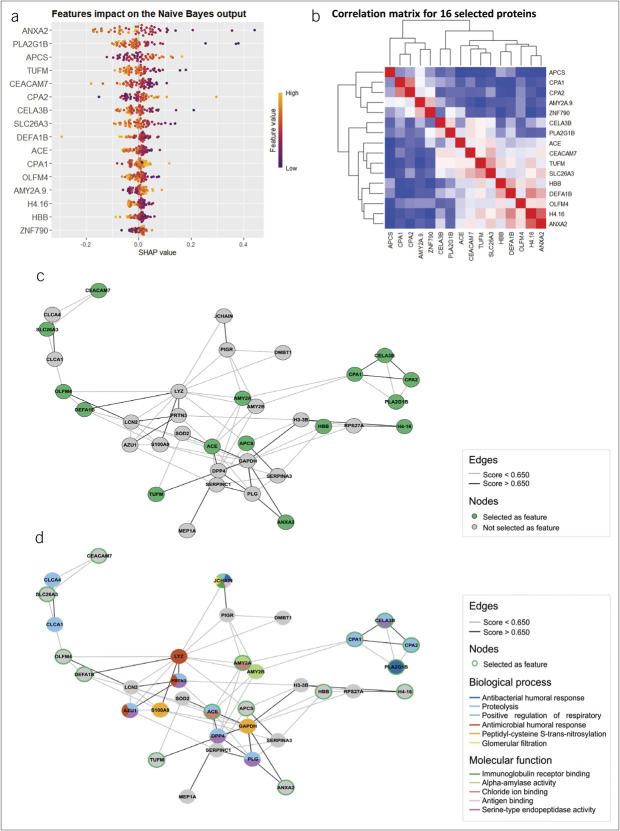 Figure 5
| Name | ID | Biological process | Molecular function | |
| ACE | Angiotensin-converting enzyme | Hormone metabolic process | Heterocyclic compound binding | |
| AMY1A | Alpha-amylase 1A | Carbohydrate metabolic process | Chloride ion binding | |
| AMY2A | Pancreatic alpha-amylase | Carbohydrate catabolic process | Chloride ion binding | |
| AMY2B | Alpha-amylase 2B | Carbohydrate metabolic process | Metal ion binding | |
| ANXA2 | Annexin A2 | Response to activity | Protein binding | |
| APCS | Serum amyloid P-component | Protein folding | Protein binding | |
| ASAH2 | Neutral ceramidase | Ceramide metabolic process | N-acylsphingosine amidohydrolase activity | |
| AZU1 | Azurocidin | Intracellular signal transduction | Protein binding | |
| CEACAM7 | Carcinoembryonic antigen-related cell adhesion molecule 7 | Signal transduction | Protein tyrosine kinase binding | |
| CELA3B | Chymotrypsin-like elastase family member 3B | Proteolysis | Peptidase activity | |
| CLCA1 | Calcium-activated chloride channel regulator 1 | Monoatomic ion transmembrane transport | Metalloendopeptidase activity | |
| CLCA4 | Calcium-activated chloride channel regulator 4 | Monoatomic ion transmembrane transport | Metalloendopeptidase activity | |
| CPA1 | Carboxypeptidase A1 | Response to cadmium ion | Protein binding | |
| CPA2 | Carboxypeptidase A2 | Proteolysis | Carboxypeptidase activity | |
| CUZD1 | CUB and zona pellucida-like domain-containing protein 1 | Cell division | ||
| DEFA1B | Neutrophil defensin 1 | |||
| DMBT1 | Deleted in malignant brain tumors 1 protein | Vesicle-mediated transport | Protein binding | |
| DPP4 | Dipeptidyl peptidase 4 | Cell adhesion | Protein binding | |
| FBXO3 | F-box only protein 3 | Response to lipopolysaccharide | Protein binding | |
| GAPDH | Glyceraldehyde-3-phosphate dehydrogenase | Microtubule cytoskeleton organization | Protein binding | |
| H3-3B | Histone H3.3 | |||
| H4-16 | Histone H4.16 | |||
| HBB | Hemoglobin subunit beta | Regulation of blood pressure | Peroxidase activity | |
| IGHA1 | Immunoglobulin heavy constant alpha 1 | Immune response | Antigen binding | |
| IGHA2 | Immunoglobulin heavy constant alpha 2 | Immune response | Antigen binding | |
| IGHG1 | Immunoglobulin heavy constant gamma 1 | Adaptive immune response | Protein binding | |
| IGHG2 | Immunoglobulin heavy constant gamma 2 | Adaptive immune response | Protein binding | |
| IGLC3 | Immunoglobulin lambda constant 3 | Adaptive immune response | Antigen binding | |
| IQCK | IQ domain-containing protein K | |||
| JCHAIN | Immunoglobulin J chain | Immune response | Protein-macromolecule adaptor activity | |
| LCN2 | Neutrophil gelatinase-associated lipocalin | Innate immune response | Protein binding | |
| LYZ | Lysozyme C | Killing of cells of another organism | Lysozyme activity | |
| MEP1A | Meprin A subunit alpha | Epidermal growth factor receptor ligand maturation | Protein binding | |
| OLFM4 | Olfactomedin-4 | Signal transduction | Structural molecule activity | |
| PIGR | Polymeric immunoglobulin receptor | Immunoglobulin transcytosis in epithelial cells mediated by polymeric immunoglobulin receptor | Polymeric immunoglobulin binding | |
| PLA2G1B | Phospholipase A2 | Signal transduction | Signaling receptor binding | |
| PLG | Plasminogen | Tissue remodeling | Protein binding | |
| PRTN3 | Myeloblastin | Collagen catabolic process | Protein binding | |
| PYHIN1 | Pyrin and HIN domain-containing protein 1 | Activation of innate immune response | Double-stranded DNA binding | |
| RNF170 | E3 ubiquitin-protein ligase RNF170 | Response to activity | Protein binding | |
| RPS27A | Ubiquitin-ribosomal protein eS31 fusion protein | Translation | Structural constituent of ribosome | |
| S100A9 | Protein S100-A9 | Modulation of process of another organism | Antioxidant activity | |
| SERPINA3 | Alpha-1-antichymotrypsin | Maintenance of gastrointestinal epithelium | Protein binding | |
| SERPINC1 | Antithrombin-III | Blood coagulation | Protein binding | |
| SLC26A3 | Chloride anion exchanger | Sperm capacitation | Protein binding | |
| SOD2 | Superoxide dismutase [Mn], mitochondrial | Response to activity | Superoxide dismutase activity | |
| TUFM | Elongation factor Tu, mitochondrial | Translational elongation | Protein binding | |
| ZNF790 | Zinc finger protein 790 | Regulation of transcription by RNA polymerase II | DNA-binding transcription factor activity, RNA polymerase II-specific |
| Training | |||||||
| Model | Sensitivity | Specificity | Mean F1 | Variance F1 | Mean balanced accuracy | Variance balanced accuracy | Tuning parameters |
| NB | 0.86 | 0.89 | 0.88 | 0.02 | 0.83 | 0.05 | fL = 0.25, usekernel = F, adjust = 0 |
| KNN | 0.94 | 0.83 | 0.87 | 0.01 | 0.82 | 0.05 | k = 3 |
| GLMNet | 0.86 | 0.83 | 0.86 | 0.01 | 0.79 | 0.06 | Lambda = 0.3, alpha = 0 |
| RF | 1 | 1 | 0.85 | 0.01 | 0.78 | 0.07 | mtry = 5 |
| XGBoost | 1 | 1 | 0.84 | 0.01 | 0.76 | 0.07 | max_depth = 3, gamma = 0.1 |
| SVM | 0.91 | 1 | 0.84 | 0.02 | 0.74 | 0.09 | degree = 1, scale = 0.1, C = 1 |
| GO term | GO name | DEP | Corrected | Corrected |
| GO:0019731 | Antibacterial humoral response | IGHA1, IGHA2, JCHAIN, IGHG2, IGHG1, | 1.34E-05 | 0.4401 |
| GO:0006508 | Proteolysis | FBXO3, PRTN3, CLCA4, PLG, | 2.47E-05 | 0.4705 |
| GO:0060267 | Positive regulation of respiratory burst | IGHA1, IGHA2, JCHAIN | 0.0012 | 0.331 |
| GO:0006958 | Complement activation, classical pathway | IGHG2, IGHA1, IGHA2, IGHG1 | 0.0042 | — |
| GO:0019730 | Antimicrobial humoral response | LYZ, PRTN3, AZU1 | 0.0047 | 0.6207 |
| GO:0035606 | Peptidyl-cysteine S-trans-nitrosylation | S100A9, GAPDH | 0.0089 | 0.8493 |
| GO:0050853 | B cell receptor signaling pathway | IGHG2, IGHA1, IGHA2, IGHG1 | 0.0104 | 0.8493 |
| GO:0003094 | Glomerular filtration | IGHA1, IGHA2, JCHAIN | 0.0151 | 0.4401 |
| GO:0034987 | Immunoglobulin receptor binding | IGHA1, IGHA2, JCHAIN, IGHG2, IGHG1 | 1.32E-06 | 0.02 |
| GO:0004556 | Alpha-amylase activity | AMY1A, AMY2A, AMY2B | 0.0002 | 0.052 |
| GO:0031404 | Chloride ion binding | AMY1A, AMY2A, | 0.0049 | 0.1345 |
| GO:0003823 | Antigen binding | IGHA1, IGHA2, JCHAIN, IGHG2, IGHG1 | 0.0076 | — |
| GO:0004252 | Serine-type endopeptidase activity | PRTN3, PLG, CELA3B, AZU1, DPP4 | 0.0302 | — |
- —Crohn's and Colitis Canada
Peer Reviews
No public reviews on file for this paper yet. If you reviewed it on a platform where reviews are public (OpenReview, ICLR, NeurIPS, ICML), you can paste yours below so the community can read it here.
Videos
No videos yet. Explain this paper in a talk, walkthrough, or lecture? Add one.
Taxonomy
TopicsMachine Learning in Bioinformatics · vaccines and immunoinformatics approaches
INTRODUCTION
Crohn's disease (CD) and ulcerative colitis (UC) are the 2 most common chronic inflammatory bowel diseases (IBDs). Accurately distinguishing between these conditions would allow physicians to tailor treatment plans, including the choice of medication and surgical intervention, anticipate potential complications, and offer a more accurate prognosis, leading to improved overall management of IBD (1). The differential diagnosis of CD and UC using noninvasive methods remains inconsistent, thus still relying on invasive endoscopy and histopathology (2). However, even with these methods, diagnosis can remain challenging for gastroenterologists.
Stool biomarkers provide a valuable, noninvasive method for investigating intestinal inflammation because they are in direct contact with the affected area (3,4). Numerous studies have explored protein biomarkers for diagnosing and differentiating CD and UC; however, each has its limitations. Many studies focused on only diagnosing 1 group, either CD or UC, from a control group (5). This approach may not be practical in real-world settings because distinguishing CD from controls without considering UC is not feasible. Moreover, a microbiome proteome study developed a model that performed well on the training data set but poorly in validation, achieving an area under precision recall curve of 0.47, indicating its limited accuracy in distinguishing CD from UC (6). Other studies have relied on mucosal proteomics, which involves biopsy procedures that remain invasive (7,8). In another study, although stool metaproteomic analyses identified differentially expressed proteins, they failed to distinguish CD from UC (9). These limitations highlight the need for more effective and noninvasive approaches to distinguishing between these 2 types of IBD (10).
Recent advances in proteomics platforms hold great promise for identifying and measuring multiple targets simultaneously. In particular, Sequential Window Acquisition of All Theoretical Mass Spectra (SWATH) mass spectrometry as data-independent acquisition (DIA) offers a high-throughput approach to stool proteomic profiling (11–13). In a previous study, we demonstrated the effectiveness of this method in differentiating active IBD from non-IBD patients, leveraging machine learning for enhanced diagnostic accuracy (14).
Building on these findings, this study investigates whether distinct stool proteomic signature can differentiate CD from UC. Using SWATH/DIA proteomic profiling combined with machine learning, we identified 16 proteins that significantly improve diagnostic precision. The model's robustness was validated with independent samples, demonstrating its strength and consistency. All samples were collected under clinically compatible standard operating procedures, ensuring clinical relevance.
METHODS
Stool sample collection
Stool samples were obtained from the Clinical Hematology Laboratory at CIUSSS de l'Estrie—CHUS through the fecal calprotectin testing program between January 2021 and August 2023. Patients collected samples at home and delivered them to the hospital within 24 hours (2 hours at room temperature, up to 24 hours refrigerated at 4°C). Approximately 50 mg was used for calprotectin testing by ELISA, while the remainder was stored at −80°C for this study, with patient consent.
Criteria for inclusion required patients to be adults with active disease, defined by evidence of endoscopic activity, elevated fecal calprotectin levels, and relevant clinical history. Histologic activity was considered when available; however, histologic activity without clinical or endoscopic activity was not considered as active-CD (aCD) or active-UC (aUC). Samples with ambiguous diagnoses were excluded.
The study was conducted in accordance with the Declaration of Helsinki and approved by the Institutional Research Ethics Committee of the CIUSSS de l'Estrie—CHUS (protocol code 1991-17, 90-18, last date of approval 2025-08-27).
Sample preparation for mass spectrometry analysis
Sample preparation followed the previously described protocol (14). Briefly, 100 mg of frozen stool was dissolved in lysis buffer (25 mM Tris, 1% sodium dodecyl sulfate, pH 7.5), centrifuged, and protein concentration was measured through bicinchoninic acid assay in the aqueous phase. Samples were reduced (10 mM dithiothreitol), alkylated (15 mM iodoacetamide), and quenched (10 mM dithiothreitol). Proteins were precipitated with cold acetone and methanol, digested using Trypsin/Lys-C, and peptides were purified with Strata-X SPE columns, dried at 37°C for 45 minutes, and stored at −80°C. Before liquid chromatography-tandem mass spectrometry (LC-MS/MS) analysis, peptides were resuspended in 20 μL mobile phase (0.2% formic acid, 3% dimethyl sulfoxide in water).
Identifying and quantifying proteins and peptides in stool samples
The acquisition of SWATH LC-MS/MS data was conducted as previously described (14,15). Briefly, proteomic analysis was performed at the Allumiqs Solutions proteomics facility using an Eksigent μUHPLC system coupled with an ABSciex TripleTOF 6600 mass spectrometer in DIA mode. Chromatographic separation was achieved on a reverse-phase column, and SWATH acquisition parameters were optimized using the SWATH Variable Window Calculator (Sciex).
Spectral library generation involved processing proteins from pooled samples on a polyacrylamide gel, followed by peptide extraction. Data were acquired in data-dependent acquisition mode and searched against the human proteome database using MSFragger (FragPipe v19.1) (16). The resulting spectral library included ∼2000 proteins. Label-free quantification was performed with DIA-NN software (v1.8.1) using match between run mode, which transfers peptide identifications across runs based on accurate mass and retention time alignment to increase data completeness, applying gene-based protein inference at a 1% false discovery rate threshold. Full technical details, including LC gradient conditions and normalization strategies, are provided in the supplementary material (17).
Statistical analysis for discovering potential biomarkers
The key steps of the methodology are summarized in Figure 1. A total of 69 stool samples were analyzed across 4 mass spectrometry batches. Eighty percent of the samples (35 aCD, 18 aUC) were used for training a predictive model, while the remaining 16 samples served as a blind test set for validation.
Schematic representation of the workflow for biomarker selection and developing the predictive machine learning model. KNN, k-nearest neighbors; NB, Naive Bayes; RF, Random Forest; ROC, receiver operating characteristic; SHAP, SHapley Additive exPlanations; SMOTE, Synthetic Minority Oversampling Technique; SVM, Support Vector Machine; Xgb, eXtreme Gradient Boosting.
Data preprocessing followed previously described protocols (14) including log2 transformation, quantile normalization (preprocessCore package (18)), and batch effect correction (ComBat function, sva package (19)). Missing values were imputed using the K-nearest neighbors (KNN) method (impute package (20)). Differentially expressed proteins (DEPs) were identified using ProStar (v1.30.5) (21) through the Welch t test (fold change ≥1.5, P < 0.05, adjusted for the false discovery rate using the st.boot method).
We also used 4 distinct feature selection algorithms in R including (i) Recursive Feature Elimination and (ii) Boruta from Boruta package (22), and (iii) Random Forest (RF) and (iv) Regularized Random Forest (RRF) from RRF package (23). These algorithms were used to compute and compare the statistical significance of potential biomarkers in our data set.
Implementation of machine learning algorithms
Six machine learning algorithms were trained for binary classification: KNN, Naive Bayes (NB), eXtreme Gradient Boosting, RF, Support Vector Machine, and Lasso and Regularized Logistic Regression (glmnet), implemented in caret package in R (24).
Models were trained using the training data set, and their performance was evaluated based on sensitivity, specificity, precision, recall, F1-score (harmonic mean of precision and recall), and balanced accuracy to distinguish aCD from aUC. The analysis was conducted using 10-fold cross-validation with 3 repeats to minimize the risk of overfitting. Hyperparameter tuning was conducted using tuneGrid, optimizing model parameters for the best performance. The Synthetic Minority Oversampling Technique was used to address class imbalance in the data set. The best-performing model was selected based on validation metrics and applied to a blind testing data set for final evaluation.
Network and gene ontology analysis of differentiating proteins
We conducted a network analysis of the 51 differentiating proteins, assessing key metrics such as centrality and betweenness to determine their network importance. The network was built using STRING database (v12.0). In addition, we analyzed the biological processes and molecular functions of these proteins using Gene Ontology (GO) terms (25,26) to classify their roles. This approach clarifies their biological interactions and highlights their functional significance. We also retrieved the GO term using GOATOOLS (v1.2.3) (27), in Python, with the 2024-08-01 GO annotations and 2024-06-17 GO definitions. For Table 1, the smallest level term was chosen for annotation. To identify common terms within the network (Table 3), the human proteome (UniProtKB: UP000005640) or the detected proteome served as the background set, while the 51 differentially expressed proteins were used as the query set.
RESULTS
Patient demographics and stool sample distribution
A total of 69 stool samples were collected, comprising 46 from patients with aCD and 23 from patients with aUC. The aCD samples included a mix of ileal (55%), colonic (21%), and ileocolonic (24%) cases. The age range of participants was from 19 to 83 years, with a mean age of 49.5 years. The sex distribution was nearly equal across both groups, with 53% female and 47% male.
Protein identification and feature selection
From the SWATH-MS data, we identified ∼8,000 peptides, which were mapped to ∼1,250 human proteins using gene-level inference with DIA-NN and a custom data-dependent acquisition-derived spectral library. After removing contaminants and filtering for proteins with less than 30% missing values across samples, 250 high-confidence proteins were retained for downstream analysis. After normalization, batch effect correction, and missing value imputation, we identified 51 DEPs between aCD and aUC, based on P value and fold change (Figure 2a). Of these, 32 were higher in aUC and 19 were higher in aCD. Table 1 lists these 51 DEPs along with their primary molecular functions and biological processes.
(a) The volcano plot displays DEPs, with blue for upregulated proteins in aCD and red for aUC, based on Log2FC and P value. (b–e) Bar plots show feature importance from different selection methods: RF (b), Boruta (c), Regularized RF (d), and RFE (e), with green bars highlighting confirmed important features. (f) PCA plot using 16 selected biomarkers shows a clear separation between aCD and aUC, validating their effectiveness in distinguishing the 2 conditions. aCD, active Crohn's disease; aUC, active ulcerative colitis; DEP, differentially expressed protein; Log2FC, Log2 fold change; PCA, principal component analysis; RF, Random Forest; RFE, Recursive Feature Elimination.
In Figure 2b–e, the plots represent feature importance for each feature selection method including RF, Boruta, RRF, and Recursive Feature Elimination. Each algorithm uses different methods to assign a score to each protein. By comparing the results of these methods, we selected the top important features, identified by at least 1 feature selection method, resulting in 16 proteins. Notably, annexin A2 (ANXA2), group IB phospholipase A2 (PLA2G1B), and chymotrypsin-like elastase 3B consistently received top scores across all feature selection methods. Figure 2f indicates that the principal component analysis based on these 16 selected proteins allows for clear differentiation between the classes.
Selected proteins expression levels
The expression levels of these 16 proteins in aCD and aUC samples are depicted in Figure 3. Significant differences are observed. ANXA2 showed the most significant differences, and zinc finger protein 790 exhibited no significant difference based on the Mann-Whitney U test. However, no single protein's expression level consistently distinguished the 2 groups because partial overlap between aCD and aUC samples is evident for each protein. This necessitates the use of machine learning for effective classification.
*The plot shows the expression levels of 16 selected proteins in active Crohn's disease (aCD, red) and active ulcerative colitis (aUC, blue) patients. Statistical significance between the 2 groups was assessed using the Mann-Whitney test. Significant differences are marked by asterisks (***q-value < 0.001, **q-value < 0.01, q-value < 0.05), and “ns” denotes nonsignificant differences. Horizontal lines represent the median with SD protein expression levels for each group. Despite these significant differences, there is no single threshold that can reliably distinguish between the groups, indicating partial overlap. This underscores the necessity of using machine learning for effective classification.
Supervised machine learning model evaluation
Model performance was evaluated using average F1 scores and balanced accuracy, along with their variance across folds in Table 2 with the corresponding best-tuned hyperparameters. Since cross-validation randomly splits the data set into different training and validation sets for each fold, slight variations in training data led to fluctuations in model performance. Although eXtreme Gradient Boosting and RF reached 100% accuracy, their lower balanced accuracy and F1 scores suggest overfitting, indicating poor generalization. By contrast, NB and KNN showed high performance with lower variance, making them the best candidates for further evaluation on unseen data.
Performance on test data set
The performance of NB and KNN on the 16-sample test data set is shown in receiver operating characteristic curves (Figure 4a, b). KNN had a training area under the curve (AUC) of 0.95 and a test AUC of 0.90, with a drop in F1 score from 0.93 to 0.84, suggesting some overfitting. NB, however, showed consistent performance (training AUC = 0.96 [95% confidence interval (CI) 0.91–1.00], test AUC = 0.96 [95% CI 0.88–1.00]), with no signs of overfitting. For NB, sensitivity, specificity, and accuracy were 0.86, 0.89, and 0.87, respectively (95% CI 74.66%–94.52%), reinforcing the model's robustness in training. In testing, these metrics remained strong at 0.82, 0.80, and 0.81 (95% CI 0.55–0.96), further supporting its generalizability. Based on these results, NB was selected as the final classifier for distinguishing aCD from aUC.
Performance comparison of K-nearest neighbors (KNN) and Naive Bayes (NB) models, selected based on training results, on the test data set. (a) KNN model receiver operating characteristic (ROC) curve comparison for training and test data sets shows overfitting, with a training area under the curve (AUC) of 0.95 and test AUC of 0.90 and the F1 score dropping from 0.93 (training) to 0.84 (test). (b) NB model ROC curve shows consistent performance with both training and test AUC of 0.96 with NB prediction of 86% sensitivity, 89% specificity, and 87% accuracy for the training data set and 82% sensitivity, 80% specificity, and 81% accuracy for the test data set.
SHAP value
To assess the contribution of each feature (protein) in the NB model, we used SHapley Additive exPlanations (SHAP) values (Figure 5a). Features are ranked by impact, with colors indicating values for each observation. ANXA2 and PLA2G1B were the most influential, with low values strongly predicting aCD. Similarly, low amyloid P component, serum (APCS, also known as SAP) values were highly associated with aUC. Other features had moderate effects, suggesting the model captures correlations, further explored in the Pearson correlation plot (Figure 5b).
(a) SHAP analysis shows the impact of each protein in the Naive Bayes model using 16 selected features. Features are ranked by importance, with each dot representing an individual observation. Colors indicate feature values (yellow for high, purple for low). (b) Pearson correlation clustering confirms complementary effects among medium-impact features. (c) An interconnected network of 51 differentially expressed proteins, with selected proteins highlighted in green. Several proteins were not found in the STRING database (CUZD1, IGHA1, IGHA2, IGHG1, IGHG2, and IGLC3), and others were found but showed no connections (AMY1A, ASAH2, FBXO3, IQCK, PYHIN1, RNF170, and ZNF790). (d) Expanded network analysis links DEPs to biological processes and molecular functions, with PLA2G1B, ACE, CPA1-2, and CELA3B playing roles in immune response and proteolysis.
Network analysis
We analyzed the 51 DEPs to determine their connectivity (Figure 5c). Fifteen proteins formed an interconnected network, apart from APCS, angiotensin-converting enzyme (ACE), and Amylase, which act as central hubs, mostly positioned at the periphery rather than the core, indicating although these proteins are part of the broader biological network, they might not serve as central hubs but still play important roles in specific processes or pathways. Supplementary Table S1 (Supplementary Digital Content 1, http://links.lww.com/CTG/B394) highlights proteins such as ACE, pancreatic alpha-amylase, carboxypeptidase A1, and APCS with high centrality and betweenness, suggesting their importance within the network. Figure 5d expands the analysis to include biological processes and molecular functions, with selected proteins marked in green. Key biomarkers (PLA2G1B, ACE, carboxypeptidase A1-2, and chymotrypsin-like elastase 3B) are linked to antibacterial humoral response and proteolysis, suggesting their potential involvement in immune response and metabolism.
Common gene ontology terms across DEPs
We retrieved GO terms associated with the 51 differentially expressed proteins to identify common biological processes (Table 3). The 16 selected proteins were highlighted among contributing proteins. Key processes included antibacterial immune response and proteolysis, involving 5 proteins.
The prominence of the antibacterial immune response suggests that the immune system's defense against bacteria differs between CD and UC, likely due to how each disease interacts with the gut microbiota. Proteolysis, crucial for immune regulation and inflammation control, seems more active in CD, where deeper tissue damage occurs, compared with the surface-level inflammation seen in UC. These findings highlight the distinct disease mechanisms.
DISCUSSION
In this study, we explored the potential of using SWATH-DIA proteomic profiling of stool samples to distinguish between CD and UC active patients. Our process included 4 main steps: acquiring and processing data, selecting complementary protein biomarkers, training, and optimizing a machine learning model with 53 retrospective samples and validating the model's performance with 16 prospective samples. Remarkably, our model achieved an AUC of 0.96 on both training and test data sets, demonstrating its robustness and stability. This success highlights our ability to effectively process data from 4 different batches, select the best markers, and develop a reliable model based on them for distinguishing CD from UC.
To our knowledge, no stool-based test has achieved this level of distinction between CD and UC; prior work in this area has largely focused on IBD vs non-IBD or relied on different sample types. Fecal calprotectin, for example, is widely used to detect intestinal inflammation but cannot differentiate between the 2 major subtypes of IBD. Fecal calprotectin is a common stool marker of intestinal inflammation but does not distinguish CD from UC. Serologic adjuncts (anti-saccharomyces cerevisiae antibodies/perinuclear anti-neutrophil cytoplasmic antibodies) provide only moderate subtype discrimination (28). Recent reviews published in 2022 and 2023 have summarized the landscape of noninvasive IBD biomarkers, categorizing them into serum proteins, serological antibodies, and fecal proteins, and concluded that current options remain suboptimal for CD vs UC classification and are not ready for clinical use (10,29,30). For example, 1 study using a panel of 7 serological markers achieved an AUC of only 0.82, and a machine learning-based microbiome analysis reported similar microbiome profiles in CD and UC, limiting its discriminative utility (31–33). By contrast, our multiprotein stool-based signature demonstrated high accuracy and robustness in this proof-of-concept study, suggesting its potential as a future tool for precision IBD subtyping.
ANXA2, carcinoembryonic antigen-related cell adhesion molecule 7 (CEACAM7), and PLA2G1B consistently ranked among the top features across most selection methods. In addition, the Mann-Whitney U test conducted on 16 selected proteins confirmed that ANXA2, CEACAM7, and PLA2G1B exhibited the most significant difference. Furthermore, protein APCS and elongation factor Tu, mitochondrial (TUFM) also emerged as the next top contributors in this analysis. SHAP value analysis reinforced this finding showing that these proteins were among the most impactful features influencing our final model's decision-making. These findings are supported by previous studies that have explored the roles of these proteins in IBD, with a specific focus on UC and CD, as mentioned below.
ANXA2 which showed higher expression in UC compared with CD in this study, is an important member of the annexin family with a role in cancer progression and inflammation (34). Zhang et al (35) found ANXA2 mRNA expression significantly higher in UC than in CD and healthy controls, correlating with UC severity and histopathological grade. Furthermore, a review by the Tanida group proposed ANXA2 as a potential molecular target for UC treatment (36). These studies highlighted the importance of ANXA2 in differentiating patients with UC from CD.
PLA2G1B, a key pancreatic enzyme, was higher in UC than CD and is involved in fat metabolism, immune function, and gastrointestinal inflammation (37,38). Haller et al (39) found PLA2G1B contributes to IBD because its inactivation protected mice from DSS-induced colitis, suggesting it as a therapeutic target. Although PLA2 group 2 is linked to Crohn's inflammation (40), research on PLA2 group 1 in UC vs CD differentiation remains limited.
CEACAM7, a member of the CEACAM family (41), is specifically expressed in pancreatic and colorectal epithelial cells, particularly on the apical surface of intestinal epithelial cells (IECs). It plays an essential role in normal cellular differentiation and proliferation (41). A microarray analysis of IBD colon biopsies showed CEACAM7 levels significantly decreased in both UC and CD compared with controls, with no difference between the 2 diseases (8). Our analysis found higher CEACAM7 levels in UC than CD, suggesting a more active role in UC pathology, possibly due to differences in mucosal inflammation or epithelial damage.
APCS, a top-ranking biomarker, is higher in CD than UC and regulates inflammation by interacting with the complement system. Research by Wang et al underscores APCS's role as a versatile immunomodulator (42). Torres et al (43) found that APCS, combined with other serum markers, improves CD vs healthy differentiation. Wang et al (44) confirmed higher APCS expression in CD tissue than UC, highlighting its role in CD-UC differentiation.
Using only the top 5 proteins (ANXA2, CEACAM7, PLA2G1B, APCS, and TUFM) yielded slightly lower but still good performance, yet with a larger train-test gap than the 16-protein panel (e.g., AUC 0.91–0.76 vs 0.96–0.96; accuracy 0.87–0.75 vs 0.87–0.81; 95% CIs in Supplementary Table S2, Supplementary Digital Content 1, http://links.lww.com/CTG/B394). This suggests that the larger panel carries complementary information that stabilizes generalization. Consistent with this, correlation analysis showed coordinated signals (H4.16-ANXA2; DEFA1B-TUFM-CEACAM7; moderate coregulation of PLA2G1B with ANXA2), and SHAP indicated small but consistent contributions from proteins such as zinc finger protein 790 despite weak univariate signal. Given the proof-of-concept scope and small cohort, we therefore retained all 16 proteins to avoid discarding useful biology and to limit overfitting to a narrowly defined subset. Practical downselection will occur in next step research during targeted multiple-reaction monitoring verification, guided by analytical criteria (unique peptides, transition quality, matrix effects, linear range/lower limit of quantification, and repeatability) and by performance in larger, multicenter cohorts.
A key limitation of this study is the small cohort size, including only Canadian patients with IBD aged 18 and older, which may limit its generalizability. The data set size is also relatively small for building a fully functional predictive machine learning model with 16 features. Although this study serves as a proof of concept to demonstrate that stool protein biomarkers can classify CD and UC, a larger data set would undoubtedly improve the accuracy and stability of the model. In addition, the accuracy achieved based on the use of a single-center cohort, which may reflect site-specific patterns; future studies will incorporate samples from multiple centers to enhance model robustness and external validity.
Although batch effects were corrected, all samples were analyzed on a single mass spectrometer, potentially limiting reproducibility across laboratories. Validation on multiple spectrometers would improve applicability. In addition, as diagnoses were based on clinical history, endoscopic, and histopathological findings, a small risk of misdiagnosis remains, emphasizing the need for larger, more diverse cohorts. Future efforts will focus on the clinical biomarker approach using targeted mass spectrometry.
In conclusion, this proof-of-concept study demonstrates the potential of SWATH-DIA proteomic profiling for distinguishing CD from UC using stool samples. A machine learning model built on 16 key protein biomarkers achieved an AUC of 0.96 in both training and blind test data sets, highlighting its reliability. ANXA2, CEACAM7, PLA2G1B, APCS, and TUFM consistently ranked as top features, supported by SHAP, correlation, and network analyses. Introducing this noninvasive diagnostic method lays a strong foundation for reducing reliance on invasive procedures and improving the quality of life for individuals with IBD.
To translate these findings toward clinical use, we will develop a targeted multiple reaction monitoring assay for the 16 identified proteins, followed by downselection to a compact panel based on peptide and transition quality, linearity and lower limit of quantification, reproducibility, and cost-effectiveness. This optimized MS-based panel will then be validated in multicenter cohorts with a larger number of samples to ensure robustness, generalizability, and performance across diverse clinical settings. Beyond CD-UC subtyping, the same workflow could be extended to tasks such as distinguishing IBD from non-IBD conditions or predicting disease activity.
CONFLICTS OF INTEREST
Guarantor of the article: Jean-François Beaulieu, PhD.
Specific author contributions: E.S., D.G., and J.-F.B.: conceptualization. E.S., D.G., P.R., J.-F.N., and M.B.: methodology. E.S., D.G., M.M., P.R., and M.D.: collection of samples. E.S. and D.G.: data curation and formal analysis. E.S., F.B., and M.B.: statistical and machine learning analysis. E.S., D.G., M.D., M.B., F.-M.B., and J.-F.B.: funding acquisition. H.G. and J.-F.B.: resources. E.S.: writing—original draft preparation. E.S., D.G., F.B., M.M., P.R., J.-F.N., H.G., M.B., M.D., F.-M.B., and J.-F.B.: writing—review and editing. M.B, M.D., F.-M.B., and J.-F.B.: supervision. All authors have read and agreed to the published version of the manuscript.
Financial support: This work was supported by grants from Crohn's and Colitis Canada (grant 1031647) to M.D., M.B., F.-M.B., and J.-F.B. and the Natural Sciences and Engineering Research Council of Canada through a cooperative ENGAGE grant to J.-F.B. with Allumiqs Solutions. E.S. was the recipient of a doctoral studentship from the Faculty of Medicine and Health Science of the Université de Sherbrooke. D.G. was the recipient of an MITACS postdoctoral fellowship obtained in collaboration with Allumiqs Solutions. J.-F.B. was the recipient of the Canada Research Chair in Intestinal Physiopathology. The funders had no role in the design of the study; in the collection, analyses or interpretation of the data; in the writing of the manuscript; or in the decision to publish the results.
Potential competing interests: H.G., J.-F.N., and D.G. are the CSO & Director and employees, respectively, of Allumiqs. E.S, D.G., M.M., H.G., J.-F.N., and J.-F.B. are the inventors of the intellectual property owned by TransferTech Sherbrooke, a valorization society for the Université de Sherbrooke, and the subject of a provisional patent. The other authors declare no conflict of interest.
Ethical considerations: The research protocol for accessing stool samples from patients who have been tested for f-cal included a reverse consent procedure for using residual stool samples and accessing the related clinical data on the Ariane network for diagnosis. The study was conducted in accordance with the Declaration of Helsinki and approved by the Institutional Research Ethics Committee of the CIUSSS de l'Estrie—CHUS (protocol code 1991-17, 90-18, last date of approval 2025-08-27).
Disclosure of AI tool use: ChatGPT (OpenAI) was used to assist in clarifying and/or simplifying portions of the manuscript text. The authors reviewed and edited all content to ensure accuracy and adherence to publication standards. The authors take full responsibility for the final content of the manuscript.
Data availability: The mass spectrometry proteomics data have been deposited in the ProteomeXchange Consortium through the PRIDE partner repository http://www.ebi.ac.uk/pride with the data set identifier PXD057120. Study HighlightsWHAT IS KNOWN
- ✓ A reliable noninvasive method for differentiating Crohn's disease (CD) and ulcerative colitis (UC) is lacking.
- ✓ Current diagnosis relies on invasive colonoscopy and histopathology.
- ✓ Fecal proteins reflect intestinal inflammation, making them potential biomarkers.
- ✓ Existing proteomic studies have not provided a consistent model for distinguishing CD from UC. WHAT IS NEW HERE
- ✓ High-throughput sequential window acquisition of all theoretical mass spectra mass spectrometry and machine learning successfully classified CD and UC using stool biomarkers.
- ✓ A predictive model based on 16 proteins achieved area under the curve 0.96 in both training and test data sets.
- ✓ Annexin A2; carcinoembryonic antigen-related cell adhesion molecule 7; group IB phospholipase A2; amyloid P component, serum; and TUFM emerged as the most significant biomarkers.
- ✓ Developing a noninvasive stool test for CD-UC differentiation improves clinical management.
Supplementary Material
**
**
The reference list from the paper itself. Each links out to its DOI / PubMed record.
- 1Tontini GE Vecchi M Pastorelli L . Differential diagnosis in inflammatory bowel disease colitis: State of the art and future perspectives. World J Gastroenterol 2015;21(1):21–46.25574078 10.3748/wjg.v 21.i 1.21PMC 4284336 · doi ↗ · pubmed ↗
- 2Colombel JF Panaccione R Bossuyt P . Effect of tight control management on Crohn's disease (CALM): A multicentre, randomised, controlled phase 3 trial. Lancet 2017;390(10114):2779–89.29096949 10.1016/S 0140-6736(17)32641-7 · doi ↗ · pubmed ↗
- 3Van Assche G. Fecal biomarkers for the diagnosis and management of inflammatory bowel disease. Gastroenterol Hepatol (N Y) 2011;7(6):396–8.21869871 PMC 3151412 · pubmed ↗
- 4Di Ruscio M Vernia F Ciccone A . Surrogate fecal biomarkers in inflammatory bowel disease: Rivals or complementary tools of fecal calprotectin? Inflamm Bowel Dis 2017;24(1):78–92.29272479 10.1093/ibd/izx 011 · doi ↗ · pubmed ↗
- 5Zhang L Mao R Lau CT . Identification of useful genes from multiple microarrays for ulcerative colitis diagnosis based on machine learning methods. Sci Rep 2022;12(1):9962.35705632 10.1038/s 41598-022-14048-6PMC 9200771 · doi ↗ · pubmed ↗
- 6Kang DY Park JL Yeo MK . Diagnosis of Crohn's disease and ulcerative colitis using the microbiome. BMC Microbiol 2023;23(1):336.37951857 10.1186/s 12866-023-03084-5PMC 10640746 · doi ↗ · pubmed ↗
- 7Starr AE Deeke SA Ning Z . Proteomic analysis of ascending colon biopsies from a paediatric inflammatory bowel disease inception cohort identifies protein biomarkers that differentiate Crohn's disease from UC. Gut 2017;66(9):1573–83.27216938 10.1136/gutjnl-2015-310705 PMC 5561380 · doi ↗ · pubmed ↗
- 8Granlund Av B Flatberg A Østvik AE . Whole genome gene expression meta-analysis of inflammatory bowel disease colon mucosa demonstrates lack of major differences between Crohn's disease and ulcerative colitis. P Lo S One 2013;8(2):e 56818.23468882 10.1371/journal.pone.0056818 PMC 3572080 · doi ↗ · pubmed ↗