Correlation Between the Body Mass Index and the Distance From the Skin to the Lumbar Epidural Space in Term Parturients
Dinesh Tamilselvan, Sarita Ramchandani, Vinita Singh, Monica Khetrapal, Pradeep Khobragade, Chinmaya K Panda

TL;DR
This study found a strong positive correlation between body mass index and the distance from the skin to the lumbar epidural space in pregnant women, suggesting ultrasound can help in epidural placement.
Contribution
The study provides new data on the correlation between BMI and epidural space depth in Indian parturients using ultrasound.
Findings
A strong positive correlation (r = 0.94) was found between BMI and skin-to-lumbar epidural distance (SLED).
Ultrasound imaging can help determine SLED, especially in obese patients where anatomical landmarks are hard to identify.
The Kruskal-Wallis test showed significant differences in SLED across BMI categories (P < 0.001).
Abstract
Introduction Placement of lumbar epidural catheters is the gold standard practice for providing labor analgesia in parturients. The optimal insertion of the epidural catheter is determined by several patient-related factors, including body mass index (BMI), gestational age, race, ethnic background, and the anatomy of the spine. To date, several studies have been conducted to evaluate the lumbar epidural space depth in varied populations across the globe. However, limited data are available regarding the BMI and its correlation with the skin-to-lumbar epidural distance (SLED) in Indian parturients. Hence, this observational study was undertaken to investigate the correlation between the BMI and the SLED under ultrasound guidance in parturients with 37 to 42 weeks of gestational age visiting the labor room of a tertiary care institute in central India. Methods This observational study…
Genes, proteins, chemicals, diseases, species, mutations and cell lines named across the full text — each resolved to its canonical identifier and authoritative record.
Click any figure to enlarge with its caption.
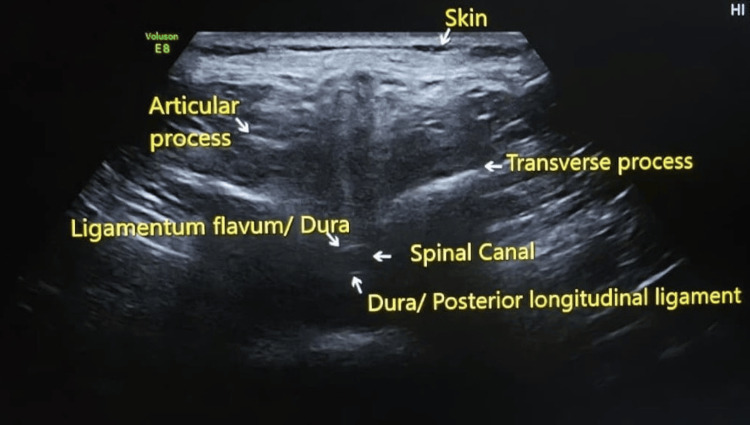 Figure 1
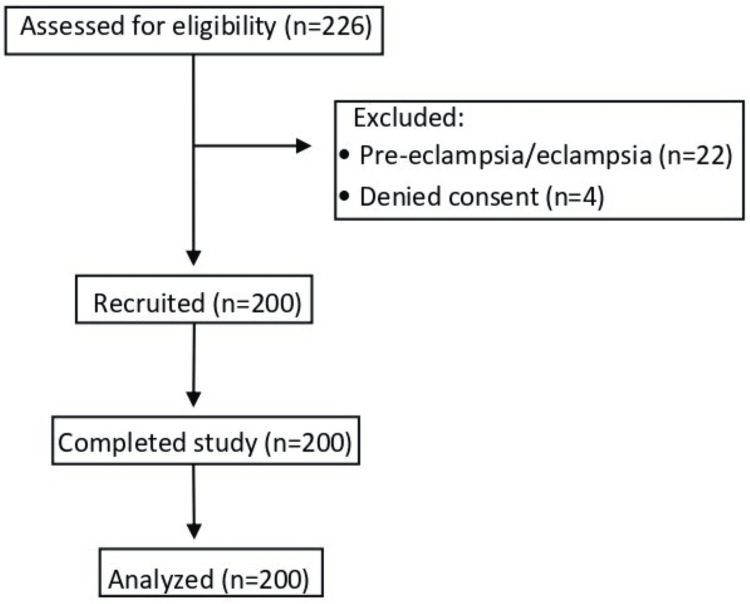 Figure 2
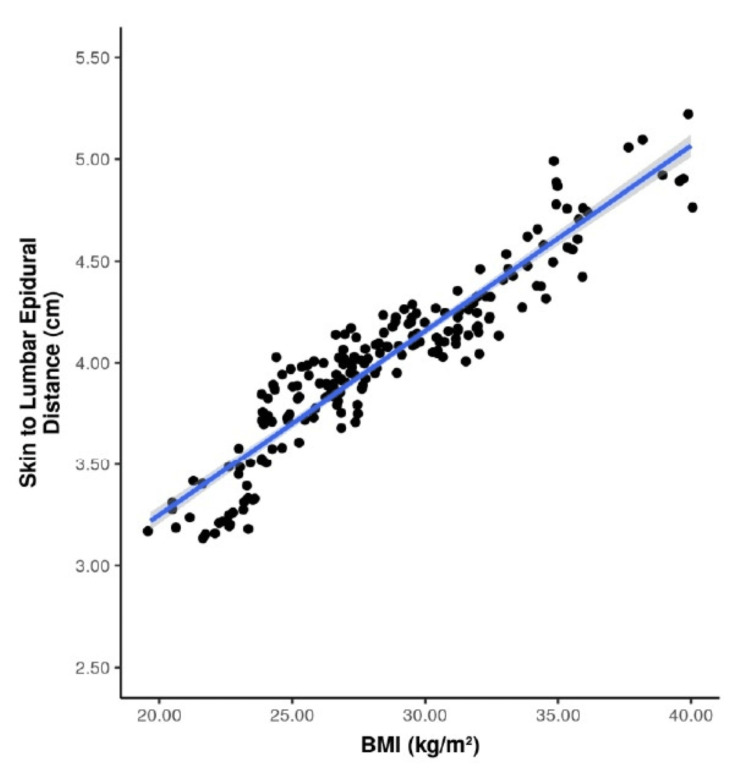 Figure 3
| Classification | BMI (kg/m²) |
| Underweight | <18.50 |
| Normal weight | 18.50-24.99 |
| Overweight | ≥25.00 |
| Pre-obese | 25.00-29.99 |
| Obese class I | 30.00-34.99 |
| Obese class II | 35.00-39.99 |
| Obese class III | ≥40.00 |
| Parameters | Number (n=200) | Percentage (%) |
| Age group (years) | ||
| 20-25 | 49 | 24.5% |
| 26-30 | 82 | 41.0% |
| 31-35 | 65 | 32.5% |
| 36-40 | 4 | 2.0% |
| BMI (kg/m²) | ||
| <18.50 | 0 | 0 |
| 18.50-24.99 | 46 | 23.0 |
| 25.00-29.99 | 87 | 43.5 |
| 30.00-34.99 | 50 | 25.0 |
| 35.00-39.99 | 15 | 7.5 |
| ≥40.00 | 2 | 1.0 |
| Parameters | Mean ± SD | Median (IQR) | Range (min.-max.) |
| Age (years) | 28.65 ± 3.80 | 29.00 (26.00-32.00) | 20.00-37.00 |
| Gestational age (weeks) | 38.42 ± 0.94 | 38.29 (37.57-39.04) | 37.00-40.86 |
| Weight (kg) | 69.58 ± 11.84 | 69.00 (60.00-76.00) | 47.00-102.00 |
| Height (m) | 1.56 ± 0.06 | 1.56 (1.52-1.61) | 1.40-1.75 |
| BMI (kg per m²) | 28.40 ± 4.35 | 27.60 (25.20-31.24) | 19.67-40.00 |
| SLED (cm) | 4.01 ± 0.42 | 4.03 (3.82-4.18) | 3.12-5.17 |
| BMI (kg/m²) | SLED (cm) | P value* | |
| Mean ± SD | Median (IQR) | ||
| 18.50-24.99 | 3.47 ± 0.24 | 3.42 (3.25-3.66) | <0.001 |
| 25.00-29.99 | 3.99 ± 0.13 | 3.97 (3.92-4.07) | |
| 30.00-34.99 | 4.28 ± 0.20 | 4.22 (4.13-4.37) | |
| 35.00-39.99 | 4.80 ± 0.18 | 4.81 (4.69-4.94) | |
| ≥ 40.00 | 4.98 ± 0.23 | 4.98 (4.9-5.07) | |
Peer Reviews
No public reviews on file for this paper yet. If you reviewed it on a platform where reviews are public (OpenReview, ICLR, NeurIPS, ICML), you can paste yours below so the community can read it here.
Videos
No videos yet. Explain this paper in a talk, walkthrough, or lecture? Add one.
Taxonomy
TopicsPregnancy-related medical research · Scoliosis diagnosis and treatment · Musculoskeletal pain and rehabilitation
Introduction
Placement of lumbar epidural catheters is the gold standard practice for providing labor analgesia in parturients [1]. The optimal insertion of the epidural catheter is determined by several factors, one of which is the variability in the depth of the epidural space, which may be influenced by the patient's weight, height, body mass index (BMI), gestational age, race, ethnic background, and spine anatomy [2]. To date, several studies have been conducted to evaluate the depth of the lumbar epidural space in varied populations across the globe [3-6]. These studies have shown an increase in the lumbar epidural space depth over the past few decades, from the mean depths of 4.2-4.9 cm in the 1980s and 1990s [5-7] to about 5.4 cm in 2011 [2], which mirrors the rising trend of obesity globally, and parturients are not an exception to it. Literature shows that both ethnicity and BMI significantly influence the skin-to-lumbar epidural distance (SLED). Moreover, at any given BMI, the SLED differs among ethnic groups. As compared to the Asian and Chinese parturients, the SLED is markedly higher in Black, British Black, and White parturients [2].
However, limited data are available regarding the BMI and its correlation with the skin to lumbar epidural distance (SLED) in Indian parturients. Moreover, no such data is available from central India. Hence, this observational study was undertaken to evaluate the correlation between the BMI and the SLED under ultrasound guidance in parturients with 37 to 42 weeks of gestational age (term parturients) visiting the labor room of a tertiary care institute in central India. The primary outcome was to assess the correlation between BMI and SLED in these patients.
Materials and methods
Settings and design
The principles of the Declaration of Helsinki (2013) [8] and the guidelines of the Institute Ethics Committee (IEC) were followed in the conduct of this study. After obtaining approval from the IEC (2478/IEC-AIIMSRPR/2022, dated September 26, 2022) and registering the trial prospectively in the Clinical Trials Registry-India (CTRI/2023/01/048672, dated January 2, 2023), this observational study was conducted from January 2023 to December 2023 at AIIMS, Raipur, which is a tertiary care institute in central India.
Participants
Parturients with 37 to 42 weeks of gestational age, aged 20 to 40 years, belonging to the American Society of Anesthesiologists (ASA) physical status classification 2, were included [9,10]. Patients who refused to give consent, patients with a diagnosed mental disorder, patients with intellectual disabilities, pre-eclamptic patients, eclamptic patients, and patients with spine deformities were excluded from the study.
Parturients visiting the labor room were assessed for eligibility using a purposive sampling technique. Informed and written consent was acquired from all the patients before enrolling them in the study. Baseline patient parameters, including age in years, height in meters (m), weight in kilograms (kg), and gestational age in weeks, were recorded, and BMI (kg/m²) was calculated [11]. To avoid any subjective bias, the SLED in all the patients was measured by a single observer who was trained in the use of ultrasound. The patients were made to sit comfortably. The L3-L4 interspace was identified by palpating the highest point of the iliac crest [12,13]. Ultrasound imaging of the L3-L4 interspace was done by a Mindray UMT-150 mobile trolley ultrasound machine (Mindray Bio-Medical Electronics Co., Ltd., Shenzhen, China). The curvilinear probe operating at a frequency of 2-5 megahertz was placed transversely, perpendicular to the long axis of the spine [14,15], and then adjusted slowly to visualize the L3-L4 intervertebral space. After identifying the L3-L4 intervertebral space, the ligamentum flavum-duramater unit was determined (Figure 1). The SLED was measured in centimeters (cm) using an in-built caliper of the ultrasound machine, from the skin to the internal surface of the ligamentum flavum-duramater unit [16,17].
Ultrasound image of L3-L4 spine
Patients were categorized into different BMI classes, as classified by the World Health Organization (Table 1) [11]. The mean SLED in each BMI category was noted, and the findings were correlated.
Statistical analysis
Microsoft Excel spreadsheet, version 365 (Microsoft Corp., Redmond, WA) was used to record the data. The IBM SPSS Statistics for Windows, version 23 (IBM Corp., Armonk, NY) was used for data analysis. Mean ± standard deviation (SD) and/or median with interquartile range (IQR) were used to express continuous variables, whereas number (n) and percentage (%) were used to express categorical variables. Data were presented graphically wherever applicable. Skewness, kurtosis, and the Shapiro-Wilk test were applied to verify the normality of the data. A parametric test (Pearson’s correlation coefficient) was used to compute the correlation for data that were normally distributed. The non-parametric test (Kruskal-Wallis test) was used to make group comparisons for the data that were not normally distributed. A P-value of less than 0.05 was regarded as statistically significant.
Sample size
Sample size calculation was based on the SD for the mean ultrasound depth and the minimum difference between the means in the different BMI patients, taken from a previous study done by Arzola et al. [18], using the following formula: [n = \frac{2 \times (Z_{\alpha} + Z_{\beta})^2 \times \sigma^2}{\delta^2}] where n is the sample size; Zα=2.58 at a 99% confidence interval; Zβ=0.84 at 80% power; σ=0.68 (SD); and δ=0.25 (minimum difference in the mean ultrasound depth). After substituting the values, a sample size of 173 was obtained, which was rounded off to 200.
Results
Two hundred twenty-six patients were assessed for eligibility. Following exclusion, 200 patients were included in the final analysis (Figure 2).
Flow diagram
Eighty-two (41%) patients belonged to the age group of 26-30 years, comprising the largest number. Sixty-five (32.5%) and 49 (24.5%) patients belonged to the age groups of 31-35 and 20-25 years, respectively. Only four (2%) patients belonged to the 36 and 40 years of age group, comprising the smallest number. None of the patients belonged to the underweight category with a BMI of <18.50 kg/m². Forty-six (23%) patients belonged to the normal weight category with a BMI of 18.50-24.99 kg/m². Eighty-seven (43.5%) patients belonged to the pre-obese group, with a BMI of 25.00-29.99 kg/m², whereas 50 (25%), 15 (7.5%), and 2 (1%) patients belonged to the obese class I, II, and III, respectively (Table 2).
The age of the patients (in years) ranged from 20 to 37, with a mean ± SD of 28.65 ± 3.80 and a median (IQR) of 29.00 (26.00-32.00). The gestational age of the patients (in weeks) ranged from 37.00 to 40.86, with a mean ± SD of 38.42 ± 0.94 and a median (IQR) of 38.29 (37.57-39.04). The weight of the patients (in kg) ranged from 47 to 102, with a mean ± SD of 69.58 ± 11.84 and a median (IQR) of 69.00 (60.00-76.00). Patient’s height (in meters) ranged from 1.40 to 1.75, with a mean ± SD of 1.56 ± 0.06 and a median (IQR) of 1.56 (1.52-1.61). The BMI of the patients (in kg/m²) ranged from 19.67 to 40.00, with a mean ± SD of 28.40 ± 4.35 and a median (IQR) of 27.60 (25.20-31.24). The SLED of the patients (in cm) ranged from 3.12 to 5.17, with a mean ± SD of 4.01 ± 0.42 and a median (IQR) of 4.03 (3.82-4.18) (Table 3).
On comparing the SLED among various BMI groups (Table 4), it was noted that with the increase in the BMI, the mean and median SLED were also increasing, with the lowest reading in the BMI group of 18.50-24.99 kg/m² and the highest reading in the BMI group of ≥ 40.0 kg/m². The SLED in five groups of BMI was not normally distributed; therefore, a non-parametric test (Kruskal-Wallis test) was used to make group comparisons, and a significant difference was noted (χ2 = 159.650, P < 0.001).
With regard to the distribution of BMI and SLED among the patients, there appeared to be only one mode/peak, making the data unimodal. Two out of the three normality assumption criteria, namely, skewness, kurtosis, and the Shapiro-Wilk test results, were suggestive of normality, so it appeared that the data were normally distributed. Pearson's correlation (a parametric test) was used to explore the correlation between BMI and SLED, and a strong positive correlation was noted with a correlation coefficient (r) = 0.94 and P < 0.001.
Figure 3 illustrates a scatter plot demonstrating the relationship between BMI (kg/m²) and SLED (cm). Each dot corresponds to an individual participant. The blue regression line indicates the overall trend between the two parameters, while the grey band represents the 95% confidence interval of the fitted line.
Scatterplot depicting the correlation between BMI and SLEDBMI, body mass index; SLED, skin to lumbar epidural distance; kg, kilograms; m, meters; cm, centimeters
Discussion
Two hundred patients were included in the final analysis. Patients were categorized into different BMI classes as classified by the World Health Organization [11]. As there were no participants in the BMI category of <18.50 kg/m², the data from the remaining five BMI groups were analyzed and assessed for their correlation with SLED (cm).
In our study, a strong positive correlation was observed between BMI and SLED. The findings of our study were similar to those of Clinkscales et al., Sharma et al., and Al-Saeed et al. [1,2,19]. Clinkscales et al. conducted a study at the Women's Hospital in Michigan to study the correlation between SLED and BMI [1]. They analyzed records of 2009 parturients with gestational age of 36 weeks and beyond and noted the mean lumbar epidural space depth to be 5.3 ± 1.21 cm and the mean BMI (kg/m²) to be 31.5 ± 6.2. The authors concluded that increasing BMI is associated with increasing depth of the lumbar epidural space. Sharma et al. collected data from 1210 parturients from various maternity units in the United Kingdom to establish the influence of ethnicity and BMI on the SLED and noted the mean SLED to be 5.4 ± 1.1 cm [2]. The authors noted a significant influence of BMI and ethnicity on SLED and concluded that the SLED increased with a corresponding increase in BMI. Al-Saeed et al. conducted a study on 255 parturients at Al-Mosawy Hospital, Basrah, comprising parturients from Iraqi, Japanese, Chinese, Pakistani, German, and British ethnicities, to find the correlation between SLED and BMI [19]. The authors noted that the SLED in most Iraqi obstetric parturients in Basrah ranged from 3 to 7 cm, with a mean of 4.43 ± 0.96 cm, which was greater than that reported in Japanese, Chinese, and Pakistani parturients but lower than that reported in British and German women. The authors concluded that the SLED has a significant correlation with the BMI. In our study, the mean SLED was 4.01 ± 0.42 cm, which was in close approximation to the findings of Al-Saeed et al. [19]. Considering the similar ethnicity of the Indian and the Pakistani women, the mean SLED of our study was almost similar to that of the Pakistani parturients from the aforementioned study. Arzola et al. conducted a study on 61 Canadian parturients to assess the reliability of the ultrasound as a screening tool to ease insertion of lumbar epidurals. In their study, the mean BMI (kg/m²) was 29.7 ± 4.8 [18]. The mean SLED (cm) in terms of ultrasound depth and needle depth was 4.66 ± 0.68 and 4.65 ± 0.72, respectively. The authors found a good agreement between the ultrasound-determined depth and the actual needle depth and suggested that the ultrasound can be used as a dependable screening tool to ease the insertion of lumbar epidurals in laboring patients. In our study, the mean BMI (kg/m²) was 28.40 ± 4.35, while the mean SLED (cm) was 4.01 ± 0.42, which is in close proximity to the findings of Arzola et al. [18]. The main difference between our study and that done by Arzola et al. was that in our study, we assessed SLED using ultrasound only, whereas Arzola et al. assessed the SLED in terms of ultrasound depth as well as the needle depth [18]. Hamza et al. did an observational study in 2123 obstetric patients in a French hospital receiving lumbar epidurals for labor analgesia and cesarean section to identify the factors influencing SLED [20]. The authors noted a positive correlation of the SLED with the parturient's weight and BMI. The SLED was higher when an epidural catheter was inserted in the lateral position as compared to that in the sitting position. The authors noted that the SLED is influenced by the weight and position of the patient.
Strengths
Data regarding SLED in parturients from the Indian sub-continent are limited. So, our study was robust in the sense that it provided us with data from the Indian parturients. Secondly, to avoid any subjective bias, the SLED in all the patients in our study was measured by a single observer trained in the use of ultrasound, which also adds to the strengths of the study.
Limitations
There were a few limitations to this study. Firstly, it was conducted at a single tertiary care center located in central India; so, results may differ in the case of a multicenter study catering to populations from other geographic regions of India. Secondly, it was conducted on term parturients, aged 20-40 years, so the data obtained from this study cannot be applied to other patient populations, including pediatric, male, non-pregnant female, and pre-term obstetric patients. Thirdly, the measurement of SLED using ultrasound was done in a sitting position; so, the results obtained from this study may not be applicable for the insertion of lumbar epidurals in the lateral position. Further, only ultrasound-guided SLED was measured in our study, which was not confirmed with the actual needle insertion. Lastly, cost-effectiveness may limit the use of ultrasound in resource-limited countries like India.
Conclusions
In our study, a strong positive correlation was noted between the BMI (kg/m²) and SLED (cm) in parturients when measured under ultrasound guidance in the sitting position.
The ultrasound may be incorporated as a useful tool in routine clinical practice in the care of parturients to determine SLED before the actual insertion of the epidural needle. This approach may reduce the number of attempts at lumbar epidural catheter placement. It may be particularly helpful in obese parturients, in whom it is difficult to identify the anatomical landmarks of the spine by palpation.
The reference list from the paper itself. Each links out to its DOI / PubMed record.
- 1An observational study of the relationship between lumbar epidural space depth and body mass index in Michigan parturients Int J Obstet Anesth Clinkscales CP Greenfield ML Vanarase M Polley LS 3233271620071769307810.1016/j.ijoa.2007.03.015 · doi ↗ · pubmed ↗
- 2Effect of ethnicity and body mass index on the distance from skin to lumbar epidural space in parturients Anaesthesia Sharma V Swinson AK Hughes C Mokashi S Russell R 9079126620112188312110.1111/j.1365-2044.2011.06812.x · doi ↗ · pubmed ↗
- 3The depth of the lumbar epidural space from the skin Anaesthesia Harrison GR Clowes NW 685687401985402577410.1111/j.1365-2044.1985.tb 10953.x · doi ↗ · pubmed ↗
- 4A multivariate model to predict the distance from the skin to the epidural space in an obstetric population Reg Anesth Segal S Beach M Eappen S 4514552119968896007 · pubmed ↗
- 5Distance to the epidural space in nonobstetric patients Anesth Analg Rosenberg H Keykhak MM 539540631984 https://pubmed.ncbi.nlm.nih.gov/6711848/6711848 · pubmed ↗
- 6Depth of extradural space and dural puncture Anaesthesia Sutton DN Linter SP 9798461991187245910.1111/j.1365-2044.1991.tb 09348.x · doi ↗ · pubmed ↗
- 7Distance from skin to the lumbar epidural space in an obstetric population Reg Anesth Meiklejohn BH 1341361519902265167 · pubmed ↗
- 8World Medical Association Declaration of Helsinki: ethical principles for medical research involving human subjects JAMA 2191219431020132414171410.1001/jama.2013.281053 · doi ↗ · pubmed ↗