Inhibition of PTTG1 suppresses proliferation and promotes differentiation of neuroblastoma cells by inducing autophagy
Lihua Yuan, Xiaobo Wang, Kanglin Dai, Kenneth Kak Yuen Wong

TL;DR
This study shows that inhibiting PTTG1 in neuroblastoma cells reduces their growth and increases autophagy, promoting cell differentiation.
Contribution
The novel finding is that PTTG1 inhibition promotes autophagy and differentiation in neuroblastoma cells.
Findings
PTTG1 inhibition reduces proliferation, invasion, and migration in SK-N-SH cells.
PTTG1 interference increases autophagy markers like LC3II and beclin1.
Autophagy inhibition with 3-MA reverses the effects of PTTG1 suppression.
Abstract
PTTG1 is an oncogene that is highly expressed in various cancers and is involved in regulating the cell cycle in neuroblastoma (NB) cells. However, the specific role of PTTG1 in NB has not been extensively reported. We undertook this study to investigate the expression of PTTG1 in various NB cell lines to identify the gene expression patterns. Small interfering RNA (siRNA) targeting PTTG1 was designed and used to transfect NB cells. Cell proliferation levels, wound healing and transwell experiments were undertaken to assess the invasion and migration abilities of transfected and control NB cells. Western blot, PCR, and immunofluorescence experiments were utilized to detect the expression of migration-related proteins, differentiation-related proteins, and autophagy-related proteins in NB cells. Different doses of the autophagy inhibitor 3-methyladenine (3-MA) were used for validating…
Genes, proteins, chemicals, diseases, species, mutations and cell lines named across the full text — each resolved to its canonical identifier and authoritative record.
Click any figure to enlarge with its caption.
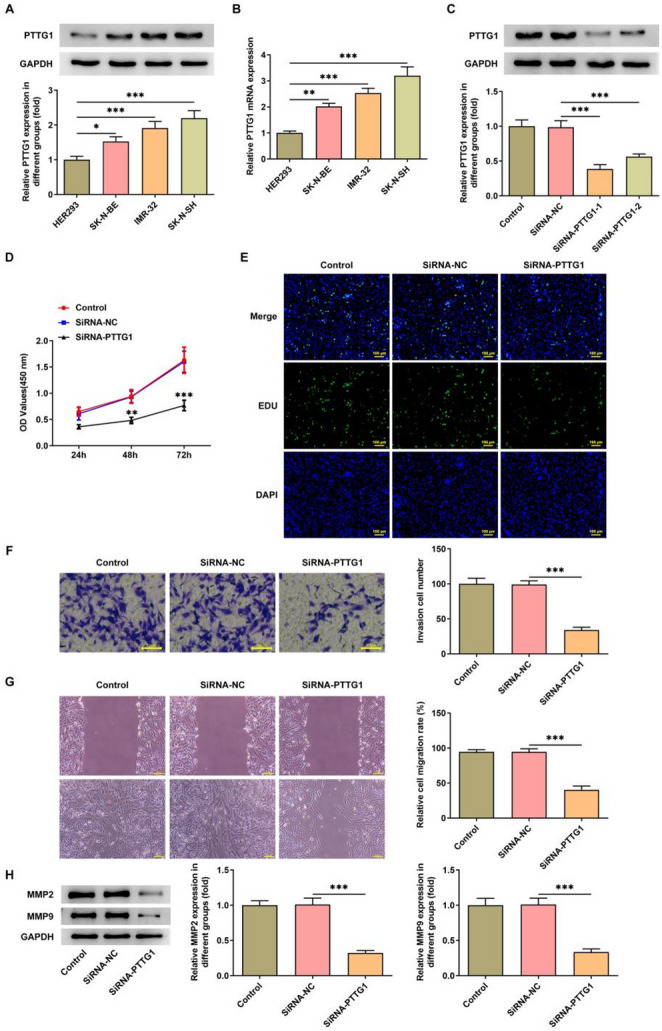 Figure 1
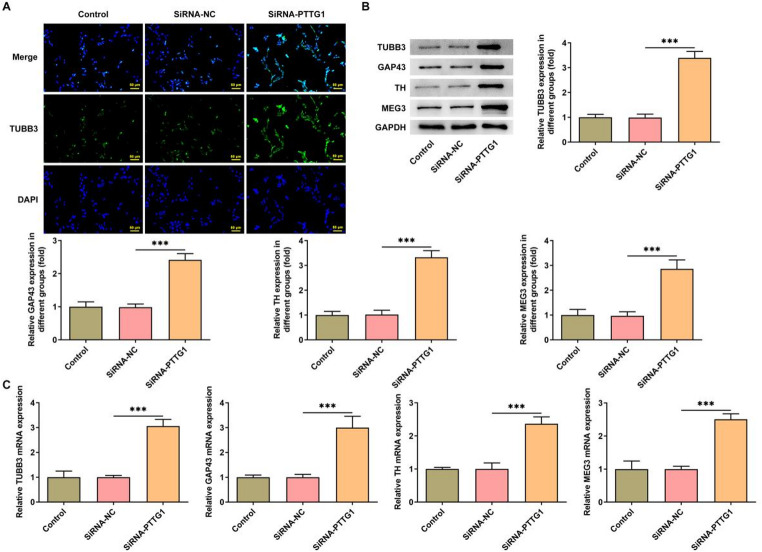 Figure 2
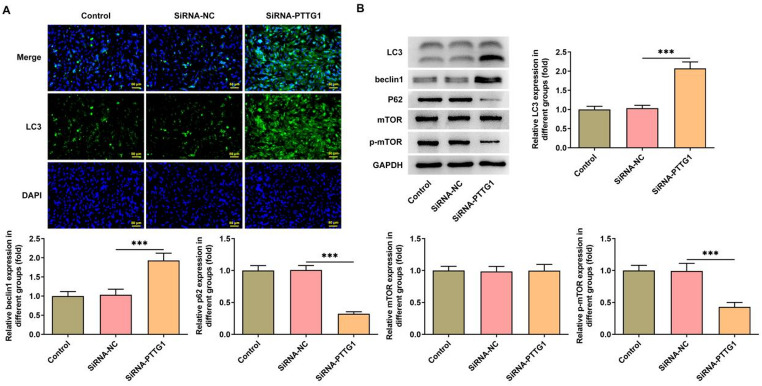 Figure 3
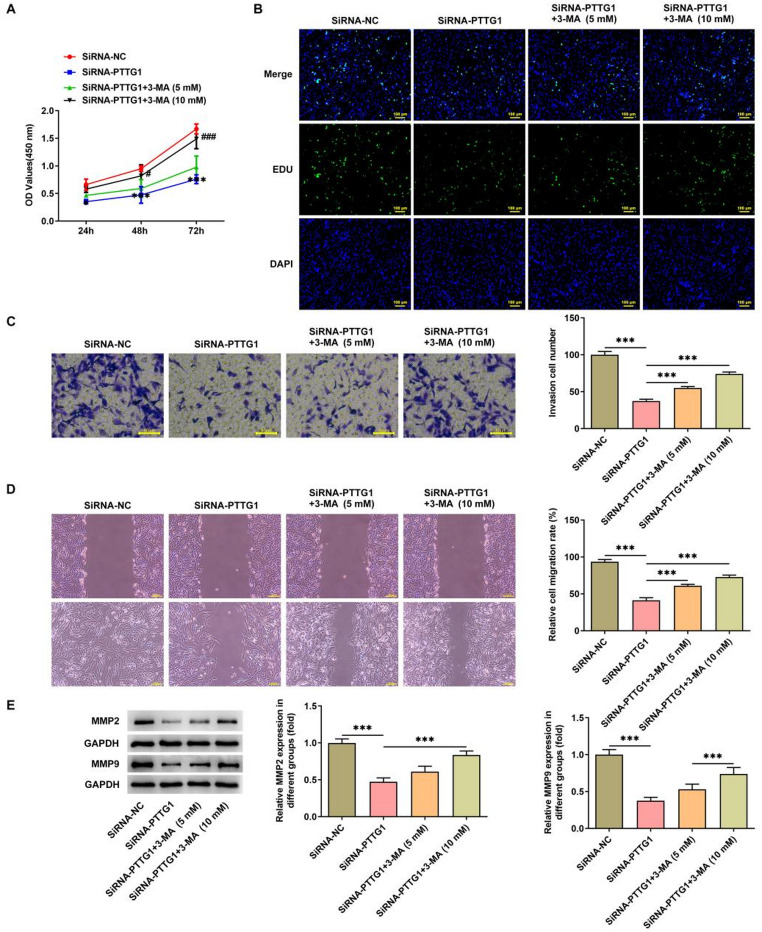 Figure 4
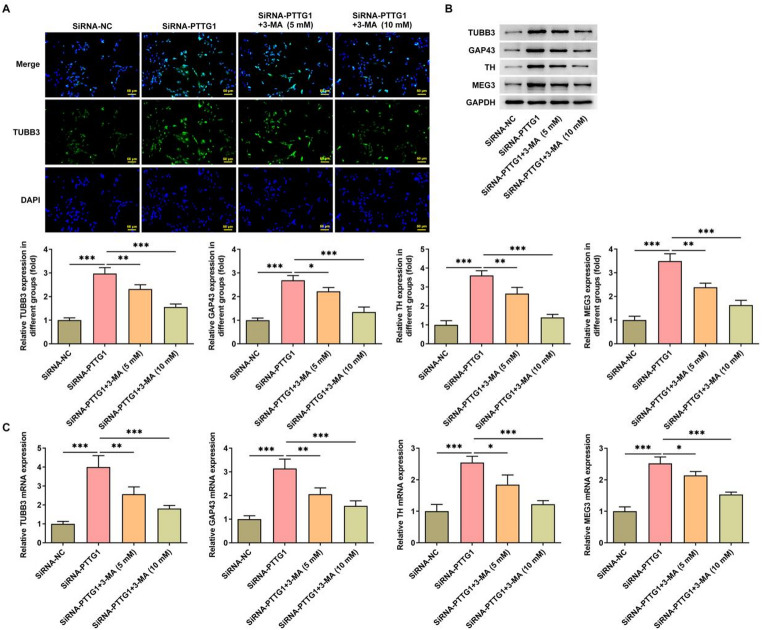 Figure 5
- —Sanming Project of Medicine in Shenzhen
- —Shenzhen Clinical Research Center for Rare Diseases
Peer Reviews
No public reviews on file for this paper yet. If you reviewed it on a platform where reviews are public (OpenReview, ICLR, NeurIPS, ICML), you can paste yours below so the community can read it here.
Videos
No videos yet. Explain this paper in a talk, walkthrough, or lecture? Add one.
Taxonomy
TopicsNeuroblastoma Research and Treatments · Histone Deacetylase Inhibitors Research · Peroxisome Proliferator-Activated Receptors
Introduction
Neuroblastoma (NB) is a malignant tumor of the sympathetic nervous system that originates from neural crest cells. It is the most common extracranial solid tumor in children, accounting for about 15% of childhood cancer deaths [1, 2]. The clinical manifestations of NB vary depending on the location of the primary tumor. Typically, patients present with discomfort, fever, weight loss, and bone pain at the time of diagnosis [3]. Currently, treatment methods for NB mainly include surgical resection, chemotherapy, radiation therapy, high-dose chemotherapy with stem cell transplantation, retinoic acid therapy, and immunotherapy [4, 5]. Statistics show that the survival rate for low- and intermediate-risk NB patients is over 95%, whereas the 5-year survival rate for high-risk NB patients is less than 50% [6, 7]. Therefore, a comprehensive understanding of the molecular biology mechanisms underlying the proliferation and differentiation of NB is necessary to further improve patient prognosis.
Pituitary tumor-transforming gene 1 (PTTG1) is considered an oncogene, highly expressed in various cancers such as bladder cancer, ovarian cancer, and breast cancer [8–10]. PTTG1 promotes tumor cell proliferation, invasiveness, epithelial-mesenchymal transition, and angiogenesis [11, 12]. Current research indicates that PTTG1 is involved in cell differentiation and transformation. It is concurrently expressed in fetal liver and placenta, as well as in pituitary adenomas, breast cancer, and NB [13]. PCNA-associated factor (PCLAF) promotes the G1/S cell cycle progression of NB cells through PTTG1 [14], thereby suggesting the involvement of PTTG1 in the NB process. However, detailed reports on how PTTG1 affects the proliferation and growth of NB have not been published.
Autophagy, as a common mechanism for maintaining cellular homeostasis in eukaryotic cells, plays a dual role in either inhibiting or promoting cancer progression [15]. Studies have shown that Matrine can inhibit the proliferation of NB cells by activating autophagy [16], while TP53BP2 can suppress NB cell proliferation by inducing autophagy [17]. Norcantharidin inhibits the growth of SK-N-SH NB cells by inducing autophagy [18]. This indicates that autophagy is involved in regulating the proliferation and growth of NB cells. Furthermore, research has shown that PTTG1 knockout can inhibit the activation of the mTOR signaling pathway through autophagy regulation [12, 19], suggesting a potential relationship between PTTG1 and autophagy regulation in tumor cells.
Therefore, considering the crucial oncogenic role of PTTG1 in tumor progression, this study will further investigate the role of PTTG1 in NB, aiming to explore whether PTTG1 inhibits NB cell proliferation and growth by regulating autophagy.
Materials and methods
Cell culture
Human embryonic kidney 293 (HEK293) cells, SK-N-BE, IMR-32 and SK-N-SH NB cell lines were provided by the Type Culture Collection of the Chinese Academy of Sciences (Shanghai, China). HEK293 cells were used as a control. The cells were cultured in RPMI-1640 medium (Thermo Fisher scientific, USA) containing 10% fetal bovine serum (FBS) and 1% penicillin/streptomycin at 37 °C in an incubator with 5% CO_2_.
Cell transfection
The small interfering RNA of PTTG1 (SiRNA-PTTG1-1/2) and its negative control (SiRNA-NC) were provided by GenePharma Biotech (Shanghai, China). The cells were inoculated in a 6-well plate at a density of 1 × 10^5^ cells per well. Transfection was performed using the Lipofectamine 2000 according to the manufacturer’s instructions (Invitrogen) when the cells grew to 70–80% confluence. The cells were cultured at 37 ˚C with 5% CO_2_ for 4 h and then the medium was changed to continue culture for 48 h. Western blot (WB) was adopted to detect the transfection efficiency. The 5mM and 10mM [20, 21] autophagy inhibitor 3-methyladenine (3-MA, HY-19312, MedChemExpress, USA) was dissolved into the culture medium for autophagy mechanism verification.
CCK-8 assay
Cell proliferation assays were carried out using a cell counting kit-8 (CCK-8). Transfected cells in 96-well plates and adjusted the cell density to 6 × 10^3^ cells/well. Each well was cultivated for extra 2 h at 37˚C following addition of 10µL CCK-8 solution (Boster, Wuhan, China). Cell activity was assessed by estimating OD450 nm value using a microplate reader.
EDU staining
5-ethynyl-2-deoxyuridine (EdU) staining was used to assess the propagation of NB cells. In brief, transfected NB cells (3 × 10^5^ cells/well) were seeded in a 24-well plate, 10 mM of EdU was added to the medium and cells were incubated for 4 h. Then, the cells were fixed with 4% paraformaldehyde and stained with Hoechst 33,342 for 10 min at room temperature (RT). Images were prepared for observation under a fluorescence microscope (Motic, China) and results were quantified using ImageJ software.
Cell differentiation assay
After 48 h of transfection, cells were fixed and incubated with the neuronal differentiation marker beta-III tubulin (TUBB3) antibody (1:200, ab18207, abcam). Then, the cells were incubated with anti-rabbit immunoglobulin G conjugated to fluorescein isothiocyanate and 4, 6-diamidino-2-phenylindole. Cell images were captured under a fluorescence microscope. Cell differentiation was assessed by analyzing neurite outgrowth and expressed as the number of neurites per 100 cells [22].
Wound healing assay
Transfected cells were cultured in 6-well cell culture plates. After the cells were attached, a gap was made using a tip. The gap was observed at 100× magnification and photographs were taken using a microscope (Olympus, Japan) at 0 h, 24 h, and 48 h. The migratory capacity of the cells was assessed by measuring the change in the size of the injured area.
Transwell assay
Transfected cells were harvested, and 1 × 10^4^ cells in 200µL of DMEM were placed into the upper chamber of Transwell filter membranes precoated with Matrigel. The lower chamber was placed in medium containing 600µL of DMEM with 10% FBS. After 24 h of incubation at 37 °C in a cell culture incubator containing 5% CO2, the cells in the upper chamber were removed. The cells were fixed in methanol for 15 min, stained with crystal violet for 20 min, photographed in five random fields of view under a microscope.
Reverse transcription-quantitative polymerase chain reaction (RT-qPCR) assay
Total RNA of NB cells was extracted by Trizol (Invitrogen, USA). Reverse transcription was applied by the RevertAid RT Reverse Transcription Kit (MR101-02, Vazyme, USA). RT-PCR was conducted with SYBR Premix Ex Taq II reagent by 7500 RT-PCR System (Applied Biosystems, Foster City, CA, USA). The primers for RT-PCR were obtained from PrimerBank. Gene expression was normalized by GAPDH and relative mRNA expression levels were determined by the 2^−ΔΔCT^ method. The sequences of the primers in this study were presented in Table 1.
Table 1. Primer sequencesGenePrimerSequences (5′-3′)GAPDHForwardGATTCCACCCATGGCAAATTCReverseGTCATGAGTCCTTCCACGATACPTTG1ForwardCCCTCAAACAAAAACAGCCAAGReverseGGCATCATCTGAGGCAGGAACGAP43ForwardGGCCGCAACCAAAATTCAGGReverseCGGCAGTAGTGGTGCCTTCTHForwardGGGCTGTGTAAGCAGAACGReverseAAGGCCCGAATCTCAGGCTMEG3ForwardCCTCACCTCCAATTTCCTCTTCReverseTCCAGCAGCTAACCTCATTAACTUBB3ForwardGGCCAAGGGTCACTACACGReverseGCAGTCGCAGTTTTCACACTC
Western blot assay
Cells were collected and lysed with RIPA buffer at 4 °C for 30 min and centrifuged at 12,000 × g for 30 min. The supernatant was collected and quantified by the Protein BCA Quantification Kit (Bio-Rad Laboratories, USA). 20 µg protein was loaded into the well and separated with sodium dodecyl sulfate polyacrylamide gel electrophoresis (SDS-PAGE), then the gel was transferred to the PVDF membrane (Amersham Biosciences). The blots were blocked with 5% BSA at RT for 60 min and then blots were incubated with primary antibody at 4 °C overnight. The primary antibody including anti-PTTG1 (AF0354, 1:1000, Affinity), anti-LC3 (AF5402, 1:1000, Affinity), anti-mTOR (DF6308, 1:1000, Affinity), anti-p62/SQSTM1 (P62) (DF6657, 1:1000, Affinity), anti-GAP43 (DF14676, 1:1000, Affinity), anti-tyrosine hydroxylase (TH) (AF6113, 1:1000, Affinity), anti-MEG3 (1:1500, Affinity, DF7438), anti-TUBB3 (ab18207, 1:1500, Abcam) and anti-GAPDH (ab9485, 1:3000, Abcam). Then the membranes were washed in TBST and incubated with horseradish peroxidase (HRP)-conjugated secondary antibodies for 1 h at RT. The protein signals were exposed using ECL reagent (Beyotime) and the immunoblotting signals were quantitatively analyzed by ImageJ software.
Immunofluorescence
Cells were seeded in 24-well plates (8 × 10^4^ cells/well) and fixed with 4% paraformaldehyde (Sigma-Aldrich). Then, the cells were incubated with 5% Tween-20 for 2 h and blocked with 10% normal goat serum for 1 h. Then diluted primary antibody anti-LC3II (1:100, Abcam) was added and incubated overnight at 4℃. Followed by incubation with a secondary antibody (1:100, DAR-546, Abcam) for 2 h. After washing with PBS, the cell nuclei were re-stained with DAPI solution for 30 min, and observed under a fluorescence microscope (Nikon, Austria).
Statistical analysis
Data were analyzed using SPSS 22.0 software and statistical comparisons of multiple variables were made by one-way analysis of variance (ANOVA) and the Tukey test. All the data were expressed as mean ± standard deviation (SD) of three independent experiments. P < 0.05 was considered to be statistically significant differences.
Results
PTTG1 interference inhibits proliferation, invasion and migration of SK-N-SH cells
We investigated the expression pattern of PTTG1 in NB by examining its expression across different NB cell lines. The findings showed a significant increase in both protein expression (Fig. 1A) and mRNA levels (Fig. 1B) in all three NB cell lines when compared to HEK293, with the most notable elevation was noted in the SK-N-SH cell line. siRNA transfection assays for PTTG1 showed that SiRNA-PTTG1-1 had superior interference efficacy (Fig. 1C), thus it was selected for further studies. PTTG1 interference markedly reduced the cellular viability (Fig. 1D), proliferation (Fig. 1E), invasion (Fig. 1F), and migratory capacity (Fig. 1G) of SK-N-SH cells. Western Blot demonstrated a significant decrease in MMP2 and MMP9 expression in SK-N-SH cells after PTTG1 interference (Fig. 1H).
Fig. 1PTTG1 interference inhibits proliferation, invasion and migration of SK-N-SH cells. PTTG1 protein expression in different NB cell lines (A); PTTG1 mRNA levels in different NB cell lines (B); SiRNA transfection efficiency assay (C); SK-N-SH cell viability (D), proliferative (E), invasive (F) and migratory (G) assays. MMP2 and MMP9 protein expression in SK-N-SH cells (H)
PTTG1 interference promotes SK-N-SH cell differentiation
Beta-III tubulin (TUBB3) serves as a marker for neuronal differentiation. PTTG1 interference notably increased the fluorescence intensity of TUBB3 (Fig. 2A), indicating a reduced differentiation capacity in SK-N-SH cells. Subsequently, the study investigated the expression of additional differentiation markers. The findings demonstrated that interference of PTTG1 significantly increased the protein expression (Fig. 2B) and mRNA levels (Fig. 2C) of growth-associated protein 43 (GAP43), tyrosine hydroxylase (TH), maternally expressed gene 3 (MEG3), and TUBB3.
Fig. 2PTTG1 interference promotes SK-N-SH cell differentiation. TUBB3 fluorescence intensity (A); protein expression (B) and mRNA levels (C) of tyrosine hydroxylase (TH), maternally expressed gene 3 (MEG3) and b-III microtubulin (TUBB3) in SK-N-SH cells
PTTG1 interference promotes autophagy in SK-N-SH cells
The level of autophagy in SK-N-SH cells was assessed by examining the expression of autophagy-related proteins, as illustrated in Fig. 3. After PTTG1 interference, the fluorescence intensity of LC3II increased in SK-N-SH cells (Fig. 3A). WB results showed that the expressions of LC3II/LC3I and beclin1 proteins were increased, while the expression of P62 and mTOR proteins were reduced, when compared to the control and SiRNA-NC groups (Fig. 3B).
Fig. 3PTTG1 interference promotes autophagy in SK-N-SH cells. Immunofluorescence detection of LC3II expression (A); autophagy-related proteins LC3II/LC3I, Beclin1, P62, and mTOR expression (B)
PTTG1 interference acts through autophagy induction and promotes cell differentiation
Autophagy inhibitor 3-MA was used to investigate the mechanistic actions of PTTG1 in SK-N-SH cells. The results indicated that 3-MA mitigated the effects of PTTG1 interference in SK-N-SH cells. As the dosage of 3-MA increased, the cellular activity (Fig. 4A), proliferation level (Fig. 4B), invasive capability (Fig. 4C), and migratory potential (Fig. 4D) of SK-N-SH cells gradually heightened. Moreover, the expression of MMP2 and MMP9 within the cells showed continuous augmentation (Fig. 4E).
Fig. 4PTTG1 interference inhibits proliferation, invasion and migration of SK-N-SH cells by inducing autophagy. SK-N-SH cell activity (A), proliferation level (B), invasive ability (C), and migration level (D) were evaluated, and MMP2 and MMP9 protein expression was detected in SK-N-SH cells (E)
Finally, we investigated the effect of PTTG1 disruption on the differentiation of SK-N-SH cells after applying an autophagy inhibitor. The results showed that treatment with 5mM or 10mM of 3-MA led to a decrease in the fluorescence intensity of TUBB3 in cells (Fig. 5A). Protein expression levels of differentiation markers GAP43, TH, MEG, and TUBB3 (Fig. 5B), as well as mRNA levels (Fig. 5C), significantly decreased.
Fig. 5PTTG1 interference promotes differentiation of SK-N-SH cells by inducing autophagy. TUBB3 fluorescence intensity in SK-N-SH cells (A); protein expression (B) and mRNA levels (C) of the differentiation markers GAP43, TH, MEG3) and TUBB3
Discussion
NB is the most common extracranial tumor in children, and identifying new tumor targets offers the potential to introduce innovative therapeutic strategies aimed at improving the survival and cure rates of high-risk NB patients [23]. This study has revealed increased expression of PTTG1 in various NB cells. Interference of PTTG1 significantly reduced the vitality of SK-N-SH cells, while also reducing cellular proliferation, invasion, and migration, while promoting cellular differentiation and levels of autophagy. The autophagy inhibitor 3-MA mitigated the effects of PTTG1 interference on SK-N-SH cells.
PTTG1 has been implicated in cancer invasion and metastasis [24], with documented overexpression across various malignancies. Its role in the migration, invasion, and metastasis of bladder, cervical, and colorectal cancers has been established [9, 25–27]. This study conducted a preliminary exploration of PTTG1’s role in NB cells, revealing its high expression similar to that of an oncogene in most cancer cells, and correlating with NB cell proliferation, invasion, and migration. NB exhibits heterogeneity, which correlates with tumor location and differentiation status [28]. A critical event in NB pathogenesis is the differentiation arrest at various stages of neuronal cell development, with inducing NB cell differentiation being one clinical approach to treating NB [29]. Differentiation therapy, which induces NB cell redifferentiation while sparing normal cells and tissues, holds promise for maintenance therapy in high-risk NB patients [30]. In this study, we observed that interfering PTTG1 upregulated the protein expression of differentiation markers GAP43, TH, MEG, and TUBB3 in SK-N-SH cells. Currently, research on NB primarily focuses on inhibiting tumor cell proliferation, migration, invasion, and inducing apoptosis [31]. This study demonstrates that PTTG1 regulates not only the proliferation and migration of SK-N-SH cells but also their differentiation level, offering a novel approach for the development of targeted differentiation therapy for NB.
Numerous studies have elucidated the complex interplay between autophagy and metastasis in NB, emphasizing its role in cellular apoptosis, histone modification, angiogenesis, and metabolism [32]. LC3-II is a well-established marker of autophagy, and the ratio of LC3-II/LC3-I serves as a crucial indicator of autophagic activity [33]. Beclin-1, the first mammalian gene implicated in autophagy, along with LC3, plays a central role in the autophagic process [34, 35]. P62, serving as a selective substrate for autophagy, facilitates the formation of protein aggregates for autophagic degradation by interacting with LC3 [36]. mTOR, a critical regulatory pathway for autophagy, has been shown to sustain activation within NB tumors [37]. This study reveals that interfering PTTG1 significantly increases the protein and mRNA expression of LC3II/LC3I, beclin1, P62, and mTOR, suggesting an elevation in autophagic activity within SK-N-SH cells. Furthermore, treatment with autophagy inhibitors significantly attenuates the regulatory effect of PTTG1 interference on the proliferation and differentiation of SK-N-SH cells, indicating the involvement of PTTG1 in NB progression through autophagy mediation.
Nonetheless, this study is preliminary and has certain shortcomings. For example, the choice of the SK-N-SH cell line for investigation was predicated on evaluating PTTG1 expression across diverse NB cell lines. Furthermore, there are many types of NB cell lines, encompassing MYCN-amplified NB cells and non-MYCN-amplified NB cells, displaying variations in phenotype and differential gene expression [38]. The SK-N-SH cell line falls into the subset of non-MYCN amplification. Further validation is needed to elucidate the role of PTTG1 in NB cells with MYCN amplification.
The findings of the present study provide preliminary insights and lay the groundwork for future research endeavors. Additionally, the regulation of autophagy involves a myriad of intricate mechanisms. While it has been observed that downregulating PTTG1 in SK-N-SH cells attenuated mTOR expression, whether the upstream and downstream components of mTOR signaling participate in the actions of PTTG1 necessitates thorough exploration. Moreover, in vitro experiments cannot fully replicate the complexities of the in vivo environment. To delineate the specific role of PTTG1 in NB, subsequent in vivo experiments are essential.
In conclusion, this study conducted a preliminary exploration of the role of the oncogene PTTG1 in NB. The result offers a new perspective for developing novel targets for NB treatment and contributes to a comprehensive understanding of the role of PTTG1 in tumors.
The reference list from the paper itself. Each links out to its DOI / PubMed record.
- 1Smith V, Foster J (2018) High-risk neuroblastoma treatment review. Child (Basel) 5(9):11410.3390/children 5090114 PMC 616249530154341 · doi ↗ · pubmed ↗
- 2Li Q et al (2023) Long-term survival of neuroblastoma patients receiving surgery, chemotherapy, and radiotherapy: a propensity score matching study. J Clin Med 12(3): 75410.3390/jcm 12030754 PMC 991824936769402 · doi ↗ · pubmed ↗
- 3Jahangiri L (2023) Metastasis in neuroblastoma and its link to autophagy. Life (Basel) 13(3):81810.3390/life 13030818 PMC 1005618136983973 · doi ↗ · pubmed ↗
- 4Demeure MJ et al (2013) PTTG 1 overexpression in adrenocortical cancer is associated with poor survival and represents a potential therapeutic target. Surgery 154(6):1405–1610.1016/j.surg.2013.06.058PMC 405494024238056 · doi ↗ · pubmed ↗
- 5Wang N et al (2018) β-asarone inhibited cell growth and promoted autophagy via P 53/Bcl-2/Bclin-1 and P 53/AMPK/m TOR pathways in human glioma U 251 cells. J Cell Physiol 233(3):2434–244310.1002/jcp.2611828776671 · doi ↗ · pubmed ↗
- 6Pham DC et al (2018) FAK and S 6K 1 Inhibitor, neferine, dually induces autophagy and apoptosis in human neuroblastoma cells. Molecules 23(12):311010.3390/molecules 23123110 PMC 632137030486505 · doi ↗ · pubmed ↗