Long-term trends and the role of health resources in under-5 mortality rates: a 2000–2021 longitudinal analysis at the global level
Zeping Zang, Lianlong Yu, Suyun Li, Xiaohui Xu, Han Zhou, Qing Yue, Li Yang

TL;DR
This study examines how under-5 mortality rates have changed globally from 2000 to 2021 and finds that health resources, especially vaccines, have played a major role in reducing these rates.
Contribution
The study quantifies the specific contribution of health resources and vaccines to under-5 mortality rate reductions at both global and G20 levels.
Findings
Global under-5 mortality rates declined by an average of 3.259% annually from 2000 to 2021.
Vaccination coverage and health expenditures increased significantly during the study period.
Vaccines accounted for 72.69% of global U5MR reduction, while health resources contributed 37.26% overall.
Abstract
The under-5 mortality rate (U5MR) is a crucial global health metric for evaluating public health interventions, and further reductions in U5MR are essential for achieving the Sustainable Development Goals (SDGs). This study analyses the trends of U5MR globally from 2000 to 2021 and explores the quantitative impact of health resources on U5MR reduction. This study used WHO public data from 2000 to 2021 to investigate the temporal trend of U5MR through Joinpoint regression analysis. A two-way fixed-effect model was used to investigate the relationship between U5MR and health resources. Data on U5MR and health resources (including six vaccine-related indicators and eight health expenditure-related indicators) were obtained from the WHO Global Health Observatory, encompassing 200 countries and regions from 2000 to 2021. Globally, U5MR declined, though at a slower pace (annual average…
Genes, proteins, chemicals, diseases, species, mutations and cell lines named across the full text — each resolved to its canonical identifier and authoritative record.
Click any figure to enlarge with its caption.
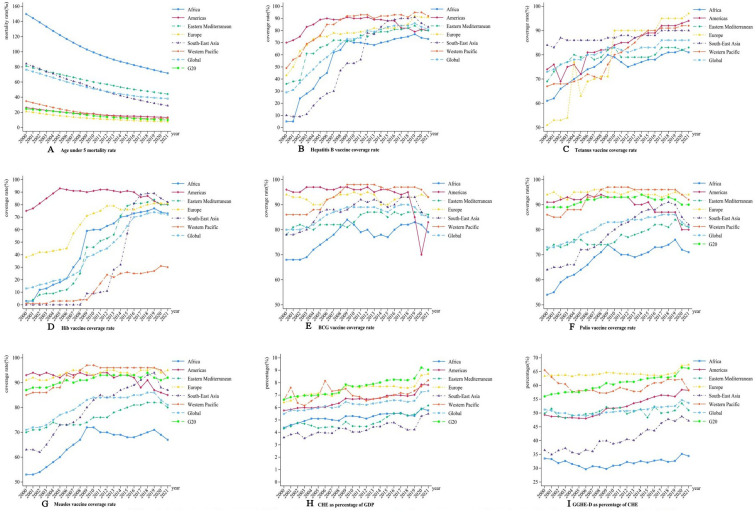 Figure 1
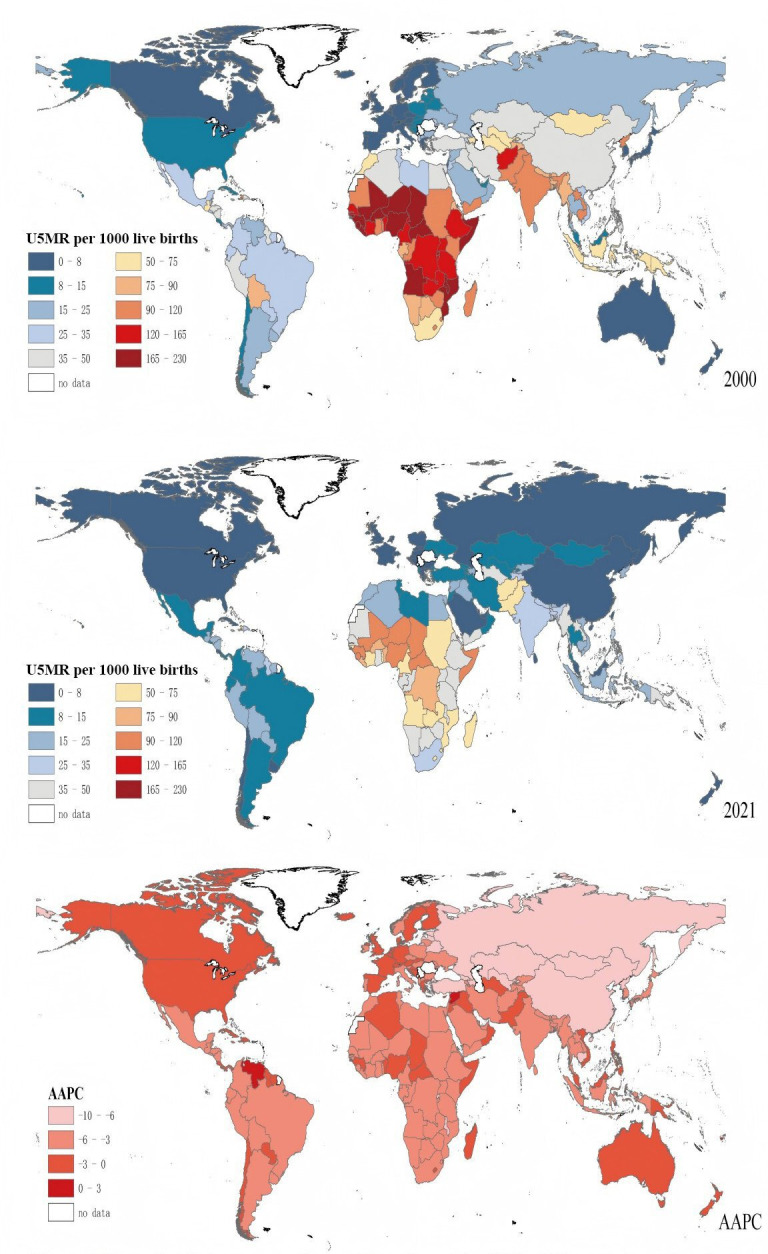 Figure 2
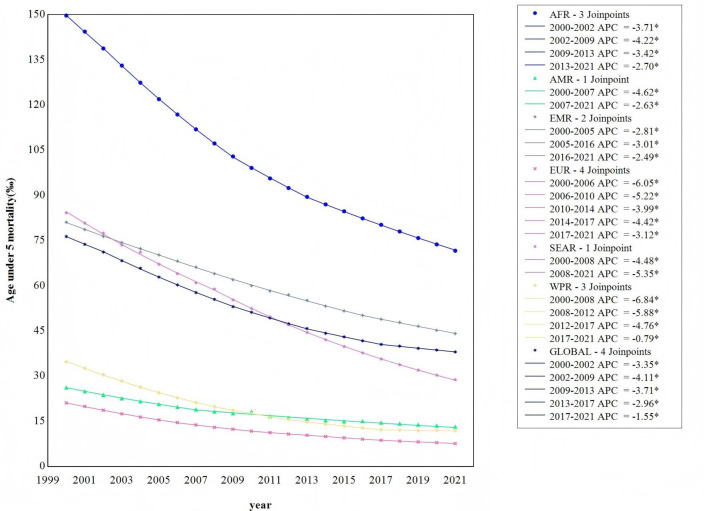 Figure 3
| Hepatitis B vaccine coverage (%) | Hib vaccine coverage (%) | Polio vaccine coverage (%) | Measles vaccine coverage (%) | |||||||||
|---|---|---|---|---|---|---|---|---|---|---|---|---|
| 2000 | 2010 | 2021 | 2000 | 2010 | 2021 | 2000 | 2010 | 2021 | 2000 | 2010 | 2021 | |
| G20 countries | ||||||||||||
| Argentina | – | 94 | 81 | 83 | 94 | 81 | 88 | 95 | 79 | 91 | 95 | 86 |
| Australia | – | 92 | 95 | 90 | 92 | 95 | 90 | 92 | 95 | 91 | 94 | 93 |
| Brazil | 94 | 96 | 68 | 90 | 99 | 68 | 99 | 99 | 68 | 99 | 99 | 73 |
| Canada | – | 56 | 84 | 88 | 90 | 92 | 88 | 90 | 92 | 96 | 90 | 90 |
| China | 60 | 99 | 99 | – | – | – | 86 | 99 | 99 | 84 | 99 | 99 |
| Germany | 84 | 88 | 87 | 94 | 93 | 90 | 94 | 94 | 91 | 92 | 97 | 97 |
| French | 26 | 64 | 95 | 86 | 97 | 96 | 98 | 99 | 96 | 84 | 89 | 94 |
| UK | – | – | 93 | 91 | 94 | 93 | 91 | 94 | 93 | 88 | 89 | 91 |
| Indonesia | 65 | 83 | 67 | – | – | 67 | 72 | 82 | 68 | 76 | 78 | 72 |
| India | – | 38 | 85 | – | – | 85 | 57 | 76 | 85 | 56 | 82 | 89 |
| Italy | 94 | 96 | 94 | 55 | 95 | 94 | 97 | 96 | 94 | 74 | 91 | 94 |
| Japan | – | – | 96 | – | – | 99 | 98 | 98 | 99 | 96 | 94 | 95 |
| Korea | 93 | 94 | 98 | – | – | 98 | 99 | 95 | 98 | 95 | 98 | 98 |
| Mexico | 97 | 93 | 80 | 97 | 95 | 78 | 97 | 95 | 78 | 96 | 95 | 99 |
| Russia | – | 97 | 97 | – | – | – | 97 | 98 | 97 | 97 | 98 | 97 |
| Saudi Arabia | 93 | 98 | 97 | – | 98 | 97 | 95 | 98 | 97 | 94 | 98 | 98 |
| Türkiye | 71 | 96 | 96 | – | 97 | 95 | 85 | 97 | 95 | 87 | 97 | 96 |
| America | 90 | 92 | 92 | 93 | 90 | 91 | 90 | 93 | 93 | 91 | 92 | 92 |
| South Africa | 73 | 71 | 86 | 73 | 72 | 86 | 71 | 72 | 86 | 72 | 72 | 87 |
| Region | ||||||||||||
| Africa | 5 | 70 | 73 | 3 | 60 | 73 | 54 | 72 | 71 | 53 | 72 | 67 |
| Americas | 70 | 90 | 80 | 75 | 91 | 80 | 91 | 93 | 80 | 93 | 93 | 85 |
| Eastern Mediterranean | 36 | 72 | 80 | 1 | 46 | 80 | 72 | 75 | 81 | 70 | 76 | 80 |
| Europe | 43 | 78 | 91 | 38 | 73 | 81 | 94 | 95 | 94 | 91 | 93 | 95 |
| South-East Asia | 10 | 53 | 83 | 0 | 9 | 82 | 64 | 80 | 82 | 63 | 83 | 87 |
| Western Pacific | 49 | 92 | 92 | 1 | 10 | 30 | 86 | 97 | 92 | 85 | 97 | 92 |
| U5MR per 1000 live births | CHE as percentage of GDP (%) | GGHE-D as percentage of CHE (%) | |||||||
|---|---|---|---|---|---|---|---|---|---|
| 2000 | 2010 | 2021 | 2000 | 2010 | 2021 | 2000 | 2010 | 2021 | |
| G20 countries | |||||||||
| Argentina | 19.37 | 14.47 | 9.72 | 8.22 | 9.45 | 9.71 | 54.73 | 58.95 | 63.21 |
| Australia | 6.19 | 4.77 | 3.77 | 7.59 | 8.42 | 10.54 | 71.84 | 72.36 | 76.04 |
| Brazil | 34.63 | 18.63 | 14.28 | 8.33 | 7.95 | 9.89 | 41.64 | 45.02 | 45.54 |
| Canada | 6.23 | 5.73 | 5.02 | 8.25 | 10.68 | 12.33 | 72.85 | 69.88 | 72.92 |
| China | 36.72 | 15.74 | 7.03 | 4.51 | 4.23 | 5.38 | 21.98 | 51.91 | 54.07 |
| Germany | 5.36 | 4.18 | 3.62 | 9.89 | 11.10 | 12.93 | 78.20 | 75.69 | 79.05 |
| French | 5.39 | 4.21 | 4.13 | 9.58 | 11.23 | 12.31 | 72.73 | 70.44 | 75.62 |
| UK | 6.55 | 5.17 | 4.18 | 7.13 | 9.93 | 12.36 | 77.08 | 81.09 | 83.69 |
| Indonesia | 52.05 | 33.68 | 22.01 | 1.85 | 2.79 | 3.71 | 29.67 | 23.69 | 59.41 |
| India | 91.68 | 58.12 | 30.60 | 4.03 | 3.27 | 3.28 | 20.68 | 26.21 | 34.27 |
| Italy | 5.57 | 3.96 | 2.75 | 7.57 | 8.92 | 9.38 | 72.64 | 78.45 | 75.46 |
| Japan | 4.51 | 3.20 | 2.34 | 7.03 | 9.06 | 10.82 | 80.43 | 81.93 | 84.72 |
| Korea | 7.54 | 4.13 | 2.89 | 3.86 | 5.82 | 9.33 | 50.61 | 58.40 | 61.00 |
| Mexico | 28.16 | 19.15 | 13.28 | 4.45 | 5.74 | 6.08 | 45.22 | 50.22 | 50.10 |
| Russia | 19.37 | 10.41 | 5.05 | 5.02 | 4.97 | 7.39 | 59.36 | 61.38 | 71.17 |
| Saudi Arabia | 22.07 | 12.24 | 6.69 | 4.21 | 3.65 | 5.97 | 72.05 | 61.93 | 76.98 |
| Türkiye | 37.59 | 17.91 | 10.06 | 4.60 | 5.02 | 4.57 | 61.68 | 78.00 | 78.80 |
| America | 8.45 | 7.34 | 6.33 | 12.49 | 16.20 | 17.36 | 44.38 | 48.85 | 55.40 |
| South Africa | 71.02 | 51.64 | 34.70 | 7.34 | 7.79 | 8.27 | 36.59 | 51.33 | 60.38 |
| Region | |||||||||
| Africa | 149.75 | 99.16 | 71.67 | 4.37 | 5.31 | 5.76 | 33.52 | 30.90 | 34.41 |
| Americas | 26.24 | 18.26 | 13.25 | 5.76 | 6.67 | 7.81 | 49.33 | 51.74 | 58.21 |
| Eastern Mediterranean | 81.14 | 60.06 | 44.17 | 4.30 | 4.50 | 6.16 | 49.85 | 51.49 | 50.98 |
| Europe | 21.13 | 11.77 | 7.65 | 6.40 | 7.69 | 8.70 | 63.39 | 64.55 | 67.45 |
| South-East Asia | 84.26 | 52.48 | 28.85 | 3.58 | 4.03 | 5.49 | 36.53 | 38.85 | 47.19 |
| Western Pacific | 34.80 | 17.60 | 11.92 | 6.60 | 6.95 | 8.19 | 65.53 | 57.92 | 58.25 |
- —Qilu Health Outstanding Young Talents Project, Shandong Provincial Natural Science Foundation
- —Chinese Medicine Science and Technology Project of Shandong Province
- —http://dx.doi.org/10.13039/100000865Bill and Melinda Gates Foundation
- —Child Health and Nutrition Program Phase 2
Peer Reviews
No public reviews on file for this paper yet. If you reviewed it on a platform where reviews are public (OpenReview, ICLR, NeurIPS, ICML), you can paste yours below so the community can read it here.
Videos
No videos yet. Explain this paper in a talk, walkthrough, or lecture? Add one.
Taxonomy
TopicsImmune responses and vaccinations · Vaccine Coverage and Hesitancy · SARS-CoV-2 and COVID-19 Research
Introduction
In recent years, substantial advancements have been made globally in improving child health. Notably, between 2000 and 2015, Millennium Development Goal 4 (MDG 4) explicitly set an ambitious objective to decrease under-5 mortality rate (U5MR) by two-thirds compared with the 1990 level.1 From 2000 to 2013, the annual number of under-5 deaths declined from 12.7 million to 6.3 million. Concurrently, the U5MR dropped by 49%, from 90 to 46 per 1000 live births. This period marked an unprecedented acceleration in the reduction of child mortality, with 58 countries successfully attaining the MDG 4 target.1 2
The challenge of improving global child health remains, as evidenced by the current global U5MR of 36.7 per 1000 live births, which is still significantly above the target established by the Sustainable Development Goals (SDGs). The SDGs call for a reduction in U5MR to a maximum of 25 deaths per 1000 live births worldwide by 2030.3 Of the 200 countries and regions analysed, 146 have achieved or are on track to achieve the specific SDGs target for reducing U5MR. Despite this progress, numerous countries continue to face substantial challenges in this regard.
The increasing investment in health resources during the MDG 4 period is widely considered a significant role in reducing U5MR. A global comparative analysis found that health expenditure can reduce U5MR, especially in low-income countries.4 Another study in Africa found that countries with increased vaccine immunisation have achieved greater reductions in U5MR.5 The impact of vaccination is substantial at a global scale, being estimated to prevent 21.7% of deaths in children under 5 years old.6 The case of polio illustrates this point: studies in Guinea-Bissau and Bangladesh showed that oral polio vaccine was associated with a reduction in child mortality by 19%–31%.7 8
To achieve SDGs, it is imperative to understand how the effect of health resource investments on U5MR has changed from 2000 to 2021, particularly the role of vaccination. Therefore, this study aims to analyse the 22-year trends in U5MR from 2000 to 2021 and to quantify the influence of health resource investments, especially vaccination.
Methods
Data sources
The data for this study were sourced from the WHO Global Health Observatory (https://www.who.int/data/gho, accessed on 12 September 2024) (dataset).9 The primary assessment variables, spanning the period from 2000 to 2021, cover 200 countries and regions and six major geographical regions. We analysed U5MR, defined as the number of deaths of children under 5 years old per 1000 live births, in relation to various health resource indicators. The health resources indicators included in the analysis were hepatitis B immunisation coverage among 1-year-olds (HepB3, %), neonates protected at birth against neonatal tetanus (PAB, %), Haemophilus influenzae type b immunisation coverage among 1-year-olds (Hib3, %), BCG immunisation coverage among 1-year-olds (BCG, %), polio immunisation coverage among 1-year-olds (Pol3, %), measles-containing-vaccine first-dose immunisation coverage among 1-year-olds (MCV1, %), domestic general government health expenditure as percentage of general government expenditure (GGE) (GGHE-D,%), current health expenditure (CHE) per capita in US, EXT as percentage of CHE (%), GGHE-D per capita in US$, GGHE-D as percentage of CHE (%) and GGHE-D as percentage of GDP (%).
Statistical analyses
The descriptive analysis was conducted to summarise the U5MR, immunisation coverage for six vaccines, CHE as a percentage of GDP, and GGHE-D as a percentage of CHE at the global level, across six major regions, and among the G20 countries. The long-term trends in U5MR were assessed using the best-fitting segmented Joinpoint continuous log-linear model, with the annual average percentage change (AAPC) calculated.
Countries with severe missing data were excluded from subsequent analyses. The Hausman test was employed to guide the choice between using the fixed effect model or the random effect model. Additionally, the joint significance test was used to determine the inclusion of time fixed effect. A two-way fixed effects model with cluster-robust standard errors, clustered by country, was employed to examine the relationships between U5MR and key health resource indicators, including vaccine immunisation coverage and health expenditures. These analyses were conducted for 139 countries globally and for G20 countries specifically, spanning the period from 2000 to 2021. The contribution of each variable to the model was assessed using dominance analysis, which estimates the relative importance of independent variables. The variables with a variance inflation factor >10 were excluded by the multi-collinearity test. The independent variables included coverage rates for HeB3, Hib3, Pol3, GGHE-D as percentage of GGE, CHE per capita in $, CHE as percentage of GDP and GGHE-D as percentage of CHE. Statistical analysis was performed using Stata V.18.0, ArcMap V.10.8 and Joinpoint V.5.0. A p value of <0.05 (two-tailed) was considered statistically significant.
Results
Tables12 summarise the descriptive statistics for U5MR and health resources in G20 countries and six major regions at three time points: 2000, 2010 and 2021. U5MR in both G20 countries and the six major regions was significantly lower in 2021 compared with 2000 and 2010, reflecting a notable decline since 2000. The immunisation coverage for polio maintained an overall upward trend, with the exception of a few countries and the Americas. Both the proportion of CHE relative to GDP and the share of GGHE in total health expenditure increased relative to previous years. These trends are further depicted in figure 1.
Trends in the mortality rate of children under 5 years, the immunisation coverage rate of vaccine and health spending from 2000 to 2021. CHE, current health expenditure; GDP, gross domestic product; GGHE-D, domestic general government health expenditure.
Figure 2 presents the changes in U5MR across 200 countries and regions in 2000, 2010 and 2021. U5MR has shown a rapid decline globally, with the most notable reductions observed in Africa. However, U5MR remains high in certain regions of Africa, South Asia and South-East Asia.
Maps of global age under-5 mortality rate for 200 countries and regions. AAPC, annual average percentage change; U5MR, under-5 mortality rate.
Figure 1 presents a line chart illustrating the trends in U5MR, vaccination coverage and health expenditures across 200 countries and regions, categorised by region. As shown in figure 1B–G, the immunisation coverage for the six vaccines demonstrates a significant upward trend (p<0.05).
Figure 1A illustrates a decline in U5MR globally, across six major regions, and in G20 countries (AAPC: −5.188 to −2.749, p<0.05), although the rate of decline has decelerated over time. U5MR still remains notably high in the African, Eastern Mediterranean and Southeast Asian regions, with Africa and the Eastern Mediterranean exhibiting rates above the global average.
Figure 1B demonstrates an increase in hepatitis B vaccination coverage (AAPC: 0.1748 to 18.0608, p<0.05), although coverage in Africa, the Eastern Mediterranean and the Americas remains below the global average.
Figure 1C illustrates an increase in tetanus vaccine coverage (AAPC: 0.2504 to 4.1797, p<0.05), though coverage in Africa and the Eastern Mediterranean continues to lag behind the global average.
Figure 1D depicts an increase in Hib vaccine coverage (AAPC: 0.0239 to 29.0832, p<0.05), with the Western Pacific region showing substantially lower coverage compared with the global average.
Figure 1E illustrates an increase in BCG vaccination coverage in Africa and the Western Pacific (AAPC: 0.1103 to 1.3561, p<0.05), while a decline is observed in the Americas (AAPC: −1.1091 to −0.2174, p<0.05), where coverage has rapidly decreased in recent years. Currently, vaccination coverage in both Africa and the Americas remains below the global average.
Figure 1F presents an increase in polio vaccination coverage in Africa, the Eastern Mediterranean, Southeast Asia and the Western Pacific (AAPC: 0.0298 to 1.8576, p<0.05), whereas coverage is declining in the Americas (AAPC: −0.8071 to −0.3318, p<0.05). Polio vaccination coverage remains relatively low in Africa, the Eastern Mediterranean and Southeast Asia, with Africa and the Americas showing coverage rates below the global average.
Figure 1G highlights an increase in measles vaccination coverage (AAPC: 0.0317 to 2.1917, p<0.05), with a declining trend in the Americas (AAPC: −0.6277 to −0.2845, p<0.005). Coverage remains below the global average in Africa and the Eastern Mediterranean.
Figure 1H demonstrates an upward trend in the proportion of CHE as a share of GDP in Africa, the Americas, Europe, South-East Asia, globally, and in G20 countries (AAPC: 0.6642 to 3.3489, p<0.05). However, CHE as a percentage of GDP remains consistently lower in Africa, the Eastern Mediterranean and South-East Asia compared with the global average. Figure 1I highlights an increasing trend in GGHE as a percentage of CHE (GGHE-D/CHE) in the Americas, Eastern Mediterranean, Europe, South-East Asia, globally and G20 countries (AAPC: 0.0098 to 1.9016, p<0.05). In contrast, the Western Pacific region exhibits a declining trend (AAPC: −0.9077 to −0.0674, p<0.05). Africa, the Eastern Mediterranean and South-East Asia continue to fall below the global average, with Africa showing a particularly pronounced lag.
As illustrated in figure 3, the Joinpoint regression model results show a significant decline in U5MR both globally and across the regions of Africa, the Americas, the Eastern Mediterranean, Europe, South-East Asia and the Western Pacific (p<0.001). The global decline in U5MR is segmented into five phases, with Africa showing four phases, the Americas two phases, the Eastern Mediterranean three phases, Europe five phases, South-East Asia two phases and the Western Pacific five phases. The AAPC values for all regions are negative, indicating a consistent decline in U5MR from 2000 to 2021. Notably, the Eastern Mediterranean region shows the slowest rate of decline in U5MR. This is evidenced by the following AAPC values: −3.259% (95% CI −3.396% to −3.121%) globally, −3.438% (95% CI −3.461% to −3.415%) in Africa, −3.294% (95% CI −3.570% to −3.016%) in the Americas, −2.841% (95% CI −2.932% to −2.749%) in the Eastern Mediterranean, −4.715% (95% CI −4.902% to −4.528%) in Europe, −5.019% (95% CI −5.075% to −4.963%) in South-East Asia and −5.033% (95% CI −5.188% to −4.878%) in the Western Pacific region.
Temporal trend of age under-5 mortality rate described by Joinpoint model from 2000 to 2021. AFR, African region; AMR, region of the America; APC, annual average percentage; EMR, Eastern Mediterranean region; EUR, European region; SEAR, South-East Asia region; WPR, Western Pacific region.
The R^2^ values for global vaccine immunisation coverage and health expenditure within the model were 0.1520 and 0.0571, respectively. Dominance analysis reveals that their respective contributions to the model’s R^2^ are 27.08% and 10.18%, with vaccines and health expenditure accounting for 72.69% and 27.31% of total health resources, respectively. In G20 countries, the R^2^ values for vaccine immunisation coverage and health expenditure were 0.1167 and 0.3725, respectively, and their contributions to the model’s R^2^ were 15.50% and 49.51%, with vaccines and health expenditure accounting for 23.86% and 76.14% of total health resources, respectively. The analysis reveals a statistically significant negative correlation between global pol3 coverage and U5MR (β=−0.489, p<0.05), as well as between CHE as a percentage of GDP and U5MR (β=−0.762, p<0.05). A positive correlation was observed between CHE per capita in and U5MR (β=0.003, p<0.05) (detailed data are provided in online supplemental table 1).
Discussion
Our study found that U5MR has been declining continuously from 2000 to 2021 globally and across 200 countries and regions. In the G20 countries, vaccine immunisation coverage and health expenditure accounted for 65.01% of the observed reduction in U5MR, with vaccines contributing 23.86% of the health resources that contributed to this reduction. At the global level, health resources contributed 37.26% to the reduction of U5MR, with vaccines representing 72.69% of the health resources within this contribution. Since 2000, the global U5MR has decreased by 50%, corresponding to an average annual percentage change of −3.259%. Previous research indicated that this decline since 2000 was associated with global investments and targeted interventions.10 11 Increasing investment in health resources can significantly decrease U5MR. Therefore, it is imperative for countries and the international community to sustain and expand their efforts in delivering fundamental interventions around the dual pillars of vaccine access and health expenditure.
Our study also found that higher levels of health expenditure contribute to the reduction of U5MR. This is consistent with the findings of Moreno-Serra and Smith.12 A 1% decrease in government health expenditure is associated with a significant increase in U5MR (R=0.5207, p<0.0001, 95% CI 0.3168 to 0.7247).13 Similarly, in European Union countries, a decrease in health expenditure as a percentage of GDP is significantly associated with an increase in U5MR (R=−0.5624, p=0.0000, 95% CI −0.7159 to −0.4089).14 In G20 countries, we found that GGHE-D as a percentage of CHE is negatively correlated with U5MR and accounted for 31.48% of the reduction in U5MR. Additionally, an increase in U5MR stimulates increased investments in health resources. Our study found a positive correlation between CHE per capita in $ and U5MR in both global level and G20 countries. This result is consistent with a previous study in West African countries.15 One explanation could be that rising U5MR may prompt a reactive increase in per capita health expenditure. Furthermore, inequities in service supply, potentially influenced by the mix of public and private healthcare delivery models, may also contribute to this positive relationship between health spending and U5MR. It may also be related to the inefficiency in the allocation of resources and governance issues such as corruption within health systems.16
The implementation and expansion of vaccination interventions are associated with reductions in U5MR. Our analysis identified a negative correlation between polio vaccination coverage and U5MR, accounting for 6.45% of global reduction in U5MR. Currently, childhood immunisation is fundamental to the eradication of polio, and increasing polio vaccination coverage is crucial for ensuring global polio eradication.1719 Similar findings from several African and South Asian countries have shown that higher polio vaccination coverage is effective in eradicating polio.78 2023
Vaccination is a critical factor in reducing U5MR. Dominance analysis revealed that vaccination accounts for 72.69% of health resources investments in reducing global U5MR. These findings underscore its core position in improving child survival. In G20 countries, vaccination contributes 23.86% of health resources investments. Although this contribution percentage is lower than the global level, it still demonstrates the significant value of vaccination in both developed and developing nations. Our findings indicated that vaccination remains an indispensable factor for child health, even in countries with more abundant healthcare resources.
External uncertainties, such as wars and conflicts, exacerbate the risk of death for children under 5 years of age. The global childhood vaccination coverage has decreased, thereby increasing the susceptibility of millions of children to vaccine-preventable diseases.2426 We particularly note that global polio vaccination coverage declined since the onset of the COVID-19 pandemic in 2019.27 28 This decline has been especially pronounced in certain countries within the Americas, Africa and the Eastern Mediterranean region in recent years.2931 Vaccination hesitancy may significantly contribute to the plateau or even decline in vaccination coverage. Furthermore, the effects of conflicts and wars on children warrant significant attention. The Eastern Mediterranean region, which is plagued by frequent wars, exhibits the slowest reduction in U5MR. Providing vaccines and immunisations for children remains a major challenge in eradicating polio.3235 Wars and conflicts often lead to the collapse of local healthcare systems, preventing the provision of basic medical services, which significantly worsens health conditions and greatly increases the risk of child mortality.3639
Conclusion
From 2000 to 2021, U5MR declined globally, although the rate of decline decelerated over time. Overall, vaccine immunisation coverage exhibited an upward trend. Global health resources accounted for 37.26% to the reduction of U5MR, with vaccination contributing 72.69% of the impact attributed to health resources. In G20 countries, health resources accounted for a greater share (65.01%) of the reduction, with vaccination contributing 23.86%. Increasing investments in vaccine immunisation coverage and health expenditure are critical to further reduce U5MR.
Supplementary material
10.1136/bmjopen-2025-102980online supplemental file 1
The reference list from the paper itself. Each links out to its DOI / PubMed record.
- 1United Nations Millennium Development Goal 4Availablehttps://www.who.int/zh/news-room/fact-sheets/detail/millennium-development-goals-(mdgs)
- 2Paulson KR Kamath AM Alam T et al Global, regional, and national progress towards Sustainable Development Goal 3.2 for neonatal and child health: all-cause and cause-specific mortality findings from the Global Burden of Disease Study 2019 Lancet 202139887090510.1016/S 0140-6736(21)01207-134416195 PMC 8429803 · doi ↗ · pubmed ↗
- 3United Nations Sustainable Development Goals Availablehttps://www.un.org/sustainabledevelopment/health/
- 4Rana RH Alam K Gow J Health expenditure, child and maternal mortality nexus: a comparative global analysis BMC Int Health Hum Rights 2018182910.1186/s 12914-018-0167-130012137 PMC 6048901 · doi ↗ · pubmed ↗
- 5Mouteyica AEN Ngepah N Health outcome convergence in Africa: the roles of immunization and public health spending Health Econ Rev 2023133010.1186/s 13561-023-00436-937162604 PMC 10170806 · doi ↗ · pubmed ↗
- 6Perin J Mulick A Yeung D et al Global, regional, and national causes of under-5 mortality in 2000-19: an updated systematic analysis with implications for the Sustainable Development Goals Lancet Child Adolesc Health 202261061510.1016/S 2352-4642(21)00311-434800370 PMC 8786667 · doi ↗ · pubmed ↗
- 7Andersen A Fisker AB Rodrigues A et al National Immunization Campaigns with Oral Polio Vaccine Reduce All-Cause Mortality: A Natural Experiment within Seven Randomized Trials Front Public Health 201861310.3389/fpubh.2018.0001329456992 PMC 5801299 · doi ↗ · pubmed ↗
- 8Nielsen S Khalek MA Benn CS et al National immunisation campaigns with oral polio vaccine may reduce all-cause mortality: Analysis of 2004-2019 demographic surveillance data in rural Bangladesh E Clinical Medicine 20213610088610.1016/j.eclinm.2021.10088634041458 PMC 8144662 · doi ↗ · pubmed ↗