Vegan Diet, Greenhouse Gas Emissions, and Cumulative Energy Demand: A Secondary Analysis of a Randomized Clinical Trial
Hana Kahleova, Arathi Jayaraman, Brighid McKay, Laura Chiavaroli, Songhee Back, Ilana Fischer, Reagan Smith, Richard Holubkov, Neal D. Barnard

TL;DR
This study explores how switching to a low-fat vegan diet affects greenhouse gas emissions and energy use.
Contribution
The study provides new insights into the environmental impact of a low-fat vegan diet using clinical trial data.
Findings
Adopting a low-fat vegan diet reduces greenhouse gas emissions.
The diet also lowers cumulative energy demand.
Abstract
This secondary analysis of a randomized clinical trial examined the environmental effect of adopting a low-fat vegan diet on greenhouse gas emissions and cumulative energy demand.
Genes, proteins, chemicals, diseases, species, mutations and cell lines named across the full text — each resolved to its canonical identifier and authoritative record.
Click any figure to enlarge with its caption.
 Figure
| Food groups | Group, mean daily intakes (95% CI) | Effect size | ||||||
|---|---|---|---|---|---|---|---|---|
| Control | Vegan | |||||||
| Week 0 | Week 16 | Change | Week 0 | Week 16 | Change | |||
|
| ||||||||
| Total | 2540.5 (2262.3 to 2818.6) | 2226.5 (2000.9 to 2452.0) | −314.0 (−596.0 to −32.0) | 2337.0 (2159.5 to 2514.4) | 1023.9 (945.9 to 1102.0) | −1313.0 (−1486.6 to −1139.4) | −999.0 (−1328.7 to −669.4) | <.001 |
| Meat | 939.5 (758.9 to 1120.1) | 864.7 (695.4 to 1034.0) | −74.8 (−263.9 to 114.2) | 803.7 (662.2 to 945.1) | 4.0 (0 to 7.9) | −799.7 (−941.3 to −658.1) | −724.9 (−959.9 to −489.9) | <.001 |
| Dairy products | 486.3 (346.4 to 626.2) | 404.6 (325.5 to 483.7) | −81.7 (−224.2 to 60.7) | 454.1 (372.4 to 535.7) | 6.0 (1.7 to 10.2) | −448.1 (−530.3 to −365.9) | −366.4 (−530.2 to −202.6) | <.001 |
| Eggs | 106.4 (79.9 to 132.8) | 100.8 (75.5 to 126.1) | −5.5 (−32.9 to 21.8) | 107.4 (84.1 to 130.8) | 0.5 (−0.1 to 1.0) | −107.0 (−130.3 to −83.7) | −101.4 (−136.9 to −65.9) | <.001 |
| Added fats | 65.6 (51.7 to 79.5) | 69.4 (52.6 to 86.2) | 3.8 (−12.8 to 20.5) | 61.3 (50.4 to 72.1) | 17.1 (12.9 to 21.2) | −44.2 (−55.7 to −32.7) | −48.0 (−68.2 to −27.9) | <.001 |
| Nuts and seeds | 33.9 (24.8 to 42.9) | 28.5 (22.0 to 34.9) | −5.4 (−15.6 to 4.7) | 29.1 (20.8 to 37.4) | 8.8 (6.4 to 11.2) | −20.3 (−28.9 to −11.7) | −14.9 (−28.0 to −1.7) | .03 |
| Grains | 183.9 (161.7 to 206.1) | 122.0 (106.7 to 137.3) | −61.9 (−85.6 to −38.2) | 207.4 (184.3 to 230.5) | 177.5 (160.1 to 195.0) | −29.9 (−57.7 to −2) | 32.1 (−4.3 to 68.4) | .08 |
| Fruit | 99.4 (79.0 to 119.8) | 96.3 (77.0 to 115.6) | −3.1 (−27.9 to 21.7) | 101.2 (82.5 to 119.8) | 139 (122.0 to 156.1) | 37.8 (16.5 to 59.2) | 40.9 (8.6 to 73.3) | .01 |
| Legumes | 27.2 (19.7 to 34.7) | 23.2 (16.5 to 29.9) | −4.0 (−11.6 to 3.6) | 25.8 (19.2 to 32.5) | 71.8 (57.7 to 86.0) | 46.0 (31.6 to 60.4) | 50.0 (33.8 to 66.2) | <.001 |
| Vegetables | 164.8 (146.3 to 183.3) | 158.0 (141.4 to 174.6) | −6.8 (−29.2 to 15.6) | 161.8 (144.5 to 179.2) | 228.3 (204.4 to 252.3) | 66.5 (40.2 to 92.8) | 73.3 (39.0 to 107.7) | <.001 |
|
| ||||||||
| Total | 16 473.6 (14 901.9 to 18 045.3) | 15 047.0 (13 656.7 to 16 437.3) | −1426.6 (−2995.7 to 142.5) | 15 976.1 (14 765.6 to 17 186.7) | 7782.3 (7010.3 to 8554.3) | −8193.8 (−9369.3 to −7018.4) | −6767.2 (−8717.5 to −4816.9) | <.001 |
| Meat | 5511.3 (4531.7 to 6490.8) | 5388.5 (4390.3 to 6386.6) | −122.8 (−1256 to 1010.4) | 5370.1 (4550.4 to 6189.8) | 84.0 (−23.6 to 191.7) | −5286.1 (−6115.6 to −4456.5) | −5163.3 (−6560.5 to −3766.1) | <.001 |
| Eggs | 640.3 (481.0 to 799.6) | 607.0 (454.8 to 759.2) | −33.3 (−198.2 to 131.5) | 646.8 (506.2 to 787.4) | 2.9 (−0.3 to 6.1) | −644.0 (−784.2 to −503.7) | −610.6 (−824.5 to −396.8) | <.001 |
| Dairy products | 2260.8 (1861.4 to 2660.2) | 2087.5 (1701.8 to 2473.2) | −173.3 (−615.7 to 269.1) | 2346.9 (1966.3 to 2727.4) | 32.4 (9.0 to 55.8) | −2314.5 (−2698.1 to −1930.9) | −366.4 (−530.2 to −202.6) | <.001 |
| Added fats | 366.8 (293.8 to 439.8) | 384.5 (299.5 to 469.6) | 17.7 (−68.3 to 103.7) | 336.1 (280.1 to 392.1) | 101.3 (75.5 to 127.1) | −234.8 (−295.7 to −173.9) | −252.5 (−357.4 to −147.6) | <.001 |
| Nuts and seeds | 193.5 (143.1 to 243.9) | 165.5 (125.1 to 205.9) | −28.0 (−83.5 to 27.6) | 164.4 (115.3 to 213.4) | 44.3 (31.2 to 57.3) | −120.1 (−170.8 to −69.5) | −92.2 (−166.8 to −17.5) | .02 |
| Grains | 1130.2 (993.1 to 1267.4) | 740.3 (649.8 to 830.8) | −390.0 (−535.1 to −244.8) | 1276.2 (1132.5 to 1419.8) | 1045.7 (945.3 to 1146.1) | −230.5 (−400.7 to −60.3) | 159.5 (−63.0 to 381.9) | .16 |
| Legumes | 136.7 (99.1 to 174.3) | 116.7 (83.1 to 150.2) | −20.1 (−58.2 to 18.1) | 129.8 (96.4 to 163.2) | 361.0 (289.8 to 432.1) | 231.2 (159.0 to 303.4) | 251.2 (169.9 to 332.6) | <.001 |
| Fruit | 805.3 (648.7 to 962) | 779.6 (629.2 to 930.1) | −25.7 (−211.8 to 160.4) | 804.6 (668.4 to 940.8) | 1082.2 (952.6 to 1211.8) | 277.6 (120.3 to 434.9) | 303.3 (62.7 to 544.0) | .01 |
| Vegetables | 1159.8 (1028.4 to 1291.2) | 1100.5 (985.5 to 1215.4) | −59.3 (−218.4 to 99.7) | 1133.9 (1013.3 to 1254.5) | 1598.8 (1432.1 to 1765.4) | 464.9 (285.0 to 644.8) | 524.2 (285.5 to 763.0) | <.001 |
Peer Reviews
No public reviews on file for this paper yet. If you reviewed it on a platform where reviews are public (OpenReview, ICLR, NeurIPS, ICML), you can paste yours below so the community can read it here.
Videos
No videos yet. Explain this paper in a talk, walkthrough, or lecture? Add one.
Taxonomy
TopicsAgriculture Sustainability and Environmental Impact · Diet and metabolism studies · Bioeconomy and Sustainability Development
Introduction
Dietary changes can reduce the environmental footprint,^1^ in addition to improving health measures.^2^ This secondary analysis of a randomized clinical trial assessed the environmental effect of adopting a low-fat vegan diet, hypothesizing that greenhouse gas emissions (GHGE) and cumulative energy demand (CED), which estimates total energy used to produce, process, package, transport, store, and dispose of the waste of food, would be reduced.
Methods
This study was conducted between January 2017 and February 2019 in Washington, DC, and the study methods have been previously described (trial protocol in Supplement 1).^2^ This ad hoc secondary analysis is reported in accordance with the CONSORT guideline. The protocol was approved by the Chesapeake Institutional Review Board. All participants provided written informed consent.
Participants were randomly assigned to a vegan or control group in a 1:1 ratio (eFigure in Supplement 2). The vegan group was asked to follow an ad libitum low-fat vegan diet consisting of fruits, vegetables, grains, and legumes, while the control group was requested to make no diet changes. At baseline and week 16, a 3-day dietary record was completed by each participant and analyzed by a registered dietitian certified in the Nutrition Data System for Research.^3^
Intakes from dietary records were linked to the US Department of Agriculture Food Commodity Intake Database^4^ and the database of Food Impacts on the Environment for Linking to Diets^5^ by 3 independent reviewers (A.J., B.M., and S.B.) who were blinded to group assignment. Linking accuracy was verified by a senior researcher (L.C.), who was also blinded to group assignment. A repeated measure analysis of variance was used by a statistician blinded to dietary interventions. All results are presented as means with 95% CIs. SAS version 9.4 (SAS Institute) was used to conduct analyses, and statistical significance was set at P < .05. Data were analyzed from June to July 2025.
Results
Of 3115 people screened by telephone, 244 overweight adults (211 women [86.5%] and 33 men [13.5%], mean [SD] age, 54.8 [11.7] years) met participation criteria and were randomly assigned to the vegan (122 [50.0%]) or control (122 [50.0%]) group. The analysis included 223 individuals who completed the study (117 vegan [52.5%] and 106 control [47.5%] group).
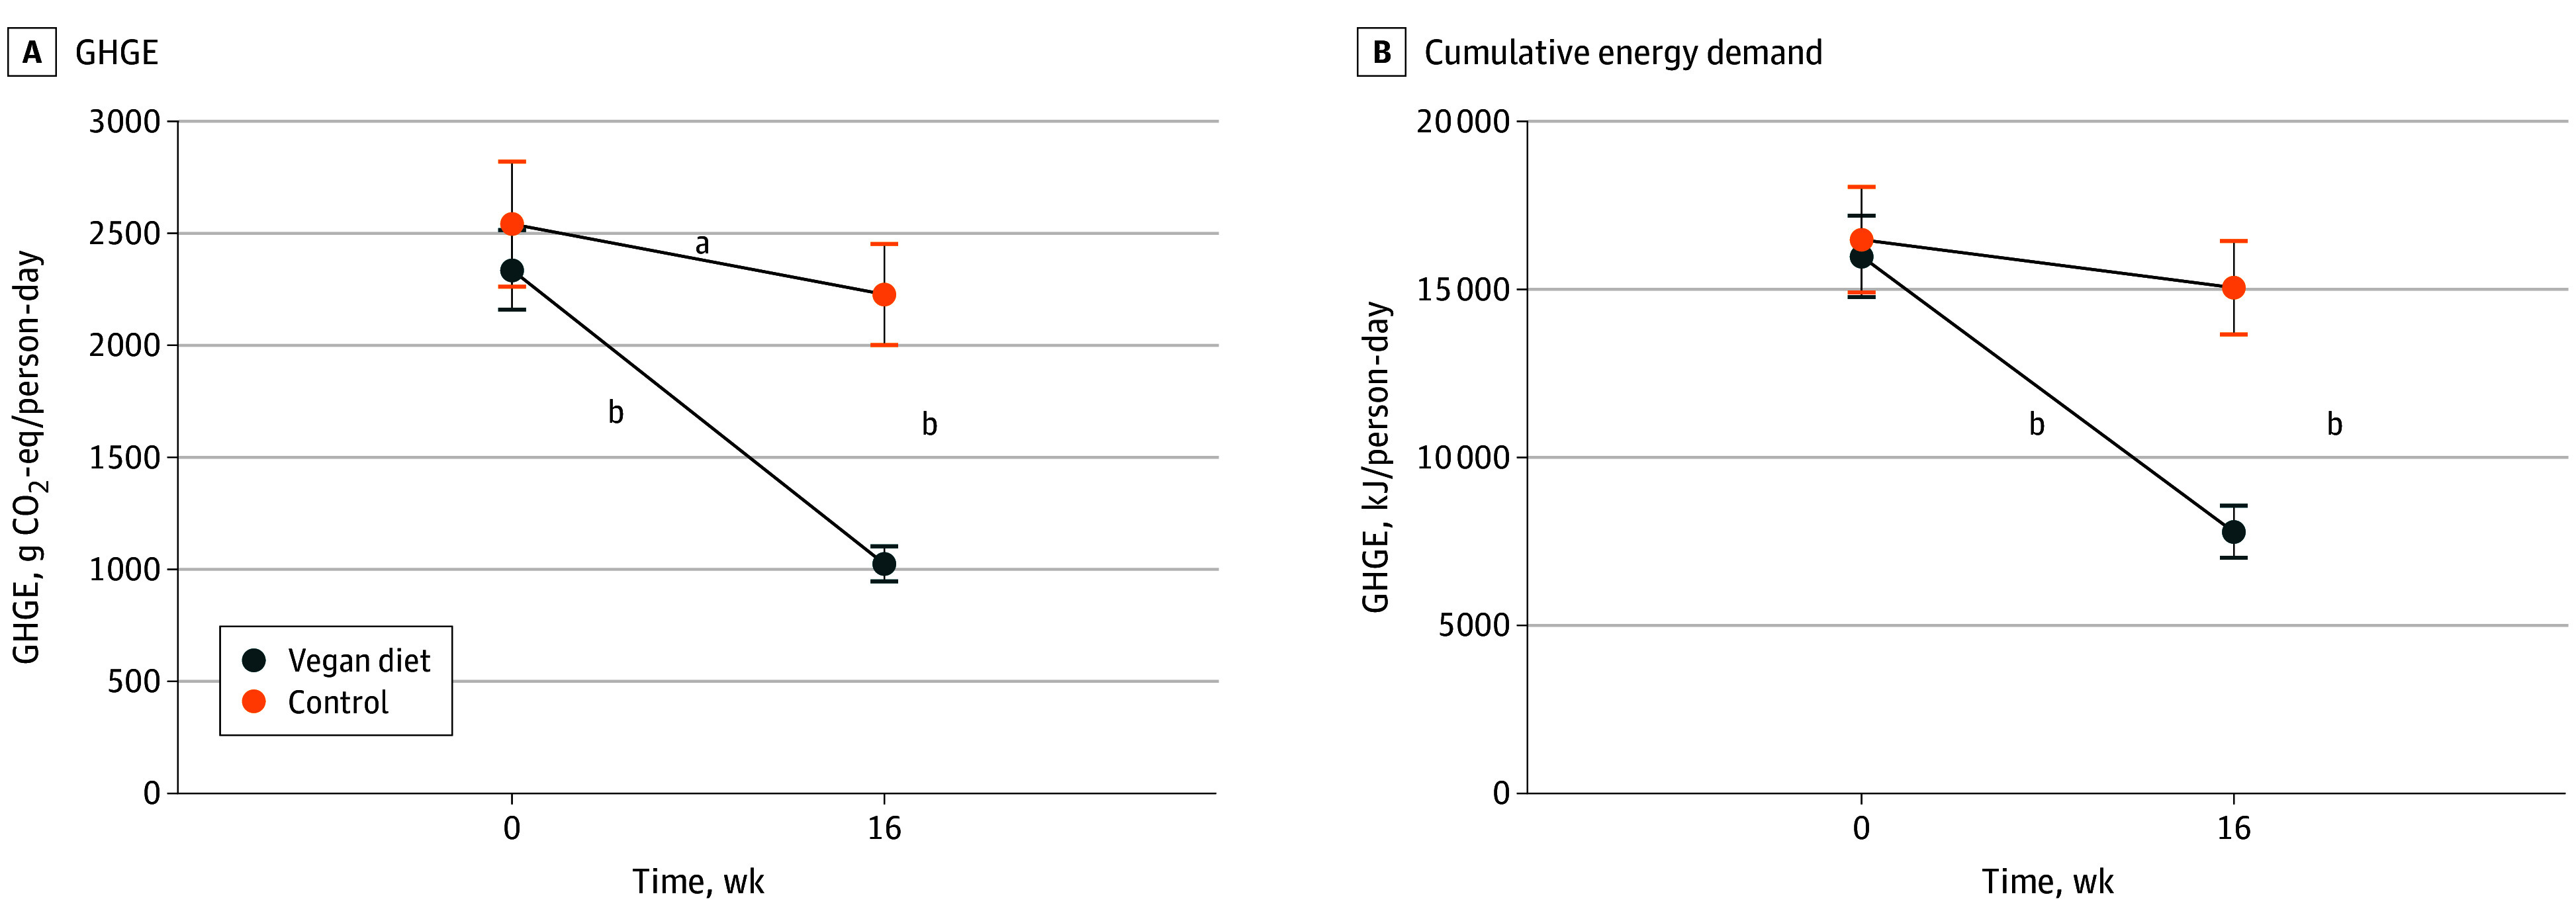
The vegan group had an associated decrease in GHGE by 1313 (95% CI, −1486.6 to −1139.4) g carbon dioxide equivalent GHGE (CO_2_-eq) per person-day (P < .001), compared with a reduction by 314 (95% CI, −596.0 to −32.0) g CO_2_-eq per person-day in the control group (effect size, −999 [95% CI −1329 to −669] g CO_2_-eq/person-day; P < .001) (Figure and Table). This associated decrease in the vegan group was mainly attributable to reduced meat consumption, followed by reduced dairy consumption. The vegan group had an associated decrease in CED by 8193.8 (95% CI, −9369.3 to −7018.4) kJ per person-day (P < .001), compared with no change in the control group (effect size, −6767 [95% CI −8718 to −4817] kJ/person-day; P < .001) (Figure and Table). Again, most of the reduction was attributable to reduced meat intake, followed by reduced egg consumption.
Changes in Total Greenhouse Gas Emissions (GHGE) and Cumulative Energy Demand in the Vegan and Control Groups From Baseline to Week 16The data are shown as means with 95% CIs. CO2 indicates carbon dioxide.aP < .05.bP < .001.
Discussion
The EAT-Lancet Commission demonstrated that animal foods, particularly red meat, have an outsized impact on GHGE and energy use, compared with grains, legumes, fruits and vegetables.^6^ A systematic review of 14 different dietary patterns showed that a vegan diet was associated with the largest reduction of GHGE.^1^
The strengths of the current study include a randomized, parallel design, which accounted for seasonal impacts. The study also has limitations. Food consumption was based on self-reported diet records. The participants were research volunteers and may not represent the general population. In this randomized study, adopting a low-fat vegan diet was associated with a significant reduction in GHGE and CED, important drivers of climate change.
The reference list from the paper itself. Each links out to its DOI / PubMed record.
- 1Aleksandrowicz L, Green R, Joy EJM, Smith P, Haines A. The impacts of dietary change on greenhouse gas emissions, land use, water use, and health: a systematic review. P Lo S One. 2016;11(11):e 0165797. doi:10.1371/journal.pone.016579727812156 PMC 5094759 · doi ↗ · pubmed ↗
- 2Kahleova H, Petersen KF, Shulman GI, . Effect of a low-fat vegan diet on body weight, insulin sensitivity, postprandial metabolism, and intramyocellular and hepatocellular lipid levels in overweight adults: a randomized clinical trial. JAMA Netw Open. 2020;3(11):e 2025454. doi:10.1001/jamanetworkopen.2020.2545433252690 PMC 7705596 · doi ↗ · pubmed ↗
- 3Schakel SF, Sievert YA, Buzzard IM. Sources of data for developing and maintaining a nutrient database. J Am Diet Assoc. 1988;88(10):1268-1271. doi:10.1016/S 0002-8223(21)07997-93171020 · doi ↗ · pubmed ↗
- 4Food Commodity Intake Database (FCID). US Department of Agriculture Agriculture Research Service. Accessed October 16, 2025. https://www.ars.usda.gov/northeast-area/beltsville-md-bhnrc/beltsville-human-nutrition-research-center/food-surveys-research-group/docs/food-commodity-intake-database-fcid/
- 5data FIELD. University of Michigan Center for Sustainable Systems. Accessed September 5, 2025. https://css.umich.edu/page/datafield
- 6Willett W, Rockström J, Loken B, . Food in the anthropocene: the EAT-Lancet commission on healthy diets from sustainable food systems. Lancet. 2019;393(10170):447-492. doi:10.1016/S 0140-6736(18)31788-430660336 · doi ↗ · pubmed ↗