Sodium-glucose transport protein 2 inhibitor use in diabetes and its association with tuberculosis incidence
Chia-Jung Liu, Kuang-Ming Liao, Chung-Han Ho, Chin-Chung Shu

TL;DR
This study finds that diabetes patients using SGLT2 inhibitors have a lower risk of developing tuberculosis compared to those who do not use these drugs.
Contribution
The study provides novel evidence linking SGLT2 inhibitor use to reduced tuberculosis risk in diabetes patients.
Findings
SGLT2i users had a 0.43 adjusted hazard ratio for TB compared to non-users.
A dose-response relationship was observed, with higher drug doses associated with lower TB risk.
Sensitivity analyses confirmed the robustness of the protective effect of SGLT2i against TB.
Abstract
Sodium-glucose cotransporter 2 inhibitors (SGLT2i) are increasingly prescribed in diabetes mellitus (DM) patients, yet their impact on tuberculosis (TB) incidence remains unclear. This study analyzed TB risk in DM patients with and without SGLT2i use. We conducted a retrospective cohort study using data from the Taiwan National Health Insurance Research Database between 2017 to 2020. DM patients treated with or without SGLT2i were identified, and propensity score (PS) matching was performed to balance baseline characteristics, including age, sex, comorbidities, and Diabetes Complications Severity Index (DCSI) between these two groups. TB incidence was assessed until December 31, 2021, and compared between groups. To consider death as a competing risk, a Cox regression model with the Fine and Gray approach was used to estimate the incidence of TB. Additionally, sensitivity analyses were…
Genes, proteins, chemicals, diseases, species, mutations and cell lines named across the full text — each resolved to its canonical identifier and authoritative record.
Click any figure to enlarge with its caption.
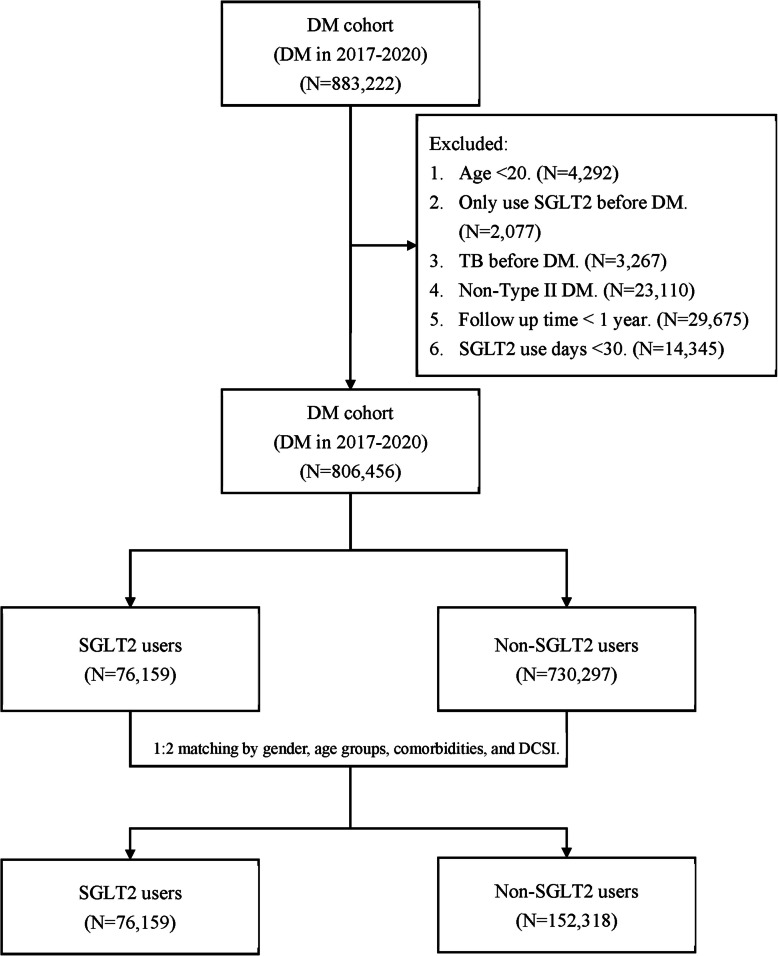 Figure 1
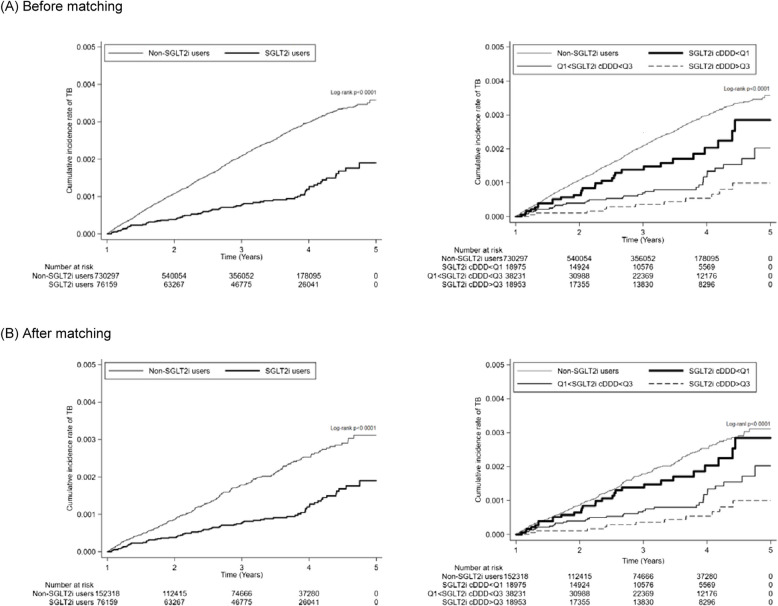 Figure 2
Peer Reviews
No public reviews on file for this paper yet. If you reviewed it on a platform where reviews are public (OpenReview, ICLR, NeurIPS, ICML), you can paste yours below so the community can read it here.
Videos
No videos yet. Explain this paper in a talk, walkthrough, or lecture? Add one.
Taxonomy
TopicsDiabetes Treatment and Management · Tuberculosis Research and Epidemiology · Magnesium in Health and Disease
Background
Tuberculosis (TB) remains one of the most prevalent and deadly infectious diseases and a leading cause of death worldwide, with 10.8 million new cases and nearly 1.25 million deaths reported in 2023, despite effective strategies and public health awareness, according to the World Health Organization Global Tuberculosis Report 2024 [1]. Notably, TB incidence is higher among high risk populations, such as diabetes mellitus (DM) patients [2], post gastrectomy patients [3], human immunodeficiency virus (HIV)-infected patients [4] and immunocompromised patients [5].
Among the above health conditions, DM is rapidly increasing as an epidemic disease [6, 7] and has a two-to four-fold higher risk of active TB [8–10]. Notably, the incidence of active pulmonary tuberculosis is about 4% in DM patients, with the risk increasing further in those with poor glycemic control [11, 12]. By contrast, the prevalence of diabetes mellitus is 15% to 40% in pulmonary tuberculosis patients [13, 14]. Given the large population of DM patient [15], the associated immune dysfunction involving macrophages, Th1, and Th17 responses in controlling and clearing Mycobacterium tuberculosis (Mtb) [16–18], along with the higher treatment costs, longer hospital stays [19], and increased mortality observed in DM patients with TB [20, 21], reducing the risk of TB in this population is a critical public health priority.
Since dysregulated immunity in DM contributes to increased susceptibility to TB [18], selecting antidiabetic medications that help restore immune function may play a critical role in mitigating this risk. Among the treatments for type 2 DM, metformin reportedly has a protective effect against TB incidence [22], whereas dipeptidyl peptidase-4 (DPP-4) inhibitors have a neutral role in mycobacterial pulmonary infection [23]. Due to its potential anti-TB properties, metformin has been proposed as an adjunctive therapy for TB [24]. However, its adverse effects, including the risk of lactic acidosis in patients with renal impairment and gastrointestinal disturbances, limit its widespread use in DM patients. Recently, sodium-glucose cotransporter 2 inhibitors (SGLT2i) have been increasingly prescribed for their superior glycemic control and favorable safety profiles. Beyond their antidiabetic effects, SGLT2i exhibit pleiotropic effects, including reductions in the risk of sepsis and pneumonia [25]. Based on these observations, we tried to explore the potential association between SGLT2i use and TB incidence. However, to date, no preclinical or clinical studies have investigated the association between SGLT2i use and TB incidence in a DM population. To address this knowledge gap, we conducted a nationwide retrospective cohort study using the National Insurance Research Database. Our aim was to evaluate whether SGLT2i use was associated with a reduced risk of TB among patients with type 2 DM.
Methods
Study design and data sources
In this retrospective cohort study, we identified DM patients treated with or without SGLT2i between January 1, 2017 and December 31, 2020 using the Taiwan National Health Insurance Research Database (NHIRD), which covers > 99% of the nation’s residents and includes information on participants’ disease and medical treatment histories [26]. The index date was defined as one year after the initial diagnosis of DM, to create a standardized baseline window for covariates assessment and allow sufficient time for initial treatment patterns and comorbidity development. Exposure classification was based on SGLT2i use after this index date, which allowed consistent alignment between exposure and follow-up time and helped minimize the risk of immortal time bias. The follow-up period continued until December 31, 2021, to assess the occurrence of TB, death or loss to follow-up among DM patients with and without SGLT2i. Death was identified using Taiwan's cause-of-death registry, which is linked to the NHIRD.
Study subjects
The definition of DM was based on the ICD-10-CM diagnosis codes (E08-E13), requiring at least one inpatient admission or three outpatient diagnoses within a 1-year period. The study focused on estimating the risk of TB among DM patients using SGLT2i, designating DM patients with SGLT2i as cases and those without as controls. SGLT2i use was defined by the ATC code, A10BK. To reduce selection bias and address potential confounding factors, propensity score (PS) matching was used for each case, with two controls selected from DM patients not using SGLT2i and matched based on age, gender, comorbidities, and the Diabetes Complications Severity Index (DCSI) score. These matching variables were chosen based on their established associations with both SGLT2i prescribing patterns and tuberculosis risk [27, 28]. The propensity score matching approach was based on the multivariable logistic regression model in an SAS matching macro, “%OneToManyMTCH,” which followed the use of a greedy algorithm to select cases and controls [29].
The exclusion criteria for this study included DM patients aged < 20 years and those who had only used SGLT2i before the DM diagnosis date, had TB prior to index date, had non-type 1 DM or non-type 2 DM, follow-up time of < 1 year, or < 30 days of SGLT2i use.
Measurements and outcome
Baseline information among DM patients included age, gender, and comorbidities. All comorbidities were identified using ICD-10-CM codes extracted from 1-year inpatient and outpatient records after the date of DM diagnosis. The comorbidities were hyperlipidemia (ICD-10-CM: E78), hypertension (HTN; ICD-10-CM: I10-I13, I15), cardiovascular disease (CVD; ICD-10-CM: G45-G46, I60-I69, H34.0), chronic obstructive pulmonary disease (COPD; ICD-10-CM: J41-J44), asthma (ICD-10-CM: J45), and chronic kidney disease (CKD; ICD-10-CM: N18). The Charlson Comorbidity Index (CCI) score [30, 31] was calculated using diagnostic records from the one-year period prior to the diagnosis of DM to reflect baseline comorbidity status. The DCSI score [32] was assessed during the baseline period between the date of DM diagnosis and the index date to define early diabetes-related complications prior to SGLT2i exposure.
Additionally, defined daily doses (DDDs), following recommendations from the World Health Organization Collaborating Centre for Drug Statistics Methodology, were used to quantify drug use [33]. To assess the risk of increased TB incidence, cumulative DDDs (cDDDs), indicating the total exposed dosage of SGLT2i in DM patients, were calculated as the sum of dispensed DDDs of SGLT2i during the follow-up period. Given the absence of clinically established cDDDs thresholds, SGLT2i use was stratified into three levels based on the quantile distribution of cDDDs: < 68, 68–260, and > 260. This data-driven stratification used exploratory evaluation of potential dose–response relationships, and it was better suited to the highly skewed nature of the cDDDs distribution in the study population (Additional file 1: Figure S1).
Considering potential confounding from diabetes pharmacotherapy, baseline use of metformin, sulfonylureas (SU), DPP-4 inhibitors, and insulin was also included in this study during the follow-up periods. These medications were identified using ATC codes as follows: metformin (A10BA02, A10BD02, A10BD05, A10BD07, A10BD08, A10BD10, A10BD11, A10BD13, A10BD14, A10BD15, A10BD20), SU (A10BB12, A10BD02, A10BB01, A10BB07, A10BB09), DPP-4 inhibitors (A10BH01, A10BD07, A10BD24, A10BH02, A10BD08, A10BH03, A10BD10, A10BD21, A10BH05, A10BD11, A10BD19), and insulin (A10AB01, A10AB04, A10AB05, A10AB06, A10AC01, A10AE04, A10AE05, A10AE06, A10AD01, A10AD04, A10AD05, A10AD06, A10AE54). These variables were treated as covariates in the multivariable Cox regression models to control for differences in background treatment.
The primary outcome of the study was TB, defined based on the ICD-10-CM diagnosis codes (A15.0, A15.4-A15.9, A17-A19), requiring at least one inpatient admission or two outpatient diagnoses within a 6-month period. To prevent misclassification bias, study subjects were limited to patients with a TB diagnosis code who also received anti-TB prescriptions. Anti-TB prescriptions were identified using ATC codes, covering drugs such as isoniazid (ATC codes: J04AC01, J04AC51, J04AM02, J04AM03, J04AM05, J04AM06, J04AM07), rifampin (ATC codes: J04AB02, J04AC51, J04AM02, J04AM05, J04AM06, J04AM07), pyrazinamide (ATC codes: J04AK01, J04AM05, J04AM06), and ethambutol (ATC codes: J04AK02, J04AM03, J04AM06, J04AM07).
Statistical analysis
Baseline characteristics between DM patients treated with SGLT2i and those without were compared using standardized mean differences (SMDs) to assess covariate balance. An SMD of less than 0.1 was considered to indicate adequate covariate balance [34]. The trends in incidence of TB between DM patients taking SGLT2i and those without were plotted with the Kaplan–Meier method, and differences were compared using the log-rank test. The risk of TB was presented as hazard ratios (HRs) with 95% confidence intervals (95% CIs) and calculated using the Cox proportional hazard model after adjusting for other confounding variables. As death may affect the occurrence of TB, we performed a competing risk analysis to estimate the TB incidence using the Cox regression model with the Fine and Gray approach. The proportional hazards assumption was assessed using Schoenfeld residuals. The global test showed no significant violation after matching (p = 0.2893), confirming the validity of the Cox model. The presentation of results included stratified analyses to estimate differences across groups. Additionally, subgroup analyses were conducted stratifying DM patients by cDDDs of SGLT2i, age, gender, and concomitant use of other antidiabetic drugs.
To address potential bias, we conducted several sensitivity analyses. First, we excluded patients who were diagnosed with TB within 30 days after the index date, based on the rationale that early TB diagnoses may reflect pre-existing, undetected infections rather than new-onset TB related to SGLT2i exposure. Second, to reduce confounding from concomitant treatments, we excluded patients in the SGLT2i group who received other antidiabetic medications during the follow-up period, allowing for a more specific evaluation of the independent effect of SGLT2i. Third, to evaluate the influence of exposure timing on outcome, the index date was redefined based on the actual initiation of SGLT2i therapy to better capture the relevant risk period. We then conducted a separate analysis for early initiation, defined as SGLT2i use within the first year after DM diagnosis, to assess the temporal relationship between exposure and TB incidence.
All statistical analyses were performed in SAS 9.4 for Windows (SAS Institute, Inc., Cary, NC, USA). Kaplan–Meier curves were plotted in STATA version 12 (Stata Corp., College Station, TX, USA) due to its flexibility in survival curve visualization. Statistical significance was set at 0.05 (two-tailed).
Results
Enrollment and clinical characteristics of patients
The enrollment details of the patients are illustrated in Fig. 1. The dataset for analysis comprised 883,222 patients diagnosed with DM between 2017 and 2020. Following the application of exclusion criteria, 76,766 patients were excluded from the study. Consequently, a total of 806,456 patients, consisting of 76,159 SGLT2i users and 730,297 non-SGLT2i users, were included in the final analysis.Fig. 1. Flowchart of case selection and propensity score matching for diabetes mellitus (DM) patients treated with or without sodium-glucose cotransporter 2 (SGLT2) inhibitors
Table 1 provides a summary of the clinical characteristics of the enrolled patients. The majority of enrolled patients were aged over 50 years (78.61%), with males slightly predominant (54.23%). In terms of DM classification, the vast majority (98.54%) were diagnosed with type 2 DM. In comparing SGLT2i users to non-SGLT2i users, it was observed that SGLT2i users were generally younger and had a higher percentage of males (61.90% vs. 53.43%, SMD = 0.2583). Additionally, SGLT2i users exhibited fewer comorbidities including HTN, CVD, COPD, asthma, and CKD. Regarding DM status and complications, SGLT2i users had higher rates of insulin use (33.56% vs. 20.15%, SMD = 0.3062), metformin use (95.53% vs. 68.47%, SMD = 0.7526), SU use (46.97% vs. 22.25%, SMD = 0.5382), and DPP-4 inhibitors use (35.96% vs. 19.63%, SMD = 0.3707), as well as a higher mean DCSI score (0.75 ± 1.06 vs. 0.65 ± 1.05, SMD = 0.1009). Table 1. Baseline demographics of enrolled DM patientsBefore matchingAfter matchingTotal DM patients(N = 806,456)SGLT2i users(N = 76,159)Non-SGLT2i users(N = 730,297)SMDTotal DM patients(N = 228,477)SGLT2i users(N = 76,159)Non-SGLT2i users(N = 152,318)SMDGender Male437,304(54.23)47,142(61.9)390,162(53.43)0.2583141,467(61.92)47,142(61.9)94,325(61.93)0.0095 Female369,152(45.77)29,017(38.1)340,135(46.57)87,010(38.08)29,017(38.1)57,993(38.07)Age group in index date 20–3956,082(6.95)10,214(13.41)45,868(6.28)0.463030,676(13.43)10,214(13.41)20,462(13.43)< 0.0001 40–49116,441(14.44)17,231(22.63)99,210(13.58)51,664(22.61)17,231(22.63)34,433(22.61) 50–59206,656(25.63)21,561(28.31)185,095(25.35)64,695(28.32)21,561(28.31)43,134(28.32) 60–69235,724(29.23)17,924(23.53)217,800(29.82)53,764(23.53)17,924(23.53)35,840(23.53) > = 70191,553(23.75)9229(12.12)182,324(24.97)27,678(12.11)9229(12.12)18,449(12.11)Comorbidity Hyperlipidemia430,749(53.41)46,096(60.53)384,653(52.67)−0.1590138,253(60.51)46,096(60.53)92,157(60.5)0.0005 HTN442,303(54.85)40,781(53.55)401,522(54.98)−0.0288122,267(53.51)40,781(53.55)81,486(53.5)0.0010 CVD69,956(8.67)4945(6.49)65,011(8.9)−0.090514,816(6.48)9871(12.96)4945(3.25)0.0005 COPD29,463(3.65)1870(2.46)27,593(3.78)−0.07625568(2.44)1870(2.46)3698(2.43)0.0018 Asthma23,634(2.93)1970(2.59)21,664(2.97)−0.02315869(2.57)1970(2.59)3899(2.56)0.0017 CKD49,496(6.14)4053(5.32)45,443(6.22)−0.038612,144(5.32)4053(5.32)8091(5.31)0.0004DM type Type I11,808(1.46)1509(1.98)10,299(1.41)0.24114455(1.95)1509(1.98)2946(1.93)−0.0007 Type II794,648(98.54)74,650(98.02)719,998(98.59)224,022(98.05)74,650(98.02)149,372(98.07)Other antidiabetic drug Insulin172,706(21.42)25,562(33.56)147,144(20.15)0.306257,618(25.22)25,562(33.56)32,056(21.05)0.2838 Metformin572,767(71.02)72,754(95.53)500,013(68.47)0.7526183,276(80.22)72,754(95.53)110,522(72.56)0.6606 SU198,229(24.58)35,770(46.97)162,459(22.25)0.538273,549(32.19)35,770(46.97)37,779(24.8)0.4749 DPP-4 inhibitors170,758(21.17)27,387(35.96)143,371(19.63)0.370758,223(25.48)27,387(35.96)30,836(20.24)0.3551 CCI score0.58 ± 1.180.41 ± 0.960.59 ± 1.20−0.16330.46 ± 1.050.41 ± 0.960.49 ± 1.09−0.0731CCI group 0559,834(69.42)57,562(75.58)502,272(68.78)0.1844168,671(73.82)57,562(75.58)111,109(72.95)0.1082 1–2199,016(24.68)15,862(20.83)183,154(25.08)49,980(21.88)15,862(20.83)34,118(22.4) ≧347,606(5.9)2735(3.59)44,871(6.14)9826(4.3)2735(3.59)7091(4.66)DCSI0.66 ± 1.050.75 ± 1.060.65 ± 1.050.10090.75 ± 1.050.75 ± 1.060.75 ± 1.050.0020DCSI group 0508,482(63.05)465,357(611.03)43,125(5.91)0.1443129,396(56.63)43,125(56.62)86,271(56.64)< 0.0001 1147,061(18.24)130,423(171.25)16,638(2.28)49,961(21.87)16,638(21.85)33,323(21.88) ≧2150,913(18.71)134,517(176.63)16,396(2.25)49,120(21.5)16,396(21.53)32,724(21.48)Diabetes complications Retinopathy21,819(2.71)3257(4.28)18,562(2.54)0.09579250(4.05)3257(4.28)5993(3.93)0.0172 Nephropathy108,894(13.5)12,323(16.18)96,571(13.22)0.083636,144(15.82)12,323(16.18)23,821(15.64)0.0148 Neuropathy39,329(4.88)4412(5.79)34,917(4.78)0.045213,826(6.05)4412(5.79)9414(6.18)−0.0163 Cerebrovascular51,139(6.34)3780(4.96)47,359(6.48)−0.065511,583(5.07)3780(4.96)7803(5.12)−0.0073 Cardiovascular133,573(16.56)15,540(20.4)118,033(16.16)0.109945,022(19.71)15,540(20.4)29,482(19.36)0.0263 Peripheral Vascular17,614(2.18)1785(2.34)15,829(2.17)0.01196419(2.81)1785(2.34)4634(3.04)−0.0432 Metabolic12,324(1.53)1551(2.04)10,773(1.48)0.04284896(2.14)1551(2.04)3345(2.2)−0.0111 cDDD, mean ± SD-193.94 ± 181.94---193.94 ± 181.94-- cDDD, median(Q1-Q3)-136(68–260)---136(68–260)--cDDD group < 68-18,975(24.91)---18,975(24.91)-- 68–260-38,231(50.2)--38,231(50.2)- > 260-18,953(24.89)--18,953(24.89)-Outcome Time to follow up3.00 ± 1.173.30 ± 1.132.97 ± 1.160.29073.08 ± 1.173.30 ± 1.132.97 ± 1.170.2889 TB1514(0.19)75(0.1)1439(0.2)−0.0257332(0.15)75(0.1)257(0.17)0.0192 Time to TB2.24 ± 0.912.56 ± 1.132.23 ± 0.900.32922.34 ± 0.982.56 ± 1.132.27 ± 0.92−0.2853 Death37,866(4.7)1801(2.36)36,065(4.94)−0.13757022(3.07)1801(2.36)5221(3.43)−0.0634Data are numbers (percentage) or mean ± standard deviation*Abbreviation**: *DM diabetes mellitus, SGLT2i sodium-glucose cotransporter 2 inhibitors, SMD standardized mean difference, HTN hypertension, CVD cardiovascular disease, COPD chronic obstructive pulmonary disease, CKD chronic kidney disease, SU sulfonylureas, DPP-4 dipeptidyl peptidase-4, CCI Charlson Comorbidity Index, DCSI Diabetes Complications Severity Index, cDDD cumulative defined daily dose, TB tuberculosis
PS matched cohort
In the PS matched cohort, a matched cohort of 76,159 SGLT2i users and 152,318 non-SGLT2i users was meticulously assembled by balancing the age, gender, comorbidities, and DCSI (Fig. 1). As shown in Table 1, following the matching process, no statistical differences were observed in terms of age, gender, comorbidities, DCSI score, diabetes complications, or DM classification between the SGLT2i users and non-SGLT2i users (all SMD < 0.1). Considering DM status and complications, SGLT2i users exhibited a higher percentage of insulin use (33.56% vs. 21.05%, SMD = 0.2838), metformin use (95.53% vs. 72.56%, SMD = 0.6606), SU use (46.97% vs. 24.80%, SMD = 0.4749), and DPP-4 inhibitors use (35.96% vs. 20.24%, SMD = 0.3551).
The risk of incident TB
Over an average follow-up period of three years (Table 1), the incidence of newly diagnosed TB was lower in SGLT2i users than in non-users, both before PS matching (0.1% vs. 0.2%, SMD = −0.0257) and after PS matching (0.10% vs. 0.17%, SMD = 0.0192). Additionally, the time to newly diagnosed TB was longer in SGLT2i users than in non-users, both before PS matching (2.56 ± 1.13 vs. 2.23 ± 0.90 years, SMD = 0.3292) and after PS matching (2.56 ± 1.13 vs. 2.27 ± 0.92 years, SMD = −0.2853).
The Kaplan–Meier survival curves (Figs. 2a and b) also demonstrated a lower cumulative incidence of TB among SGLT2i users in both cohorts before and after PS matching (both p < 0.001).Fig. 2. Kaplan–Meier survival curves depicting the cumulative incidence of tuberculosis (TB) in patients treated with or without sodium-glucose cotransporter 2 inhibitors (SGLT2i), stratified by cumulative defined daily doses (cDDDs), shown before (a) and after (b) propensity score matching
The risk of incident TB adjusted for confounding variables
Before covariate adjustment (Table 2), SGLT2i users exhibited protective crude HRs for incident TB of 0.44 (95% CI: 0.35–0.56) and 0.50 (95% CI: 0.39–0.65) compared to non-SGLT2i users before and after PS matching, respectively. After adjustments for covariates, including age, gender, other antidiabetic drug (including insulin use, metformin use, SU use, and DPP-4 inhibitors use), comorbidities, CCI group, and DCSI group, SGLT2i users continued to show a significantly lower incidence of TB, with adjusted HRs (AHR) of 0.49 (95% CI: 0.38–0.62) and 0.43 (95% CI: 0.33–0.56) before and after PS matching, respectively. Table 2. The risk of TB in DM patients under competing risk analysis adjusted for confounding variablesBefore matchingAfter matchingPatients(N = 806,456)TB(N = 1514)Death(N = 37,489)Crude HR(95% CI)p-valueAHR(95% CI)p-valuePatients(N = 228,477)TB(N = 332)Death(N = 6767)Crude HR(95% CI)p-valueAHR(95% CI)p-valueSGLT2i76,15975(0.1)1786(2.35)0.44(0.35–0.56)< 0.00010.49(0.38–0.62)< 0.000176,15975(0.1)1786(2.35)0.50(0.39–0.65)< 0.00010.43(0.33–0.56)< 0.0001Non-SGLT2i730,2971439(0.2)35,703(4.89)RefRef152,318257(0.17)5181(3.4)RefRefGender Male437,3041111(0.25)22,361(5.11)2.33(2.08–2.61)< 0.00012.45(2.18–2.76)< 0.0001141,467257(0.18)4900(3.46)-- Female369,152403(0.11)15,128(4.1)RefRef87,01075(0.09)2067(2.38)--Age group 20–3956,08240(0.07)430(0.77)RefRef30,67614(0.05)200(0.65)-- 40–49116,441122(0.1)1767(1.52)1.47(1.03–2.10)0.03481.57(1.10–2.24)0.014051,66445(0.09)751(1.45)-- 50–59206,656250(0.12)4439(2.15)1.66(1.19–2.32)0.00281.91(1.36–2.67)0.000264,69579(0.12)1322(2.04)-- 60–69235,724410(0.17)7694(3.26)2.41(1.74–3.33)< 0.00012.74(1.98–3.81)< 0.000153,764103(0.19)1754(3.26)-- > = 70191,553692(0.36)23,159(12.09)4.98(3.62–6.85)< 0.00014.54(3.26–6.31)< 0.000127,67891(0.33)2940(10.62)--Other antidiabetic drug Insulin172,706825(0.48)25,037(14.5)3.92(3.54–4.33)< 0.00013.63(3.23–4.09)< 0.000157,618191(0.33)4975(8.63)3.11(2.48–3.91)< 0.00013.41(2.67–4.35)< 0.0001 Metformin572,767990(0.17)21,695(3.79)0.72(0.65–0.80)< 0.00010.77(0.68–0.86)< 0.0001183,276254(0.14)4863(2.65)0.87(0.67–1.13)0.29690.81(0.60–1.09)0.1611 SU198,229458(0.23)10,760(5.43)1.14(1.02–1.27)0.02091.07(0.95–1.21)0.261773,549134(0.18)2598(3.53)1.28(1.03–1.59)0.02531.22(0.96–1.57)0.1077 DPP-4170,758427(0.25)13,830(8.1)1.28(1.15–1.43)< 0.00010.83(0.73–0.94)0.002758,223118(0.2)2897(4.98)1.21(0.96–1.52)0.10341.02(0.80–1.29)0.9055Comorbidity Hyperlipidemia430,749569(0.13)10,651(2.47)0.54(0.48–0.60)< 0.00010.76(0.68–0.85)< 0.0001138,253150(0.11)2592(1.87)-- HTN442,303891(0.2)25,122(5.68)1.17(1.05–1.29)0.00320.91(0.82–1.01)0.0889122,267179(0.15)4475(3.66)-- CVD69,956237(0.34)9437(13.49)1.88(1.64–2.16)< 0.00011.03(0.88–1.21)0.702014,81639(0.26)1297(8.75)-- COPD29,463187(0.63)5591(18.98)3.52(3.02–4.11)< 0.00011.51(1.27–1.80)< 0.0001556830(0.54)718(12.9)-- Asthma23,63484(0.36)1861(7.87)1.90(1.52–2.37)< 0.00011.34(1.06–1.69)0.0136586915(0.26)293(4.99)-- CKD49,496204(0.41)7383(14.92)2.37(2.04–2.74)< 0.00011.23(1.04–1.46)0.017012,14428(0.23)1037(8.54)--CCI group 0559,834837(0.15)13,751(2.46)RefRef168,671202(0.12)3039(1.8)RefRef 1–2199,016475(0.24)13,674(6.87)1.58(1.41–1.77)< 0.00011.03(0.91–1.17)0.601649,98092(0.18)2318(4.64)1.02(0.78–1.34)0.86691.06(0.81–1.38)0.6813 ≧347,606202(0.42)10,064(21.14)2.81(2.41–3.28)< 0.00011.07(0.89–1.28)0.4919982638(0.39)1610(16.39)1.66(1.12–2.47)0.01241.38(0.93–2.04)0.1117DCSI group 0508,482770(0.15)14,256(2.8)RefRef129,396144(0.11)2245(1.73)-- 1147,061267(0.18)5948(4.04)1.19(1.03–1.36)0.01600.92(0.80–1.06)0.253449,96169(0.14)1357(2.72)-- ≧2150,913477(0.32)17,285(11.45)2.01(1.79–2.25)< 0.00010.96(0.83–1.11)0.562349,120119(0.24)3365(6.85)--Data are numbers (percentage) or hazard ratio (95% confidence interval)Abbreviation: TB tuberculosis, DM diabetes mellitus, HR hazard ratio, AHR adjusted hazard ratio, CI confidence interval, SGLT2i sodium-glucose cotransporter 2 inhibitors, SU sulfonylureas, DPP-4 dipeptidyl peptidase-4, HTN hypertension, CVD cardiovascular disease, COPD chronic obstructive pulmonary disease, CKD chronic kidney disease, CCI Charlson Comorbidity Index, DCSI Diabetes Complications Severity Index
Subgroup analysis – different cDDDs of SGLT2i
Furthermore, we evaluated the effects of different SGLT2i doses on the incidence of TB (Table 3). After PS matching and adjustment for covariates, including age, gender, other antidiabetic drug, comorbidities, CCI group, and DCSI group, SGLT2i users with cDDDs > 260, and between 68 and 260, exhibited significantly lower AHRs for incident TB of 0.21 (95% CI: 0.12–0.39), and 0.42 (95% CI: 0.29–0.60), respectively, compared to non-SGLT2i users. Table 3. The risk of TB in DM patients stratified by SGLT2i dose (cDDDs) under competing risk analysis adjusted for confounding variablesBefore matchingAfter matchingPatients(N = 806,456)TB(N = 1514)Death(N = 37,489)Crude HR(95% CI)p-valueAHR(95% CI)p-valuePatients(N = 228,477)TB(N = 332)Death(N = 6767)Crude HR(95% CI)p-valueAHR(95% CI)p-valueSGLT2i Non-SGLT2i730,2971439(0.2)35,703(4.89)RefRef152,318257(0.17)5181(3.4)RefRef < 6818,97529(0.15)613(3.23)0.73(0.51–1.05)0.09150.77(0.53–1.12)0.168618,97529(0.15)613(3.23)0.84(0.57–1.23)0.36590.70(0.47–1.04)0.0761 68–26038,23135(0.09)792(2.07)0.42(0.30–0.59)< 0.00010.48(0.34–0.67)< 0.000138,23135(0.09)792(2.07)0.49(0.34–0.70)< 0.00010.42(0.29–0.60)< 0.0001 > 26018,95311(0.06)381(2.01)0.23(0.13–0.42)< 0.00010.26(0.14–0.46)< 0.000118,95311(0.06)381(2.01)0.25(0.14–0.45)< 0.00010.21(0.12–0.39)< 0.0001Gender Male437,3041111(0.25)22,361(5.11)2.33(2.08–2.61)< 0.00012.46(2.19–2.76)< 0.0001141,467257(0.18)4900(3.46)-- Female369,152403(0.11)15,128(4.1)RefRef87,01075(0.09)2067(2.38)--Age group 20–3956,08240(0.07)430(0.77)RefRef30,67614(0.05)200(0.65)-- 40–49116,441122(0.1)1767(1.52)1.47(1.03–2.10)0.03481.57(1.10–2.24)0.013551,66445(0.09)751(1.45)-- 50–59206,656250(0.12)4439(2.15)1.66(1.19–2.32)0.00281.91(1.37–2.67)0.000264,69579(0.12)1322(2.04)-- 60–69235,724410(0.17)7694(3.26)2.41(1.74–3.33)< 0.00012.75(1.98–3.82)< 0.000153,764103(0.19)1754(3.26)-- > = 70191,553692(0.36)23,159(12.09)4.98(3.62–6.85)< 0.00014.54(3.26–6.32)< 0.000127,67891(0.33)2940(10.62)--Other antidiabetic drug Insulin172,706825(0.48)25,037(14.5)3.92(3.54–4.33)< 0.00013.63(3.23–4.09)< 0.000157,618191(0.33)4975(8.63)3.11(2.48–3.91)< 0.00013.42(2.67–4.37)< 0.0001 Metformin572,767990(0.17)21,695(3.79)0.72(0.65–0.80)< 0.00010.77(0.68–0.86)< 0.0001183,276254(0.14)4863(2.65)0.87(0.67–1.13)0.29690.81(0.60–1.09)0.1680 SU198,229458(0.23)10,760(5.43)1.14(1.02–1.27)0.02091.07(0.95–1.21)0.262873,549134(0.18)2598(3.53)1.28(1.03–1.59)0.02531.22(0.95–1.56)0.1133 DPP-4170,758427(0.25)13,830(8.1)1.28(1.15–1.43)< 0.00010.83(0.73–0.93)0.002158,223118(0.2)2897(4.98)1.21(0.96–1.52)0.10341.00(0.78–1.27)0.9705Comorbidity Hyperlipidemia430,749569(0.13)10,651(2.47)0.54(0.48–0.60)< 0.00010.76(0.68–0.85)< 0.0001138,253150(0.11)2592(1.87)-- HTN442,303891(0.2)25,122(5.68)1.17(1.05–1.29)0.00320.91(0.82–1.02)0.0927122,267179(0.15)4475(3.66)-- CVD69,956237(0.34)9437(13.49)1.88(1.64–2.16)< 0.00011.03(0.88–1.21)0.715614,81639(0.26)1297(8.75)-- COPD29,463187(0.63)5591(18.98)3.52(3.02–4.11)< 0.00011.51(1.27–1.80)< 0.0001556830(0.54)718(12.9)-- Asthma23,63484(0.36)1861(7.87)1.90(1.52–2.37)< 0.00011.34(1.06–1.69)0.0137586915(0.26)293(4.99)-- CKD49,496204(0.41)7383(14.92)2.37(2.04–2.74)< 0.00011.23(1.04–1.46)0.018412,14428(0.23)1037(8.54)--CCI group 0559,834837(0.15)13,751(2.46)RefRef168,671202(0.12)3039(1.8)RefRef 1–2199,016475(0.24)13,674(6.87)1.58(1.41–1.77)< 0.00011.04(0.91–1.17)0.584549,98092(0.18)2318(4.64)1.02(0.78–1.34)0.86691.06(0.82–1.38)0.6460 ≧347,606202(0.42)10,064(21.14)2.81(2.41–3.28)< 0.00011.07(0.89–1.28)0.4845982638(0.39)1610(16.39)1.66(1.12–2.47)0.01241.38(0.93–2.04)0.1086DCSI group 0508,482770(0.15)14,256(2.8)RefRef129,396144(0.11)2245(1.73)-- 1147,061267(0.18)5948(4.04)1.19(1.03–1.36)0.01600.92(0.80–1.07)0.268849,96169(0.14)1357(2.72)-- ≧2150,913477(0.32)17,285(11.45)2.01(1.79–2.25)< 0.00010.96(0.83–1.11)0.598749,120119(0.24)3365(6.85)--Data are numbers (percentage) or hazard ratio (95% confidence interval)Abbreviation: TB tuberculosis, DM diabetes mellitus, cDDDs cumulative defined daily doses, HR hazard ratio, AHR adjusted hazard ratio, CI confidence interval, SGLT2i sodium-glucose cotransporter 2 inhibitors, SU sulfonylureas, DPP-4 dipeptidyl peptidase-4, HTN hypertension, CVD cardiovascular disease, COPD chronic obstructive pulmonary disease, CKD chronic kidney disease, CCI Charlson Comorbidity Index, DCSI Diabetes Complications Severity Index
The Kaplan–Meier survival curves (Figs. 2a and b) also demonstrated a consistently lower cumulative incidence of TB among SGLT2i users with higher cDDDs compared to non-SGLT2i users, both before and after PS matching (p < 0.001).
Subgroup analysis – stratified by age, gender and concomitant use of other antidiabetic drugs
In the subgroup analysis stratified by age, gender and concomitant use of other antidiabetic drugs (Additional file 1: Table S1), the AHRs for incident TB remained significantly lower in SGLT2i users than in non-users across all subgroups. The protective association was observed in both males (AHR 0.41, 95% CI: 0.30–0.56) and females (AHR 0.57, 95% CI: 0.34–0.95); in patients < 65 years (AHR 0.43, 95% CI: 0.30–0.61) and ≥ 65 years (AHR 0.46, 95% CI: 0.31–0.68); and among those using other antidiabetic agents, including insulin (AHR 0.50, 95% CI: 0.37–0.48), metformin (AHR 0.45, 95% CI: 0.34–0.59), SU (AHR 0.47, 95% CI: 0.33–0.67), and DPP-4 inhibitors (AHR 0.59, 95% CI: 0.41–0.86), even after propensity score matching and adjustment for covariates.
Sensitivity analysis
Considering the rationale that early TB diagnoses may reflect pre-existing disease rather than SGLT2i-associated risk, a sensitivity analysis was presented excluding patients who were diagnosed with TB within 30 days after the index date (Additional file 1: Table S2). A PS-matched cohort of 76,156 SGLT2i users and 152,312 non-SGLT2i users was established, and SGLT2i users had significantly lower TB risk than non SGLT2i users (AHR: 0.44; 95% CI: 0.33–0.57). The other sensitivity analysis was performed to address potential confounding from concomitant treatments (Additional file 1: Table S3). After excluding patients in the SGLT2i group who also received other antidiabetic medications, SGLT2i users show 0.37-fold risk of TB (95% CI: 0.21–0.65) compared with non-SGLT2i users. Additionally, to address potential time-related biases, a sensitivity analysis of using SGLT2i initiation date as the index date (Additional file 1: Table S4). The results indicated a significantly lower TB risk in SGLT2i users than in non-users (AHR: 0.75; 95% CI: 0.57–0.99). When restricting exposure to early initiation (within the first year after DM diagnosis), SGLT2i users consistently exhibited a significantly lower risk of TB compared with non-users.
Discussion
Using a large cohort of DM patients identified from the Taiwan NHIRD, this study is the first to report an association between SGLT2i use and a lower incidence of subsequent TB development in this population. This association remained consistent across different age groups, sexes, and concomitant antidiabetic therapies, suggesting a potential class effect of SGLT2i. Moreover, the cDDD analysis indicated a possible dose–response relationship, with lower TB incidence observed among patients receiving higher cumulative doses of SGLT2i. Finally, several sensitivity analyses were performed to minimize immortal time bias and better assess the temporal sequence of exposure and outcome. Collectively, these findings support a robust association between SGLT2i use and reduced TB risk, although causality cannot be inferred from this observational study.
The pathogenesis underlying the association between DM and TB is believed to be primarily related to dysfunctional host immunity with chronic inflammatory milieu. This dysfunction involves reduced Th1 and Th17 responses in LTBI patients with DM and hyperreactive but ineffective Th1 and Th17 responses in active TB patients with DM, leading to impaired Mtb killing and clearance [35, 36]. Based on these observations, host-directed therapy aimed at restoring immune dysfunction both to reduce the susceptibility of DM patients to TB is an appealing approach that warrants further research.
Metformin has been reported as an effective adjunctive therapy against TB [24]. Its protective effects extend beyond glycemic control and are believed to be related to enhancing macrophage activity and promoting inflammatory killing of Mtb [37]. In our analysis (Table 2), metformin users only showed a numerically lower, but not statistically significant, risk of TB compared with non-users (AHR: 0.81; 95% CI: 0.60–1.09). This finding underscores the need to explore additional therapeutic agents with potential protective effects in DM patients at risk of TB.
Our findings support SGLT2i’s potential as adjunctive agents for TB prevention. While the mechanisms remain unclear, several hypotheses can be proposed beyond its glycemic control effects including SGLT2i exhibit antioxidant properties and reduce systemic inflammation [38]. Additionally, emerging evidence suggests that SGLT2i may modulate the gut microbiota, particularly by reducing Phascolarctobacterium, a propionate-producing genus enriched in TB patients and associated with impaired macrophage function and dysregulated Th1 and Th17 responses [39–41]. This hypothesis points to a potential gut–lung axis mechanism through which SGLT2i could help reduce TB risk, warranting further mechanistic investigation.
The strengths of the present study included the large case number and stringent drug coding in a national insurance database. In addition, the findings have been validated by several subgroup analyses and sensitivity tests. Despite these significant findings, several limitations should be acknowledged. First, as a retrospective study using NHIRD data, confounding by indication remains a concern and may not be fully eliminated despite PS matching, as SGLT2i could have been preferentially prescribed to specific DM patients. In our dataset, SGLT2i users were generally younger, had fewer comorbidities, higher rates of concomitant use of other antidiabetic drugs (including insulin, metformin, sulfonylureas, and DPP-4 inhibitors), and a higher mean DCSI score. Furthermore, due to the inherent limitations of administrative claims data, certain clinical and social variables, such as body mass index, glycated hemoglobin (HbA1c), socioeconomic status, and medication adherence, were not available. In particular, HbA1c, an important marker of glycemic control that influences TB susceptibility, could not be adjusted for in our analysis. Although DCSI was used as a surrogate for diabetes severity, residual confounding related to differences in baseline glycemic status may persist.
Second, the diagnoses of TB and comorbidities were based on ICD-10 coding. Although previous validation studies have reported moderate to high sensitivity and positive predictive values for the Taiwan NHIRD [26], some degree of misclassification may still be present. Third, we could not account for the LTBI status and receipt of TB preventive therapy among enrolled DM patients, which might have influenced the observed association. Fourth, to address potential confounding from concomitant antidiabetic treatments, a sensitivity analysis was performed excluding patients in the SGLT2i group who also received other antidiabetic medications. While this approach allowed for a more specific evaluation of the independent effect of SGLT2 inhibitors, it may have introduced selection bias by preferentially retaining patients with less severe DM, who are more likely to receive monotherapy and inherently have a lower risk of TB. Importantly, the persistence of a protective association in this lower-risk subgroup suggests that the observed benefit of SGLT2i may be robust and not solely attributable to differences in baseline diabetes severity. Finally, as this study was based on Taiwan NHIRD data, its generalizability to populations with different TB incidence rates, diabetes management practices, or genetic backgrounds remains uncertain.
Conclusions
SGLT2i use was associated with a lower risk of TB development in DM patients. While this finding suggests a potential role for SGLT2i as a host-directed therapy against TB, it should be interpreted cautiously given the observational nature of the study. Further prospective studies and randomized controlled trials are needed to elucidate the underlying mechanisms, confirm this association, and assess whether SGLT2i could have a preventive role in high TB-risk populations.
Supplementary Information
Additional file 1: Figure S1 and Tables S1–S4. Figure S1. The distribution of cumulative defined daily doses (cDDDs) of SGLT2i was highly skewed in the study population. Table S1. The risk of TB among SGLT2i users and non-SGLT2i users stratified by gender, age, and other antidiabetic drug groups after propensity matching. Table S2. Sensitivity analysis of excluding patients who were diagnosed with TB within 30 days after the index date. Table S3. Sensitivity analysis excluding patients receiving other antidiabetic medications during the follow up periods in the SGLT2i group. Table S4. Sensitivity analysis using SGLT2i initiation date as the index date.
The reference list from the paper itself. Each links out to its DOI / PubMed record.
- 1World Health Organization Collaborating Centre for Drug Statistics Methodology. Guidelines for ATC classification and DDD assignment 2013. Oslo: WHO Collaborating Centre for Drug Statistics Methodology; 2012. Available from: https://www.whocc.no/atc_ddd_publications_guidelines/.
- 2Restrepo BI. Diabetes and Tuberculosis. Microbiol Spectr. 2016;4(6): 10.1128/microbiolspec.TNMI 7-0023-2016.10.1128/microbiolspec.TNMI 7-0023-2016 PMC 524079628084206 · doi ↗ · pubmed ↗