Characterization of trehalose-6-phosphate synthase gene family in linseed (Linum usitatissimum L.) and its potential implications in flowering time regulation
Ankit Saroha, Daniya Shahid, J. Aravind, Sneha Murmu, Vikender Kaur, S. Rajkumar, Abhishek Sengupta, Dhammaprakash Pandhari Wankhede

TL;DR
This study explores how trehalose-6-phosphate synthase (TPS) genes in linseed may influence flowering time, which is important for seed yield and quality.
Contribution
The study identifies TPS gene family members in linseed and links them to flowering time regulation through gene expression, allelic variation, and cis-regulatory elements.
Findings
18 LuTPS genes were identified and grouped into two clusters, with some showing high expression and correlation with flowering-related genes.
Allelic variations in LuTPS6.1 and LuTPS10.2 are associated with early or late flowering in linseed.
Enriched cis-regulatory elements in TPS gene promoters suggest roles in gene regulation and evolution.
Abstract
Linseed is an important oilseed crop with diverse applications in the food, nutraceutical, oil, and paint industries. Flowering time is a critical trait in linseed, as it greatly influences seed yield potential and quality across various agro-ecological zones. Trehalose-6-phosphate synthase (TPS) genes have been implicated in the regulation of flowering time in plants. Therefore, a comprehensive analysis of the TPS gene family in linseed, using comparative genomics and bioinformatics approaches, is essential for elucidating the genetic mechanisms underlying flowering time regulation in this crop. A total of 18 LuTPS genes, including several paralogs, were identified in the linseed genome and clustered into two distinct groups. Gene expression analysis in developing floral buds, flower, and vegetative tissues revealed that most TPS genes exhibited basal expression levels. However,…
Genes, proteins, chemicals, diseases, species, mutations and cell lines named across the full text — each resolved to its canonical identifier and authoritative record.
Click any figure to enlarge with its caption.
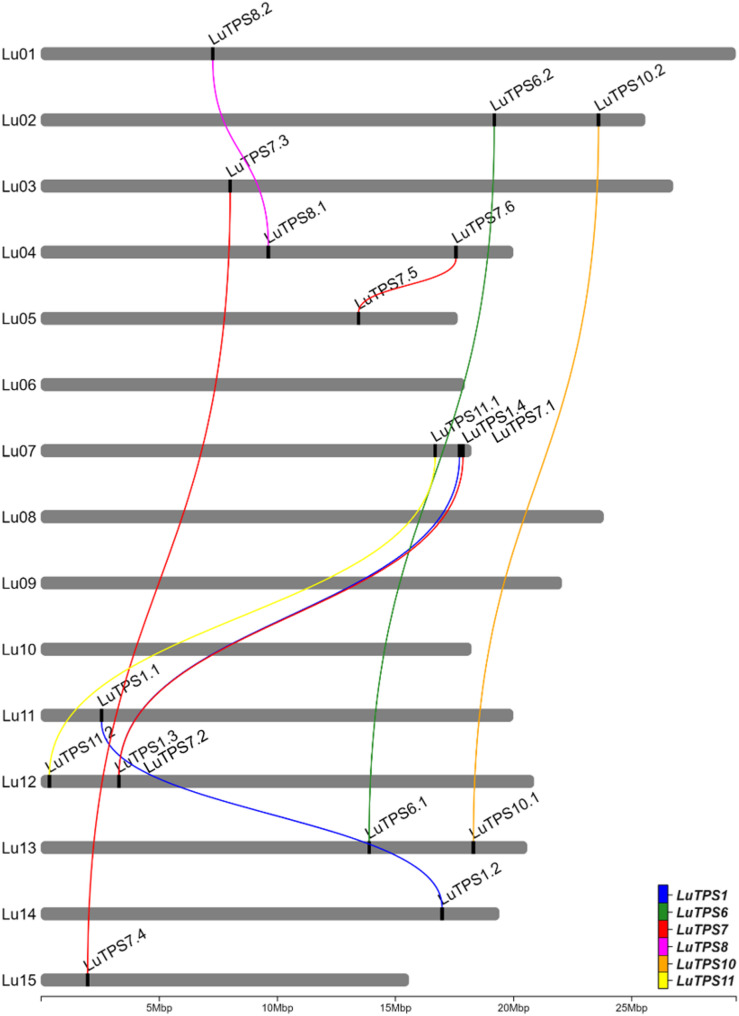 Figure 1
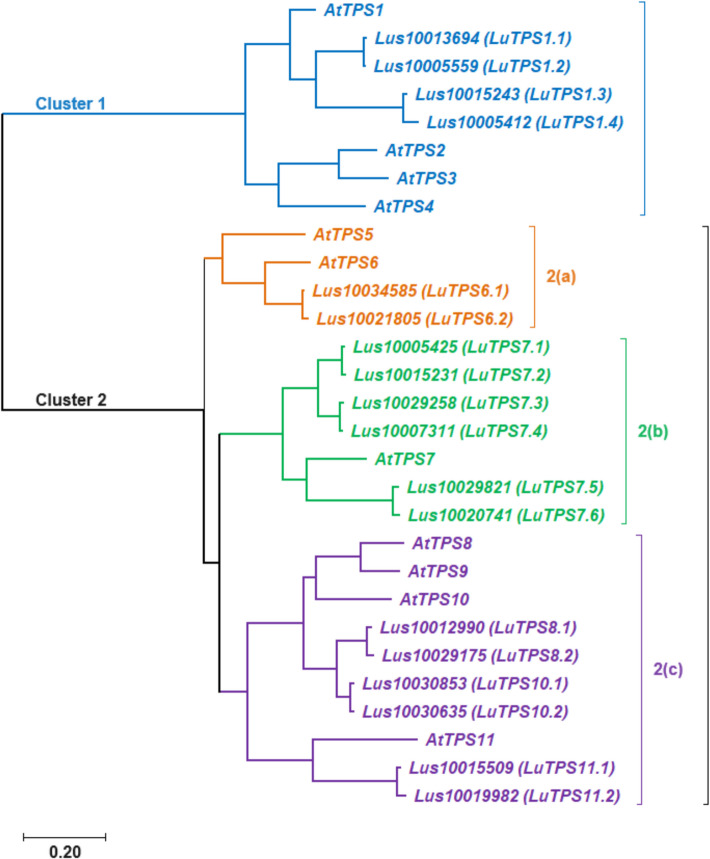 Figure 2
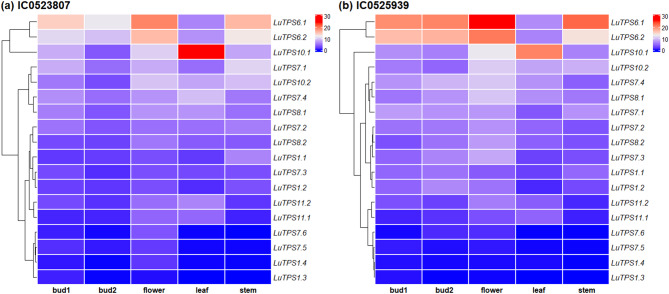 Figure 3
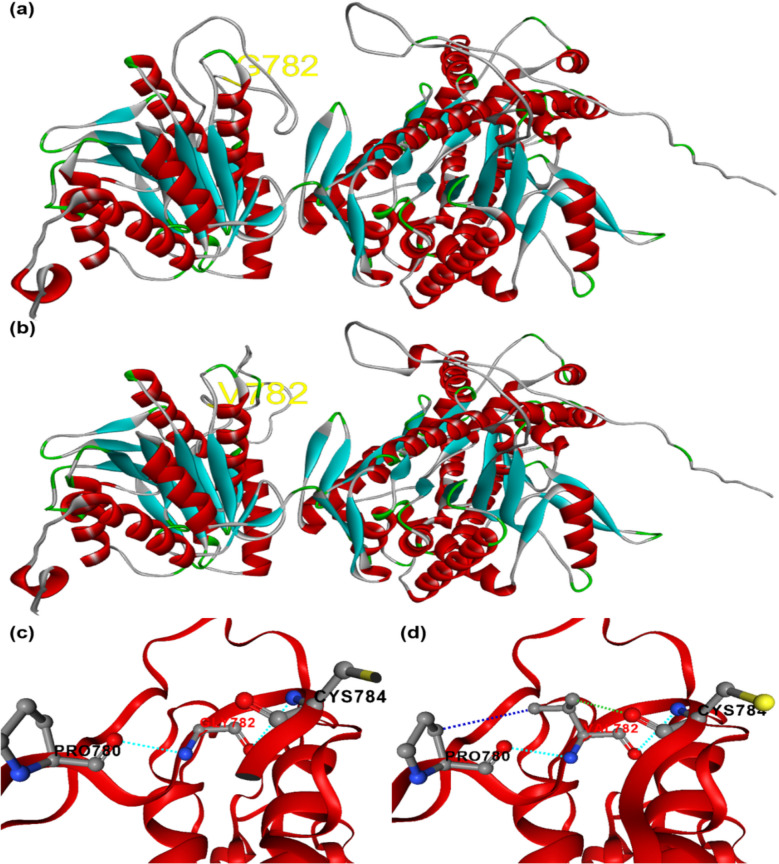 Figure 4
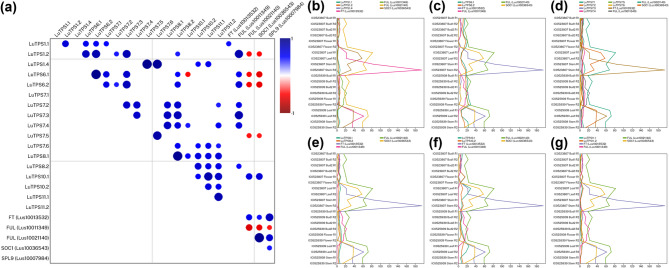 Figure 5
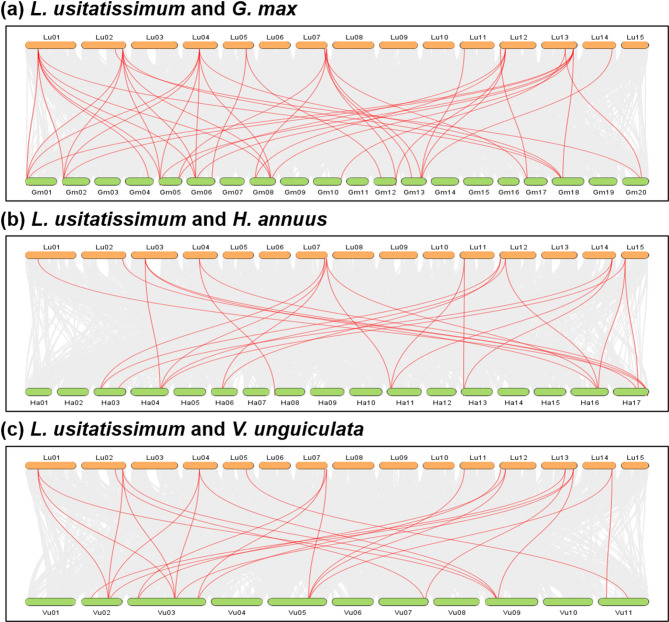 Figure 6
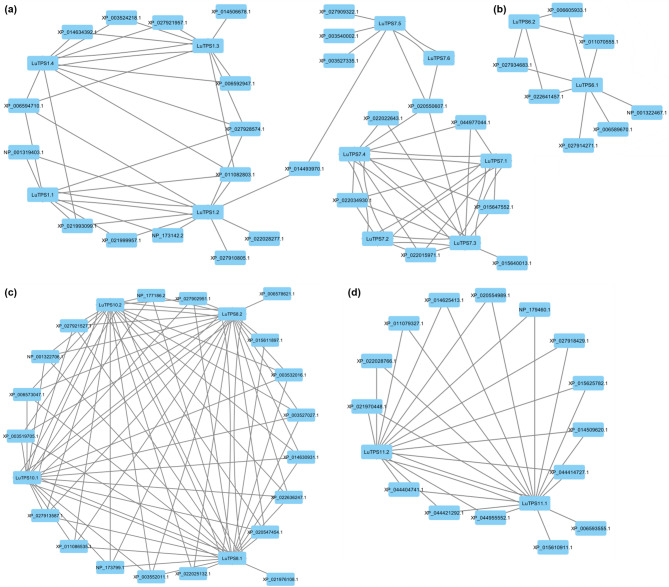 Figure 7
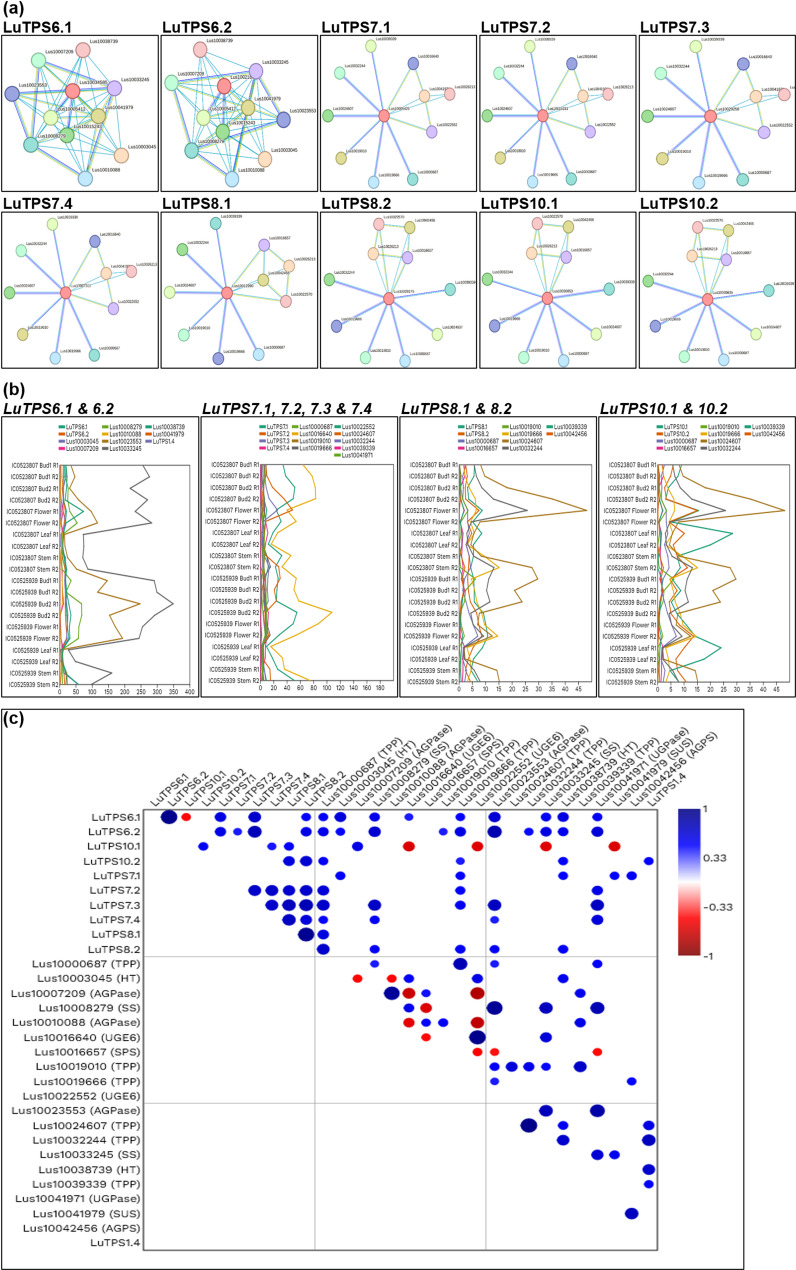 Figure 8
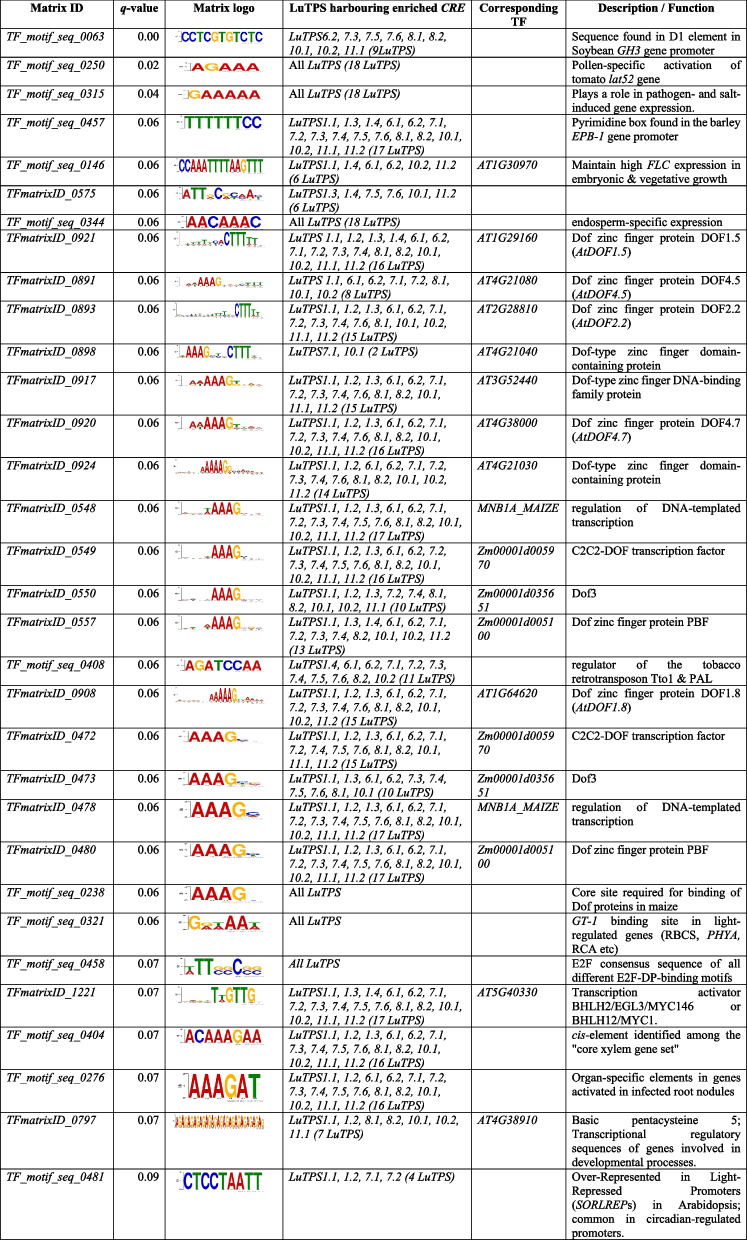 Figure 9
Peer Reviews
No public reviews on file for this paper yet. If you reviewed it on a platform where reviews are public (OpenReview, ICLR, NeurIPS, ICML), you can paste yours below so the community can read it here.
Videos
No videos yet. Explain this paper in a talk, walkthrough, or lecture? Add one.
Taxonomy
TopicsPlant Molecular Biology Research · Plant nutrient uptake and metabolism · Polysaccharides and Plant Cell Walls
Background
Linseed, also known as flaxseed, (Linum usitatissimum L.) (2n = 2x = 30) is an annual herbaceous plant from the Linaceae family and is notable for its dual-use potential in food and industry [1]. Linseed is cultivated globally, and countries including Canada, Kazakhstan, Russia, China, USA, and India are the major producers. The seeds are rich in α-linolenic acid (ALA), a polyunsaturated omega-3 fatty acid, as well as lignans and dietary fiber, contributing to their growing use in nutraceuticals and functional foods [2]. Industrially, linseed is a key raw material in the production of linseed oil, which is extensively used in the manufacture of paints, varnishes, inks, and linoleum flooring due to its quick-drying and polymer-forming properties [2]. There is renewed interest in linseed reflecting the global trade of $1.44B in 2023 (https://oec.world/en/profile/hs/linseed).
Linseed exhibits two major morphotypes, ‘oilseed type’, characterized by a shorter, bushier growth habit, and ‘fiber type’, which has a taller, slender morphology optimized for fiber extraction [3, 4]. Flowering time is a critical agronomic trait in linseed, with early flowering and maturity being desirable particularly for the oilseed types, under rainfed conditions and rice fallow systems, such as those prevalent in India [5]. It also avoids abiotic stress such as terminal drought and heat, which have a negative impact on seed set, yield, and oil quality [6]. Early flowering is also advantageous to avoid frost and for expanding the cultivation range of flaxseed into cooler regions, including the northern prairies of Canada [7–9].
Flowering is a complex, quantitative trait influenced by genetic, environmental, and epigenetic factors. The intricate genetic network that determines initiation of flowering depends on environmental (day length, temperature, etc.) and endogenous signals (hormones and carbohydrate status, etc.) [10]. Six major flowering pathways have been identified in Arabidopsis, which are vernalization, photoperiod, autonomous, thermosensory, age and gibberellin (GA) pathways [11]. In the photoperiod pathway, flowering is regulated by day length and quality of light perceived. These pathways involve the key players such as CONSTANS (CO), FLOWERING LOCUS T (FT), SUPPRESSOR OF OVEREXPRESSION OF CONSTANS 1 (SOC1), LEAFY (LFY), GIGANTEA (GI), FLAVIN-BINDING, KELCH REPEAT, F-BOX 1 (FKF1), APETALA1 (AP1), FLOWERING LOCUS C (FLC), etc. [11–14].
In addition to the canonical flowering pathways and genes, there is strong evidence supporting the role of carbohydrates such as sucrose, glucose, and trehalose-6-phosphate (T6P) in the induction of flowering in Arabidopsis [15–17]. Trehalose, a non-reducing disaccharide (composed of two glucose molecules) is present in many species, including bacteria, yeast, fungi, invertebrates, and plants, albeit in trace amounts. Enzyme trehalose-6-phosphate synthase (TPS) catalyzes the transfer of glucose from uridine diphosphate-glucose (UDPG) to glucose-6-phosphate (G6P), resulting in the formation of T6P. Subsequently, T6P is dephosphorylated by trehalose phosphate phosphatase (TPP) to produce trehalose [18, 19]. T6P functions as a critical signaling molecule in plants, relaying carbohydrate status to other signaling pathways and is often referred to as a "central hub in carbon signaling" [20]. It plays a vital role in various aspects of plant growth and development, including energy metabolism, stress responses, and floral transition, etc. It has also been implicated in the regulation of plant embryonic and vegetative development, flowering time regulation, meristem determinacy, and cell fate specification [21–24]. Although trehalose and trehalose-6-phosphate (T6P) are found only in trace levels in higher plants and have mostly lost their functions to sucrose, altering trehalose metabolism results in a number of different effects, such as reduced stress tolerance, changed leaf morphology, and embryo lethality, demonstrating that trehalose metabolites have crucial regulatory roles in plants metabolism [25, 26].
The role of T6P in flowering time regulation is well studied in model plant Arabidopsis [24, 27, 28]. The loss of AtTPS1 activity causes Arabidopsis to flower extremely late even under inductive environmental conditions [24]. In Arabidopsis, T6P levels have been found to increase in response to changes in photoperiod, with higher levels promoting early flowering under long-day conditions. Conversely, under short-day conditions, T6P levels decrease, leading to delayed flowering [27]. Specifically, the T6P pathway operates within the photoperiod-inductive pathway, acting upstream of FLOWERING LOCUS T (FT) and TWIN SISTER OF FT (TSF) and is essential for the transition to flowering in the shoot apical meristem (SAM) and the induction of the florigen FT in leaves [24].
The TPS gene family has been identified in a wide range of plant species, including Arabidopsis, rice, and cotton [29–31]. The widespread presence of this gene family suggests that T6P signaling may be a common mechanism regulating flowering across different plant species. Similar to Arabidopsis, linseed is a facultative long day plant which flowers earlier under long days, however, eventually flowers under short days, albeit at a slower rate [32, 33].
In linseed, genotypic differences in photoperiod response have been reported [8, 34–36];, however, there are limited studies dissecting the regulation of flowering time in linseed [37–39]. Therefore, it is imperative to investigate the role of T6P in flowering time regulation in linseed. In the present study, the TPS gene family in linseed is identified and characterized, and its potential role in regulating flowering time is investigated.
Materials and methods
Identification and characterization of the linseed TPS gene family
Protein sequences of already identified TPS genes from diverse plant species, including Arabidopsis thaliana (11 sequences), Oryza sativa (11 sequences), Gossypium spp. (G. arboreum—14, G. hirsutum—24, G. raimondii—15), and Solanum tuberosum (8 sequences) were retrieved from the National Center for Biotechnology Information (NCBI) database. Further, the protein sequences of linseed were obtained from the Phytozome database (https://phytozome-next.jgi.doe.gov/). An HMM profile of TPS proteins was constructed using HMMER software [40] and employed to query the linseed protein sequences. The hits were screened for the presence of conserved domains using the NCBI batch CD-search tool (https://www.ncbi.nlm.nih.gov/Structure/bwrpsb/bwrpsb.cgi) [41]. Only the sequences possessing TPS gene family-specific conserved domains were considered as TPS genes. Subcellular localization of the linseed TPS genes was predicted using the WoLF PSORT tool (https://wolfpsort.hgc.jp) [42]. Physicochemical properties such as molecular weight, isoelectric point (pI), etc. were predicted using the ProtParam tool (https://web.expasy.org/protparam) [43], and the phosphorylation site prediction was performed using the ScanProsite tool (https://prosite.expasy.org/scanprosite) [44].
Phylogenetic analysis and nomenclature
Multiple sequence alignment of the linseed TPS (LuTPS) protein sequences along with Arabidopsis TPS protein sequences was performed using t-coffee software version 13.41.0.28bdc39 [45]. A pairwise distance matrix between Arabidopsis and linseed TPS proteins was computed using MEGA 11 [46]. Each LuTPS gene was then named according to its closest Arabidopsis ortholog, as identified in the pairwise distance matrix. Subsequently, a phylogenetic tree was constructed employing the Maximum Likelihood (ML) method implemented in MEGA 11.
Expression analysis of LuTPS genes
Expression analysis of LuTPS genes was conducted using the available transcriptome data of two early flowering-maturing germplasm accessions IC0523807 and IC0525939 (BioProject ID: PRJNA773597). The seed samples of these accessions were obtained from the National Genebank of India (NGB), Indian Council of Agricultural Research-National Bureau of Plant Genetic Resources (ICAR-NBPGR), New Delhi, India. The accessions conserved in NGB, India are accessible for research purposes following the standard material transfer agreement and as per the terms and conditions (https://nbpgr.org.in/nbpgr2023/germplasm-exchange-2/). The analysis included samples from the floral bud at two developmental stages, flower, leaf, and stem tissues. Normalized gene expression data, measured in transcripts per million (TPM), was used to examine the expression levels of TPS genes and plotted using ComplexHeatmap v2.10.0 [47] in the ‘R’ software environment. The expression-expression correlation between the LuTPS genes with major flowering genes and protein–protein interacting partners was analyzed using Pearson's correlation in the 'R' programming environment.
Allele mining of LuTPS genes
Allele mining of LuTPS genes was carried out using whole genome resequencing data (paired-end short reads, Illumina NovaSeq platform) of two early (IC0523807, IC0525939) and two late-flowering accessions (EC0115148, EC0718827) (BioProject accession number: PRJNA1207411). The seed samples of the mentioned accessions were obtained from NGB, ICAR-NBPGR, New Delhi, India. The quality of sequencing reads was evaluated using FastQC tool [48]. Low-quality reads, along with adapter sequences and other contaminants, were removed using Trimmomatic tool v0.39 [49]. The cleaned reads were aligned to the reference genome using the ‘very-sensitive-local’ algorithm of Bowtie2 [50]. The resulting SAM files were converted to BAM format, and subsequently sorted, filtered, and indexed using SAMtools [51]. Reference-based SNP calling was performed against the linseed reference genome assembly ASM22429v2 (https://www.ncbi.nlm.nih.gov/datasets/genome/GCA_000224295.2/) [52] using the ‘mpileup’ function of the BCFtools [51]. A quality score threshold of ≥ 30 and a minimum read depth of ≥ 5 were applied for SNP variant calling.
In-silico homology modeling and structural analysis
To assess the potential impact of amino acid substitutions on the three-dimensional (3D) structure of the TPS protein (LuTPS10.2), homology-based modeling was conducted using the SWISS-MODEL server (https://swissmodel.expasy.org/) [53]. For model generation, the template alpha, alpha-trehalose-phosphate synthase of Glycine max (UniProt id- I1N1F3; AlphaFold identifier, AF-I1N1F3-F1) was used which showed sequence identity of 76.89%, and 96% of the query coverage. The quality score of the generated models by the Global Model Quality Estimate (GMQE) was 0.831, which reflects high model reliability. Separate 3D models were constructed for the original protein (without amino acid substitutions) and another incorporating the specific amino acid substitution of interest. Potential energy of both the modeled protein structures was calculated using MutationExplorer tool (https://mutationexplorer.vda-group.de/mutation_explorer/) [54].
Identification and enrichment of cis-regulatory elements
Cis-regulatory elements (CREs) on 2 kb promoter sequences from the start codon of 18 LuTPS genes were identified, and their enrichments were studied by comparing their abundance against the 2 kb promoter sequences of 37,999 genes in the linseed genome to identify potential CREs that may influence the expression of LuTPS genes. The 2 kb promoter sequences starting from the start codon were extracted for all the annotated genes in the linseed genome (linseed reference genome assembly ASM22429v2 (https://www.ncbi.nlm.nih.gov/datasets/genome/GCA_000224295.2/) [52] using bedtools [55]. Promoter sequences shorter than 500 base pairs or containing more than 1,500 ‘NNNs’ were excluded from the analysis, resulting in a final set of 37,999 sequences for examination. Position weight matrix (PWM) data for 2,254 transcription factor binding sites (TFBSs) were downloaded from the Plant PAN 3.0 database (http://plantpan.itps.ncku.edu.tw/plantpan3/) [56] and used in conjunction with the PWMEnrich package in ‘R’ software to predict the distribution of CREs within the 2 kb promoter sequences of 37,999 linseed genes (background). The log-normal distribution of CREs within the 2 kb promoter sequences of the 18 LuTPS genes was then compared against the background distribution observed across the entire set of 37,999 linseed genes. A significance threshold of q-value ≤ 0.1 was applied to identify statistically significantly enriched CREs within the LuTPS gene promoters.
Synteny analysis
A comparative synteny analysis of LuTPS genes was conducted with nine additional plant species representing diverse taxonomic groups comprising three oilseed crops (Arabidopsis thaliana, Helianthus annuus, Sesamum indicum), three cereal crops (Hordeum vulgare, Oryza sativa, Triticum aestivum), and three pulse crops (Glycine max, Vigna radiata, Vigna unguiculata). The complete set of annotated protein sequences (primary transcripts only) and corresponding GFF3 files specifying gene positions were downloaded from Phytozome for linseed and from NCBI for the other nine species. In instances where multiple transcript variants existed for a given gene, the longest transcript was used for the analyses. To identify potential orthologous gene pairs across species, pairwise BLAST analyses were performed for all possible combinations of the ten genomes, resulting in a total of 90 pairwise comparisons. Only the top five BLAST hits were considered for each gene. The co-localization of genes on chromosomes (synteny) across the ten plant species was studied using MCScanX software [57] with default settings (match score ≥ 50, match size ≥ 5 genes, gap penalty = −1, overlap window = 5, e-value ≤ 1e-05, and maximum gaps = 25). Subsequently, the synteny file generated by MCScanX was filtered to identify conserved syntenic blocks (CSBs) specifically encompassing the LuTPS genes. Genome-level synteny between linseed and the nine crops was visualized using SynVisio tool (https://synvisio.github.io/) [58], and the filtered CSBs (highlighting those containing LuTPS genes within genomic collinearity) were visualized using TBtools [59]. Gene collinearity networks (GCNs) for LuTPS genes were constructed with Cytoscape software [60].
Protein–protein interaction
To understand protein–protein interacting partners of linseed TPS, the whole proteome of linseed (43,484 protein sequences) was uploaded to the STRING database and annotated. The interaction networks were generated based on the annotated proteome in the STRING database (https://version-12-0.string-db.org/organism/STRG0A33KPV) and the protein–protein interaction network of individual TPS was retrieved. The functional annotation of the interacting partners was performed using the PANNZER2 tool [61].
Results
Identification and in silico characterization of LuTPS gene family
A total of 18 LuTPS genes were identified in silico, distributed across 11 of the 15 linseed chromosomes, excluding Lu06, Lu08, Lu09, and Lu10 (Fig. 1, Table 1). The LuTPS proteins ranged from 800 (LuTPS11.2) to 971 (LuTPS1.1) amino acids long. The predicted isoelectric point (pI) values varied from 5.50 (LuTPS7.6) to 7.05 (LuTPS1.1), with an average pI of 6.08. The predicted localization of the LuTPS proteins varied across different cellular compartments, with the majority localized in the chloroplast (7 proteins), followed by cytoplasm (5 proteins), nucleus (5 proteins), and one in vacuole. The highest number of phosphorylation sites was predicted for LuTPS1.3 and LuTPS1.4 (47 each), followed by LuTPS6.1 and LuTPS6.2 (38 each), and LuTPS1.1 and LuTPS1.2 (34 each), whereas the lowest number of phosphorylation sites was found in LuTPS7.1 and LuTPS7.2 (23 each) (Table 1). The LuTPS1 paralogs exhibited the most complex gene structures, with LuTPS1.1 containing 16 exons and LuTPS1.2, LuTPS1.3, and LuTPS1.4 each containing 17 exons. In contrast, other LuTPS genes displayed simpler structures, with exon numbers ranging from 2 (LuTPS10.2) to 4 (LuTPS11.2) (Figure S1).Fig. 1. Chromosomal positions of trehalose-6-phosphate synthase genes in linseed and their paralogues. Lines connecting TPS genes indicate paralogous relationTable 1List of identified TPS genes in linseed and its in-silico characterizationGene IDNameArabidopsisorthologSubcellular localizationProtein lengthMol. weight (KDa)pIPhosphorylation sitesAmidation sitesASN Glycosylation sitesCK2PKCTYRCAMP*Lus10013694LuTPS1.1At1g78580Chloroplast971109.267.0516160235Lus10005559LuTPS1.2At1g78580Chloroplast939105.886.9316150335Lus10015243LuTPS1.3At1g78580Chloroplast946106.376.5126190226Lus10005412LuTPS1.4At1g78580Vacuole957107.966.6926190236Lus10034585LuTPS6.1At1g68020Nucleus85597.185.6518161311Lus10021805LuTPS6.2At1g68020Nucleus85597.145.6016181311Lus10005425LuTPS7.1At1g06410Chloroplast84996.246.041380202Lus10015231LuTPS7.2At1g06410Chloroplast84996.176.101380202Lus10029258LuTPS7.3At1g06410Chloroplast85396.285.711590300Lus10007311LuTPS7.4At1g06410Chloroplast85396.445.761590301Lus10029821LuTPS7.5At1g06410Cytoplasm83895.195.531870113Lus10020741LuTPS7.6At1g06410Cytoplasm83895.235.501960114Lus10012990LuTPS8.1At1g70290Cytoplasm86598.126.0112101112Lus10029175LuTPS8.2At1g70290Cytoplasm86597.956.1112110102Lus10030853LuTPS10.1At1g60140Cytoplasm86497.745.9013100212Lus10030635LuTPS10.2At1g60140Nucleus897101.335.9011120112Lus10015509LuTPS11.1At2g18700Nucleus85096.366.2515111100Lus10019982LuTPS11.2At2g18700*Nucleus80090.756.1315101100
Phylogenetic analysis and nomenclature of linseed TPS
The LuTPS genes were named according to their closest Arabidopsis orthologs as identified in the pairwise distance matrix. In cases where multiple linseed genes showed similarity to the same Arabidopsis TPS, they were designated with numerical suffixes indicating their relative similarity to the Arabidopsis ortholog (Table 1). For phylogenetic analysis of LuTPS, the protein sequences of 18 LuTPS along with 11 AtTPS were aligned using t-coffee, and a phylogenetic tree was constructed using the ML method implemented in MEGA 11. The linseed TPS, along with Arabidopsis TPS, clustered into two distinct groups, Cluster 1 and Cluster 2 (Fig. 2). The LuTPS1 paralogues (LuTPS1.1, LuTPS1.2, LuTPS1.3, LuTPS1.4) were found in Cluster 1, alongside the AtTPS1. Cluster 1 also included AtTPS2, AtTPS3, and AtTPS4. Cluster 2 was further divided into three subclusters, 2a, 2b, and 2c. Subcluster 2a contained LuTPS6.1 and LuTPS6.2, along with AtTPS6, as well as AtTPS5. Subcluster 2b was exclusively composed of LuTPS7 (LuTPS7.1, LuTPS7.2, LuTPS7.3, LuTPS7.4, LuTPS7.5, LuTPS7.6) together with AtTPS7. Subcluster 2c included paralogues of LuTPS8 (LuTPS8.1, LuTPS8.2), LuTPS10 (LuTPS10.1, LuTPS10.2), and LuTPS11 (LuTPS11.1, LuTPS11.2), which clustered alongside AtTPS8, AtTPS10, AtTPS11, and AtTPS9.Fig. 2. Phylogenetic analysis of trehalose-6-phosphate synthase (TPS) genes from linseed and Arabidopsis thaliana. The TPS genes are grouped into two major clusters, reflecting their evolutionary relationships
Expression analysis of LuTPS genes in vegetative and reproductive tissues
Gene expression profiles of the LuTPS genes in linseed were analyzed from the available transcriptome sequence data across four different tissues, bud at two developmental stages (bud1, bud2), flower, leaf, and stem, using RNA sequencing data from two early flowering-maturing accessions, IC0523807 and IC0525939. LuTPS6.1, LuTPS6.2, and LuTPS10.1 showed relatively higher expression in all the studied tissues including floral buds, flowers, leaf and stem in both the accessions. LuTPS10.1 showed conspicuously high expression in leaf in both the accessions (Fig. 3a, b). Most of the LuTPS genes except LuTPS1.3, LuTPS1.4, LuTPS7.5, and LuTPS7.6 were found expressed in one or more studied tissue types in both the accessions. A few genes showed high expression across all tissues in both the early flowering accessions which included LuTPS7.1, LuTPS7.2, LuTPS7.3, LuTPS7.4, LuTPS8.1, LuTPS8.2, LuTPS10.1, and LuTPS10.2. In contrast, LuTPS1.1, LuTPS1.2, LuTPS11.1, and LuTPS11.2 exhibited relatively higher expression in flower compared to other reproductive and vegetative tissues. Overall, the top most expressing LuTPS genes were LuTPS6.1, LuTPS6.2, and *LuTPS10.1.*Fig. 3. Gene expression profiles of TPS genes in reproductive and vegetative tissues of early-flowering linseed genotypes IC0523807 and IC0525939 based on transcriptome data. Gene names are displayed on the right, with expression-based hierarchical clustering shown on the left. The color gradient from red to blue represents transcript abundance in TPM (Transcripts Per Million), ranging from high to low expression levels
To further pinpoint the potential linseed TPS genes involved in flowering regulation linseed, TPS gene expressions was compared to that of gene expression of important flowering regulators including FLOWERING LOCUS T (FT) (Lus10013532), FRUITFULL (FUL) paralogs (Lus10011349, Lus10021140), SUPPRESSOR OF OVEREXPRESSION OF CONSTANS 1 (SOC1) (Lus10036543)**, Squamosa Promoter Binding Protein-Like 9 (SPL9) (Lus10007984) using the transcriptome of floral buds at two stages, flowers, leaves and stem of two early flowering linseed accessions IC0523807 and IC0525939 (Fig. 4). A positive correlation of FT was observed only with LuTPS1.1; while FUL (Lus10011349) showed positive correlation with LuTPS1.2, LuTPS6.1, LuTPS6.2, LuTPS7.2, LuTPS7.3, LuTPS7.4 and LuTPS8.2, indicating possible functional redundancy*.* Interestingly, LuTPS10.1 was the only gene which showed positive correlation with expression of the other FUL paralog (Lus10021140) and SOC1. There was no significant correlation of any TPS gene expression to that of SPL9, indicating no probable role of the latter in regulating TPS gene expression.
Fig. 4. Homology-based 3D structures of the LuTPS10.2 protein variant in linseed, showing the amino acid substitution at position 782: (a) GLY-782 in late-flowering genotypes and (b) VAL-782 in early-flowering genotypes. Intramolecular interactions of the LuTPS10.2 variants are illustrated for (c) GLY-782 and (d) VAL-782
Allelic variation in LuTPS genes in early and late linseed accessions
To investigate the allelic variations in LuTPS gene family, available whole genome sequencing data of two early flowering-maturing (IC0523807, IC0525939) and two late flowering-maturing (EC0115148, EC0718827) linseed germplasm accessions (Bio-project ID-PRJNA1207411; Table S1) was used and the reference-based SNP calling was performed. Trait-specific SNPs (those capable of distinguishing between early and late flowering-maturing accessions) were identified in two genes, LuTPS6.1 (3 SNPs: 2 SNPs in exons, 1 SNP in intron) (Table 2), and LuTPS10.2 (3 SNPs, all in exons) (Table 3). Both the exonic SNPs in LuTPS6.1 gene were synonymous in nature and therefore had no alteration in the protein sequence. Additionally, in the promoter sequence of the LuTPS6.1 gene, a total of 16 SNPs/indels were identified (Table 2). However, these variations in the promoter region did not exhibit any clear pattern associated with early or late flowering phenotypes. In LuTPS10.2, from the 3 SNPs, one SNP was non-synonymous at nucleotide position 2439 (‘G’ in late flowering-maturing group changed to ‘T’ in early flowering-maturing group) which resulted in an amino acid substitution, Glycine (a non-polar amino acid) to Valine (an aliphatic and hydrophobic amino acid) at position 782 in the resulting protein (Table 3, Figure S2). The other two SNPs were synonymous, causing no change in the protein sequence. Further, in the promoter sequence of LuTPS10.2, a total of 9 SNPs, and 18 indels were identified (Table 3). Of these, 10 SNPs exhibited phenotype-specific patterns, differing between early and late flowering-maturing accessions. Further, two insertions of 2 and 11 nucleotides (at position −1117 to −1116 and −627 to −617, respectively) and a single nucleotide deletion (at position−685) were observed in both early flowering accessions.Table 2SNP haplotype of LuTPS6*.1* gene along with 2 kb promoter sequence in 2 early and 2 late flowering-maturing germplasm accessions of linseed. SNPs highlighted in bold font can differentiate between early and late flowering-maturing accessionsNucleotidepositionCDCBethune(Reference)Late flowering-maturingEarly flowering-maturingEC0115148EC0718827IC0523807****IC0525939−1903GGGAG−1812CTCTT−1529AA-AA−1528CC-CC−1484GGAGG−1289AA-AA−1288TT-TT−1287AA-AA−1286AA-AA−1285AA-AA−1284AA-AA−1283AA-AA−1253AGAGG−286TTT-T−285CCC-C−284TTT-T1143GAAGG1716GTTGG2418TCCT****TTable 3SNP haplotype of LuTPS10.2 gene along with 2 kb promoter sequence in 2 early and 2 late flowering-maturing germplasm accessions of linseed. SNPs highlighted in bold font can differentiate between early and late flowering-maturing accessionsNucleotidepositionCDCBethune(Reference)Late flowering-maturingEarly flowering-maturingEC0115148EC0718827IC0523807IC0525939−1989CCCGG−1974CCCTT−1960CCCTT−1951GGGAA−1886GGGAA−1878TTTCC−1796GGGA****A−1735CCTCC−1458TTTT-−1457AAAA-−1456AAAA-−1455AAAA-−1117****---CC****−1116****---TT−984CCCTC**−685TTT--−627****---CC****−626****---AA****−625****---AA****−624****---TT****−623****---GG****−622****---TT****−621****---GG****−620****---AA****−619****---GG****−618****---TT****−617****---TT1063CCCTT2439GGGTT2624AAAGG**
Effect of amino acid substitution on 3D structure of TPS protein
To evaluate the impact of the amino acid substitution on the LuTPS10.2 protein's 3D structure, homology-based modeling was performed and the 3D structures of both the original protein (prior to amino acid substitution) and the modified protein (after substitution) were predicted and compared to evaluate any structural changes (Fig. 5a-d). Notably, the proteins from the early flowering-maturing group demonstrated an increase in intramolecular interactions, which typically enhances protein stability (Fig. 5c, d). The substitution of ‘G’ with ‘V’ in the early flowering-maturing group led to a significant reduction in potential energy, contributing to a stabilizing effect on the proteins within these accessions (Table 4).Fig. 5. Correlation of expression of TPS genes and key flowering genes FT (Lus10013532), FUL paralogs (Lus10011349, Lus10021140), SOC1 (Lus10036543) and SPL9 (Lus10007984) in linseed*.* a Pairwise correlation between gene pairs. Color gradient of the circle from blue to red denotes positive to negative correlation. Size of the circle indicates the strength of p value. b, g Line plots depicting the normalized expression (Transcripts per Million) of TPS paralogs and flowering genes across tissues, floral bud 1, bud 2, flower, leaves, and stem in early-flowering linseed accessions IC0525939 and IC0523807. Expression data under NCBI, BioProject ID PRJNA773597 was usedTable 4Potential energy of LuTPS10.2 protein before and after amino acid substitution in late and early flowering-maturing accessionsAccessionPotential energy(kcal/mol)AccessionPotential energy(kcal/mol)Difference(kcal/mol)Effect of mutationEC0115148,EC0718827−708.44IC0523807,IC0525939−715.47−7.03Stabilizing
Analysis of CREs in LuTPS genes and their enrichment
2 kb promoter sequences upstream of the start codon of 37,999 linseed genes were extracted from the linseed genome assembly. The position weight matrix data of 2,254 TF binding sites (TFBS) from the PlantPAN 3.0 database were used to predict the occurrence of CRE motifs within these promoter sequences. The CREs within the 2 kb promoter regions of 18 LuTPS genes were identified, and their enrichment was assessed by statistically comparing their frequency against the background frequency across the entire linseed genome (37,999 genes). A total of 32 CREs were identified as significantly enriched in the promoter sequences of LuTPS genes compared to the average genomic distribution at a threshold of *q-*value ≤ 0.1 (Table 5). Among the significantly enriched CREs, flowering and photoperiod related CREs included TF_motif_seq_0250, TF_motif_seq_0146, TF_motif_seq_0321, TFmatrixID_1221, TFmatrixID_0797, and TF_motif_seq_0481. It is intriguing to note that from the 32 enriched CREs, at least 15 were related to Dof-type domain-containing protein (Table 5). In addition, the promoter sequences of individual LuTPS genes were also analyzed for the presence of CREs using the PlantPAN4 database [62]. The analysis identified a total of 104 CREs, each present at least once in the promoter region of every LuTPS gene (Table S3). It is also important to highlight that six of the enriched CREs (TF_motif_seq_0250, TF_motif_seq_0315, TF_motif_seq_0344, TF_motif_seq_0238, TF_motif_seq_0321, and TF_motif_seq_0458) were consistently present in the promoter of all TPS genes in linseed (Table 5, Table S3).Table 5. List of cis-regulatory elements enriched in LuTPS promoter sequences
Genome scale syntenic network analysis of linseed and nine other plant genomes
To understand synteny of TPS genes in different crop plants, The genome scale syntenic network analysis of linseed and nine other plants representing cereals, oilseeds, pulses, and a model plant species (Arabidopsis, rice, barley, wheat, sesame, sunflower, soybean, greengram, and cowpea) was performed. A total of 68,930 conserved syntenic blocks (CSBs) were identified in the studied 10 plant species (Table 6). Among the comparisons, the highest number of CSBs involving linseed was found with soybean, (3,673 CSBs), followed by sunflower (2,159), cowpea (2,092), and sesame (2,018) while barley exhibited the fewest CSBs with linseed (588) (Fig. 6, Figure S3, Table 6). Notably, 179 of the 68,930 CSBs contained at least one LuTPS gene (Table 7). The highest number of LuTPS-containing CSBs was observed between linseed and soybean (43), followed by cowpea (25), sunflower (24), and sesame (22). Linseed itself had 15 intraspecific CSBs with gene counts per CSB ranging from 9 to 399 (Fig. 6, Table 7).Table 6. Number of total CSBs identified among the 10 crops under study. The numbers in parentheses indicate the size (number of genes) of the smallest and largest CSBs. The numbers in curly braces denote the count of CSBs in the plus and minus orientations, respectivelyAtGmHaHvLuOsSiTaVr****VuAt231(6—196){102/129}2443(5—94){1214/1229}1434(6—56){721/713}312(6—21){161/151}1968(6—74){1019/949}513(6—22){253/260}1252(6—120){650/602}907(6—21){472/435}1162(6—84){558/604}1305(6—99){661/644}Gm1038(6—939){529/509}2859(5—131){1414/1445}1128(6—26){563/565}3673(5—107){1848/1825}1567(6—29){772/795}2368(6—211){1219/1149}3188(6—26){1581/1607}1776(5—690){916/860}1715(5—1127){886/829}Ha720(6—151){390/330}318(6—22){164/154}2159(6—64){1116/1043}524(6—25){288/236}1607(6—126){847/760}883(6—24){483/400}1380(6—87){674/706}1552(6—125){792/760}Hv112(6—98){58/54}588(6—35){302/286}525(5—873){265/260}655(6—49){354/301}1382(5—2585){707/675}501(6—38){255/246}638(6—36){343/295}Lu811(5—916){421/390}883(6—35){424/459}2018(6—133){1042/976}1662(6—38){798/864}1798(5—116){908/890}2092(6—118){1065/1027}Os193(6—437){111/82}900(6—52){470/430}1629(5—842){842/787}679(6—40){352/327}874(6—44){427/447}Si287(6—152){149/138}1850(6—48){1010/840}1129(5—153){569/560}1237(6—176){618/619}Ta1853(5—2878){994/859}1398(6—34){684/714}1789(6—34){901/888}Vr261(6—141){131/130}863(5—788){425/438}Vu341(6—247){170/171}At: Arabidopsis, Gm: Soybean, Ha: Sunflower, Hv: Barley, Lu: Linseed, Os: Rice, Si: Sesame, Ta: Wheat, Vr: Greengram, Vu: CowpeaFig. 6Genome-wide synteny analysis of linseed with soybean (Glycine max) (a), sunflower (Helianthus annuus) (b), and cowpea (Vigna unguiculata) (c). The genome wide conserved syntenic blocks (CSB) between the two species are depicted in grey shade, and the CSBs harbouring linseed TPS are shown with red linesTable 7Number of CSBs containing at least one LuTPS gene. The numbers in parentheses indicate the size (number of genes) of the smallest and largest CSBs. The numbers in curly braces denote the count of CSBs in the plus and minus orientations, respectivelyAtGmHaHvLuOsSiTaVr****VuLu19(7—39){10/9}43(6—57){19/24}24(6—63){12/12}5(7—9){3/2}15(9—399){6/9}9(6—10){3/6}22(6—66){11/11}6(6—9){3/3}11(7—18){5/6}25(6—57){13/12}At Arabidopsis, Gm Soybean, Ha: Sunflower, Hv: Barley, Lu: Linseed, Os: Rice, Si: Sesame, Ta: Wheat, Vr: Greengram, Vu: Cowpea
Syntenic gene collinearity networks (GCN) of linseed TPS
In order to identify LuTPS-specific syntenic block networks (SBN), the 179 CSBs (containing at least one LuTPS gene) were analyzed using Cytoscape software [48]. Accordingly, the 179 CSBs clustered into four distinct SBNs. The interaction of linseed TPS genes within these four SBNs was visualized as nodes (representing genes) and edges (representing syntenic relationships). Consequently, the linseed TPS genes formed four gene collinearity networks (GCN) (Fig. 7). Each node (gene) within the GCN represents the CSB in which this gene was located, while the edges highlight the syntenic relationships between them. The largest cluster, GCN Cluster-I (Fig. 7a), comprised of 35 genes, including 10 linseed TPS genes, LuTPS1.1, LuTPS1.2, LuTPS1.3, LuTPS1.4, LuTPS7.1, LuTPS7.2, LuTPS7.3, LuTPS7.4, LuTPS7.5, and LuTPS7.6. The remaining genes in this GCN were TPS genes from soybean, sunflower, cowpea, sesame, Arabidopsis, greengram, barley, and rice. The highest syntenic relationship for linseed TPS genes was observed with soybean and sunflower (6 genes each), followed by cowpea (4 genes), sesame (2 genes), Arabidopsis (2 genes), greengram (2 genes), rice (2 genes), and barley (1 gene). Within Cluster-I, subcluster-Ia consists of four linseed TPS genes (LuTPS1.1, LuTPS1.2, LuTPS1.3, and LuTPS1.4). Syntenic relationships were observed between LuTPS1.1 & LuTPS1.2, and between LuTPS1.3 & LuTPS1.4, though no direct connections were found between the two pairs. However, connections were observed with TPS genes from other plants, suggesting an ancient duplication event that led to the divergence of these gene pairs. Subcluster-Ia and subcluster-Ib were connected through a syntenic relationship between LuTPS1.2 and LuTPS7.5, facilitated by a TPS gene from greengram (XP_014493970.1). In subcluster-Ib, two linseed TPS genes*, LuTPS7.5* and LuTPS7.6, displayed direct syntenic relationships. LuTPS7.5 also showed syntenic connections with TPS genes from cowpea and soybean. Subcluster-Ib was linked to Subcluster-Ic through syntenic relationships involving LuTPS7.5 and LuTPS7.6, both of which exhibited synteny with a TPS gene from sesame (XP_020550607.1). Subcluster-Ic comprised four linseed TPS genes (LuTPS7.1, LuTPS7.2, LuTPS7.3, and LuTPS7.4), all of which exhibited direct syntenic relationships with each other, indicating a high degree of conservation within this group. Cluster II was the smallest, with only 9 genes, including two linseed TPS genes, LuTPS6.1 and LuTPS6.2, which did not share direct syntenic interactions (Fig. 7b). Other genes in this cluster were from soybean, cowpea, greengram, sesame, and an Arabidopsis UDP-Glycosyltransferase/trehalose-phosphatase family protein (NP_001322467.1). LuTPS6.1 displayed direct syntenic connections with 7 genes, including the Arabidopsis gene, whereas LuTPS6.2 was connected with TPS genes from soybean, cowpea, greengram, and sesame. Interestingly, this cluster appears specific to dicot species, as no TPS genes from monocots (rice, barley, and wheat) were represented. Cluster III, containing 23 genes, featured four linseed TPS genes, LuTPS8.1, LuTPS8.2, LuTPS10.1, and LuTPS10.2 displaying direct syntenic relationships with one another (Fig. 7c). Other genes in the cluster are from soybean, cowpea, Arabidopsis, sunflower, sesame, greengram, and rice. Notably, wheat and barley TPS genes are absent from this cluster. LuTPS8.1 and LuTPS8.2 both interacted with 18 other TPS genes. The syntenic relationship with the sunflower TPS gene (XP_021976108.1) was specific to LuTPS8.1, while LuTPS8.2 uniquely showed interaction with the soybean TPS gene (XP_006578621.1). Additionally, both LuTPS10.1 and LuTPS10.2 demonstrate syntenic connections with 17 other TPS genes. Cluster IV consists of 17 genes, including two linseed TPS genes, LuTPS11.1 and LuTPS11.2, alongside TPS genes from other species (Fig. 7d). Notably, LuTPS11.1 and LuTPS11.2 exhibited a direct syntenic relationship with each other. Additionally, LuTPS11.1 displayed syntenic connections with all 16 other genes in the cluster, whereas LuTPS11.2 was syntenically linked to 14 genes, with the exceptions being the TPS genes from rice (XP_015610911.1) and soybean (XP_006593555.1). Notably, this cluster included TPS genes from all the ten plant species under study.Fig. 7. Gene collinearity networks (GCNs) derived from conserved syntenic blocks (CSBs) containing TPS genes. Four GCN clusters (I–IV) are shown in panels (a–d). Each node represents a gene, annotated with the corresponding CSB, and edges indicate syntenic relationships between genes
To study if any of the genes in the linseed TPS specific CSBs also show any molecular interactions with TPS, we studied protein–protein interaction (PPI) network of TPS using the STRING database. The potentially interacting partners of each linseed TPS have been given in Table S4. There were a total of 27 unique interacting proteins identified for all 18 linseed TPS. Most linseed TPS paralogues shared the same interacting partners. Three of the interacting proteins, Lus10017984 (Uncharacterized protein), Lus10038739 (Hexosyltransferase), and Lus10041979 (Sucrose synthase) were part of the linseed TPS specific CSBs. Of which, Lus10017984 (Uncharacterized protein) showed PPI with LuTPS1.1, LuTPS1.2, LuTPS11.2. The other proteins, Lus10041979 (Sucrose synthase) showed PPI with 6 linseed TPS (LuTPS1.1, LuTPS1.2, LuTPS1.3, LuTPS1.4, LuTPS6.1, LuTPS6.2), whereas Lus10038739 (Hexosyltransferase) showed PPI specifically with LuTPS6.1, LuTPS6.2 (Table S4, Fig. 8a). From the 18 LuTPS, for the top ten expressing TPS genes (LuTPS6.1, LuTPS6.2, LuTPS10.1, LuTPS10.2, LuTPS7.1, LuTPS7.2, LuTPS7.3, LuTPS7.4, LuTPS8.1, LuTPS8.2) (Fig. 3), PPI network was drawn (Fig. 8a). For these 10 TPS, there were 20 unique interacting proteins, consisting mainly, trehalose 6-phosphate phosphatases, glucose-1-phosphate adenylyltransferase, sucrose-phosphate synthase, hexosyltransferase etc. (Table S5). The co-expression analysis of these TPS genes with the interacting partners was done using the transcriptome data of two early flowering linseed accessions in floral buds at two stages, flowers, leaves and stem (Fig. 8b). Correlation analysis of LuTPS and their respective interacting partners showed significant positive correlation of Lus10038739 (Hexosyltransferase) with six TPS genes, LuTPS6.1, LuTPS6.2, LuTPS10.2, LuTPS7.1, LuTPS7.2, and LuTPS8.2 (Fig. 8c). Interestingly, Lus10041979 (Sucrose synthase) showed significant positive and negative correlation with LuTPS7.1 and LuTPS10.1, respectively. Five of the ten potential interacting partners of LuTPS6.1 and LuTPS6.2 showed positive correlation with them, which included hexosyltransferases (Lus10038739, Lus10003045), starch synthases (Lus1003324, Lus10008279), and glucose-1-phosphate adenylyltransferase (Lus10023553). It is interesting to note that all linseed TPS, except LuTPS6.1 and LuTPS6.2 showed at least one of the interacting partners as trehalose 6-phosphate phosphatase.Fig. 8. LuTPS protein–protein interactions and co-expression with the potential interacting genes. a Protein–protein interaction network of linseed TPS as identified using string database. The central node with red color is TPS protein, other nodes with different colors indicate the interacting protein and edges indicate their interactions. b Co-expression of TPS genes and respective potential interacting partners in floral buds at two developmental stages, flower, leaf and stem in two biological replicates of early flowering linseed genotypes IC0523807 and IC0525939 based on transcriptome data. The gene expression value is in TPM. c Correlation of gene expression of linseed TPS genes and their potential interacting partners. Size of the circle indicates the strength of p value and color gradient of the circle from blue to red denotes positive to negative correlation
Discussion
The TPS gene family in linseed
In the present study, a comprehensive in silico analysis identified 18 TPS genes in the linseed genome, distributed across 11 of its 15 chromosomes (Table 1). Among diploid plant species where the TPS gene family has been identified, linseed with 18 TPS genes represents one of the largest TPS families. TPS gene families in other plants such as Arabidopsis thaliana, Brassica oleracea, Brassica rapa, Oryza sativa, and Solanum lycopersicum consist of 11, 12, 15, 11, and 11 genes, respectively [30, 31, 62–64]. However, as expected, tetraploid species such as Brassica napus and Gossypium hirsutum exhibit relatively larger TPS families, with 30 and 53 genes, respectively [29, 31].
Identification of multiple paralogous genes in linseed suggests a potential functional diversity within this group, as these genes are linked to key regulatory processes, including stress response and carbohydrate metabolism. In Arabidopsis, TPS1 plays a critical role in T6P synthesis, which is a central regulator of carbon allocation and flowering [24]. The multiple orthologs (four TPS1, two TPS6, six TPS7, two TPS8, two TPS10, and two TPS11) identified in linseed suggests a potentially expanded functional role, possibly associated with the plant's response to environmental stress, growth regulation, and development. Further, the presence of multiple paralogous genes in linseed (2 to 6) may point to redundancy or sub-functionalization, where different paralogs perform distinct roles depending on the tissue type or environmental conditions. Notably, TPS genes corresponding to Arabidopsis TPS2, TPS3, TPS4, TPS5, and TPS9 were absent in linseed. The absence of these genes could be an indicator of either lineage-specific gene loss during evolution or a shift in functional requirements in linseed compared to Arabidopsis. This absence might also reflect different evolutionary pressures, where certain trehalose biosynthetic pathways or related regulatory processes have become less essential for the survival and adaptation of linseed in its environmental niche.
Duplication of the LuTPS gene family
Sequence similarity analysis of the LuTPS gene family suggests that the family has undergone one or more duplication events, leading to the expansion of this gene family. The 18 identified LuTPS genes probably originated from the duplication of an ancestral set of LuTPS genes. Each LuTPS gene demonstrates a high degree of sequence similarity with its corresponding paralog (Fig. 1, Table S2). This can be attributed to whole-genome duplication (WGD) events in linseed. Linseed was reported to have undergone two major WGD events, a more recent event estimated to have occurred between 3.7 and 6.8 million years ago, and an ancient event between 23.8 and 44.1 million years ago [52]. The recent WGD event appears to have driven the expansion of the LuTPS gene family, resulting in the 18 identified genes likely derived from the duplication of ancestral TPS genes.
Gene duplication is a well-documented evolutionary mechanism that plays a crucial role in the formation of gene families. This process allows paralogous genes to either retain their original functions, diverge into new functional roles, or adapt to unique regulatory pathways. The high sequence identity observed between LuTPS paralogs indicates that these genes may still perform similar biological functions. However, subtle differences in their regulatory mechanisms or functional specializations may have evolved post-duplication, allowing for the fine-tuning of trehalose-related processes in linseed. The observed duplication events also underscore the importance of TPS genes in the evolutionary adaptation of linseed, potentially offering enhanced flexibility for responding to environmental stresses such as drought, salinity, or extreme temperature.
Gene expression analysis of TPS genes in linseed
Expression analysis of the LuTPS gene family in two early flowering-maturing linseed accessions, IC0523807 and IC0525939, reveals distinct tissue-specific expression patterns. In both accessions, several LuTPS genes showed heightened expression in reproductive tissues, indicating their critical involvement in flowering and reproductive development. For example, LuTPS6.1 and LuTPS6.2 consistently exhibited high expression across all tissues, with particularly elevated levels in the flower, bud1, and bud2 stages (Fig. 3a, 3b). This indicates an involvement of these genes in reproductive processes, likely influencing the regulation of flowering by enhancing the expression of key floral regulators florigen FT and TSF. It is well established that the T6P pathway functions upstream of FT in the photoperiodic flowering pathway, further supporting this regulatory mechanism [24]. The consistency of this expression pattern between the two accessions further emphasizes the conserved role of LuTPS6 genes in flowering time regulation. Interestingly, LuTPS10.1 and LuTPS10.2 also displayed substantial expression in both reproductive and vegetative tissues, with particularly high levels in the leaf and flower, respectively (Fig. 3a, b). In Arabidopsis, TPS1 activity is essential for the induction of florigen FT in leaves, even during inductive photoperiods. TPS1 facilitates the activation of FT by CO in response to increasing day length and high carbohydrate availability, as indicated by elevated T6P levels. This coordination signals that sufficient carbohydrate resources are available to support the energy-intensive processes of flowering and seed development [24].
Similarly, the expression of LuTPS7 genes was notable across both reproductive and vegetative tissues, though LuTPS7.1 and LuTPS7.2 showed a bias toward reproductive tissues in both accessions (Fig. 3a, b). Notably, LuTPS7.4 displayed high expression in leaf tissue, particularly in the IC0523807 accession, suggesting its significant role in flowering time regulation. Interestingly, the LuTPS7.4 was identified as a candidate gene for flowering time regulation using genome-wide association study (GWAS) in linseed [39]. The high expression of LuTPS7.4 in both reproductive and leaf tissues, coupled with its identification as a candidate gene for the flowering time trait, strongly suggests its potential role in regulating flowering time in linseed.
Towards identifying key flowering genes in linseed (flaxseed), House et al. [9] studied transcriptome of shoot apical meristem (SAM) from ‘Royal’ flax cultivar at 10, 15, 19, and 29 days after planting (dap). The dataset from this study was used to check expression of TPS genes in early developmental stages of floral transition. Interestingly, a similar pattern of gene expression was observed in the SAM, consistent with the findings of the present study, where the highest expression levels were detected for LuTPS6.1 and LuTPS6.2, followed by LuTPS10.1, LuTPS10.2, LuTPS7.4, LuTPS7.1, LuTPS7.2, LuTPS7.3, LuTPS1.1, and LuTPS1.2 (Figure S4). Moreover, both the studies show, little or no expression of LuTPS1.3, LuTPS1.4, LuTPS7.5, LuTPS7.6, and LuTPS11.1 (Fig. 3, Fig S4). The elevated expression of the mentioned TPS genes during the early stages of floral transition [9] and the later stages of floral development observed in the present study further indicate their potential involvement in the regulation of flowering in linseed.
Allele mining of LuTPS genes
By sequencing and comparing four accessions comprising two early flowering-maturing (IC0523807, IC0525939) and two late flowering-maturing (EC0115148, EC0718827) accessions, multiple trait-specific SNPs were identified. In the LuTPS6.1 gene, three SNPs were identified, all of which exhibited a clear trait-specific pattern, distinguishing between early and late flowering-maturing accessions (Table 2). In LuTPS10.2, the nonsynonymous SNP which resulted in an amino acid substitution Gly782Val (Glycine in late flowering-maturing accessions to Valine in early flowering-maturing accessions) at position 782 could particularly be noteworthy as glycine is a small, flexible amino acid, while valine is larger and more hydrophobic. Homology-based modeling of the LuTPS10.2 protein revealed that this amino acid substitution leads to increased intramolecular interactions (Fig. 5), stabilizing the protein and potentially improving its functionality. Further, the analysis of potential energy showed that protein from early flowering-maturing accessions had lower potential energy compared to those from late flowering-maturing accessions (Table 4), indicating that the substitution likely contributes to protein stabilization. A single amino acid change in a protein has previously been shown to have a substantial effect not only on protein stability but also on its downstream function.
Analysis of CSBs in linseed and other plant species
Classically, synteny refers to a set of loci in different species located on the same chromosome, though not necessarily in the same order. However, in the context of modern comparative genomics, synteny more commonly refers to conserved collinearity and genomic context, meaning the conservation of genes in the same order across two sets of chromosomes, either interspecific or intraspecific. Syntenic studies provide crucial insights into chromosomal rearrangements, the expansion and contraction of gene families, and gene orthology. Additionally, synteny can offer valuable information on gene function and regulation, often considered a measure of the conservation or alteration of gene function [70].
In the present study, genome scale synteny analysis of linseed and nine other plant species, including representatives from cereals, oilseeds, pulses, and the model plant Arabidopsis, provided critical insights into CSBs and their associated genes along with the GCNs. The highest number of CSBs at genome scale, as well as the LuTPS gene-containing CSBs, was found between linseed and dicot species such as soybean, sunflower, cowpea, and sesame. This suggests a greater conservation of linseed syntelogs with dicots compared to monocots (cereals), aligning with the evolutionary timelines. Fewer CSB or limited syntelogs of linseed with cereals, especially wheat and barley, could possibly be due to different rates of genome evolution through events like whole-genome duplication or polyploidization, transposable element activity, and extensive chromosomal rearrangements. A similar observation was reported in the synteny network analysis of MADS-box transcription factors, particularly in wheat and barley, where no syntenic regions of their MADS-box genes were identified with other plant genomes. In terms of linseed intraspecific CSBs, present study identified a total of 811 CSBs, indicating the occurrence of whole genome duplication events. The whole-genome assembly of flax at the pseudomolecule level, along with subsequent analyses also confirmed the occurrence of whole genome duplication events in flax [52]. It has been estimated that two genome duplication events occurred, one more recently at 3.7–6.8 million years ago and a more ancient one at 23.8–44.1 million years ago [52]. The abovementioned study identified a total of 911 CSBs, slightly more than the present study, likely due to differences in methods and criteria used. Nonetheless, both studies arrive at the same conclusion that there has been substantial whole genome duplication and chromosomal rearrangements in the linseed genome.
Analysis of the LuTPS-specific GCNs provided further insights into the relationships among linseed TPS genes and their duplication events. For example, LuTPS1.1, LuTPS1.2, LuTPS1.3, and LuTPS1.4, which are orthologous to Arabidopsis TPS1, clustered together in Cluster I (Fig. 7a). However, syntenic relations were only found between LuTPS1.1 & LuTPS1.2, and LuTPS1.3 & LuTPS1.4. There were no syntenic connections between LuTPS1.1 & LuTPS1.2 and LuTPS1.3 & LuTPS1.4, though these pairs did exhibit syntenic relationships with TPS genes from other plants, suggesting that these pairs diverged earlier, followed by later duplication events leading to their respective paralogues. Similarly, LuTPS6.1 and LuTPS6.2 (Cluster II, Fig. 7b) showed no direct syntenic interaction with each other but did show syntenic relationships with TPS genes from other plants, indicating an ancient duplication event. Further, the Cluster II was found specific only to the dicots. Similar monocot- and eudicot-specific communities were also observed in the synteny network analysis of auxin response factor genes across diverse plant species. Other linseed TPS paralogues, such as LuTPS7.5 and LuTPS7.6 (Fig. 7a), demonstrated direct syntenic relations but lacked direct connections with LuTPS7.1—LuTPS7.4, suggesting earlier duplication and subsequent divergence. LuTPS7.1, LuTPS7.2, LuTPS7.3, and LuTPS7.4, on the other hand, exhibited syntenic connections among themselves, indicating more recent duplication events. These observations of genome duplication within LuTPS-specific GCNs align with findings of at least two WGD events in linseed [52]. Interestingly, the CSBs containing LuTPS genes also harbored important genes related to reproductive tissue development, photoperiodism, flowering, histone remodeling and modification, and protein ubiquitination. Genes participating in shared biological processes often cluster together genomically and are regulated by common promoters or signaling pathways. The close physical proximity of genes involved in such biological processes to LuTPS genes, particularly within the CSBs, suggests a potential involvement of LuTPS genes in these processes. However, further studies exploring the potential roles and associations of these genes with LuTPS genes would be required for deepening our understanding of flowering time regulation in linseed.
Potential protein–protein interaction of LuTPS, revealed a total of 27 unique interacting partners. The paralogues LuTPS showed similar interacting partners, possible due to their high sequence similarity. Most of the interacting partners were as per the expected function of TPS in sugar metabolism. However, three TPS, LuTPS6.1, LuTPS6.2, and LuTPS11.2 showed other TPS, LuTPS1.3 and LuTPS1.4 as interacting partners. Indeed, the protein–protein interaction among the TPS proteins have been demonstrated in rice. Furthermore, it is noteworthy that three of the PPI partners of TPS are components of the GCN, suggesting potential molecular interactions. While syntenic relationships do not necessarily correspond to PPIs, certain gene pairs are presumed to be conserved due to either transcriptional or/and functional relationship [75].
Enriched CRE on linseed TPS promoter sequences
CRE are transcription factor (TF) binding sites located in the promoter regions of genes. By regulating when, where, and to what extent a gene is expressed, CREs ensure that plant genes are activated or silenced in a highly specific and coordinated manner [76]. To understand how the expression of specific genes is regulated, it is crucial to identify CREs within promoter regions and assess their biological significance.
The trehalose-6-phosphate, besides being central to trehalose synthesis, plays a key role in sugar signaling, growth regulation, stress tolerance, and hormone interactions, establishing it as a critical regulator of plant physiology and development [19]. Therefore, it is crucial to understand the landscape of TPS promoters in order to identify significant CRE motifs associated with TPS genes. However, every gene promoter contains numerous CRE motifs, therefore, statistical application is critical to determine which among the motifs are significantly enriched [76, 77]. Identification of enriched CREs in LuTPS gene promoters, along with the annotation of associated transcription factors, provided significant insights into the biological processes in which TPS genes may be involved. Several enriched CREs in TPS promoters were associated with the transcription factors involved in floral and reproductive tissue development, flowering time regulation, and the transition from vegetative to reproductive growth. For example, TF_motif_seq_0250, one of the enriched CREs, was found to be the binding site of LAT52, which plays a key role in pollen hydration and pollen tube growth [79]. This motif was also observed in the promoter region of the tomato endo-beta-mannanase gene (LeMAN5), associated with anther and pollen development [80]. It is important to note that TF_motif_seq_0250 was present in all the linseed TPS genes at least once (Table S3). TF_motif_seq_0146 is a recognition sequence of Arabidopsis SUF4 (SUPPRESSOR of FRI 4), a zinc-finger-containing transcription factor having role in delayed flowering in Arabidopsis. SUF4 was shown to be responsible for higher expression of FLOWERING LOCUS C (FLC), a floral repressor in Arabidopsis. SUF4 physically bound to the FLC promoter as shown in a chromatin immunoprecipitation assay [81]. Other important motifs were TF_motif_seq_0321, and TF_motif_seq_0481, which are associated with regulation of light responsive genes such as RBCS, PHYA, RCA or circadian-regulated promoters, some of which are involved in flowering time regulation via photoperiod pathway [82–84]. Besides this, it is intriguing to note that a significant number of enriched CREs (15 of 32 enriched CREs) were associated with Dof-type domain-containing proteins. DOF proteins are known to repress CONSTANS expression and thus delay the flowering in Arabidopsis [85]. Mutations in DOF genes also contribute to photoperiod-insensitivity and early flowering in Arabidopsis, while overexpression of DOF genes from other plants showed delayed flowering [87]. It is noteworthy that the T6P pathway act under the photoperiod pathway as it integrates environmental signals (such as photoperiod) and physiological signals (such as carbohydrate status), and thereby regulate flowering by inducing FT in Arabidopsis [24]. Accordingly, the results indicate that the DOF proteins may possibly be involved in regulation of TPS gene expression under photoperiod pathway. Additionally, presence of six enriched CREs in all the linseed TPS genes (Table 5, Table S3), underscore their potential role in regulating TPS gene family expression through a common transcriptional regulatory mechanism.
Co-location of LuTPS genes in close physical proximity of QTNs associated with flowering
In linseed, a total of 82 QTLs/QTNs/SNPs associated with the flowering trait have been reported so far by multiple studies [ 37–39, 88]. Interestingly, 9 out of the total 18 LuTPS genes were found within 1.0 Mb range of 12 QTLs/QTNs/SNPs. Among these, LuTPS1.1, was located 0.69, and 1.00 Mb away from the QTNs Lu11_3283122, and Lu11_1592089, respectively [39]. Further, LuTPS1.3 was located 0.39 Mb distant from the QTN Lu12_2899524 [37]. Another gene LuTPS7.2, was located 0.46, and 1.00 Mb away from the SNPs/QTNs Lu12_2899524, and Lu12_4359290, respectively [37, 39]. Gene LuTPS7.3 could also be co-located 0.46 and 0.51 Mb distant from the SNPs/QTNs Lu03_8373065, and Lu03_7400113, respectively [37, 39]. Further, LuTPS7.4, a candidate gene identified earlier for flowering time trait was shown to harbor the associated QTN (Lu15_2036006) within the gene itself (39). Moreover, an additional QTN, Lu15_1756429 was found only 0.28 Mb distant from LuTPS7.4 gene. These findings underscore the strong candidature of LuTPS7.4 for the flowering time trait in linseed. Gene LuTPS7.6 was located just 0.83 Mb away from the SNP Lu4_16669798 [37]. Further, gene LuTPS8.1 was found located just 0.36 Mb distant from the SNP Lu4_9221348 [37]. Gene LuTPS8.2 could also be co-located 0.93 Mb away from the QTN Lu01_6408072 [39]. Another gene, LuTPS10.1 was found located 0.68 Mb away from the SNP Lu13_17577340 [37]. These close physical proximities of key TPS genes to that of QTL/QTNs associated with flowering time trait suggest potential contribution of TPS genes towards flowering time regulation.
Conclusion
This study offers comprehensive insights into the trehalose-6-phosphate synthase (TPS) gene family in linseed through genome scale comparative analysis. Enriched CRE in TPS promoters and associated syntelogs, along with allelic variation between early- and late-flowering genotypes, highlight the potential role of TPS genes in regulating flowering time. These findings represent an important step forward in establishing the potential role of trehalose-6-phosphate synthase genes in the complex regulation of flowering time in linseed.
Supplementary Information
Supplementary Material 1. Supplementary Material 2. Supplementary Material 3. Supplementary Material 4. Supplementary Material 5. Supplementary Material 6. Supplementary Material 7. Supplementary Material 8. Supplementary Material 9.
The reference list from the paper itself. Each links out to its DOI / PubMed record.
- 1Golembeski GS, Kinmonth-Schultz HA, Song YH, Imaizumi T. Photoperiodic flowering regulation in Arabidopsis thaliana. In Advances in botanical research 2014;72:1–28). Academic Press.10.1016/B 978-0-12-417162-6.00001-8PMC 432607525684830 · doi ↗ · pubmed ↗
- 2Saroha A, Pal D, Gomashe SS, Akash, Kaur V, Ujjainwal S, Rajkumar S, Aravind J, Radhamani J, Kumar R, Chand D. Identification of QT Ns associated with flowering time, maturity, and plant height traits in Linum usitatissimum L. using genome-wide association study. Frontiers in Genetics. 2022;13:811924.10.3389/fgene.2022.811924 PMC 923740335774513 · doi ↗ · pubmed ↗
- 3Andrews S. (2010). Fast QC: a quality control tool for high throughput sequence data. Available online at: http://www.bioinformatics.babraham.ac.uk/projects/fastqc
- 4Chi-Nga Chow, Tzong-Yi Lee, Yu-Cheng Hung, Guan-Zhen Li, Kuan-Chieh Tseng, Ya-Hsin Liu, Po-Li Kuo, Han-Qin Zheng, and Wen-Chi Chang "Plant PAN 3.0: a new and updated resource for reconstructing transcriptional regulatory networks from Ch IP-seq experiments in plants", Nucleic Acids Res. 2019.10.1093/nar/gky 1081 PMC 632395730395277 · doi ↗ · pubmed ↗
- 5Chi-Nga Chow, Chien-Wen Yang, Nai-Yun Wu, Hung-Teng Wang, Kuan-Chieh Tseng, Yu-Hsuan Chiu, Tzong-Yi Lee, Wen-Chi Chang, Plant PAN 4.0: updated database for identifying conserved non-coding sequences and exploring dynamic transcriptional regulation in plant promoters, Nucleic Acids Research. 2024.10.1093/nar/gkad 945PMC 1076784337897338 · doi ↗ · pubmed ↗