Outpatient healthcare costs of childhood injuries in Australia: a 15-year longitudinal analysis using linked survey and health insurance data
Aquib M. Chowdhury, Kabir Ahmad, Rasheda Khanam

TL;DR
This study analyzed 15 years of data to estimate the financial impact of childhood injuries on Australia's healthcare system, finding significant outpatient costs.
Contribution
The study provides a longitudinal analysis of injury-related healthcare costs in Australian children using linked survey and insurance data.
Findings
Annual excess outpatient costs for injured children were A$104.8 million for community-based treatment.
Costs per capita for childhood injuries were higher than for other childhood conditions.
The study estimates these costs are likely an underestimate due to missing inpatient data.
Abstract
This study evaluated the excess out-of-hospital healthcare costs associated with unintentional childhood injuries in Australia. This relationship was investigated within a longitudinal biennially surveyed cohort of 8,852 children aged 0–19 years. We assessed whether costs increased over age and with the duration of injury prevalence. Results were compared against cost estimates from similar studies in Australia and analogous developed nations. The nationally representative Longitudinal Study of Australian Children provided linked Medicare Benefits Schedule (MBS) and Pharmaceutical Benefits Scheme (PBS) cost data for the Birth and Kindergarten cohorts, followed for 15 years. We used a mixed effects generalized linear model (GLM) with a gamma distribution and log link to estimate outpatient healthcare costs and assess the effect of injury status, controlling for sociodemographic…
Genes, proteins, chemicals, diseases, species, mutations and cell lines named across the full text — each resolved to its canonical identifier and authoritative record.
Click any figure to enlarge with its caption.
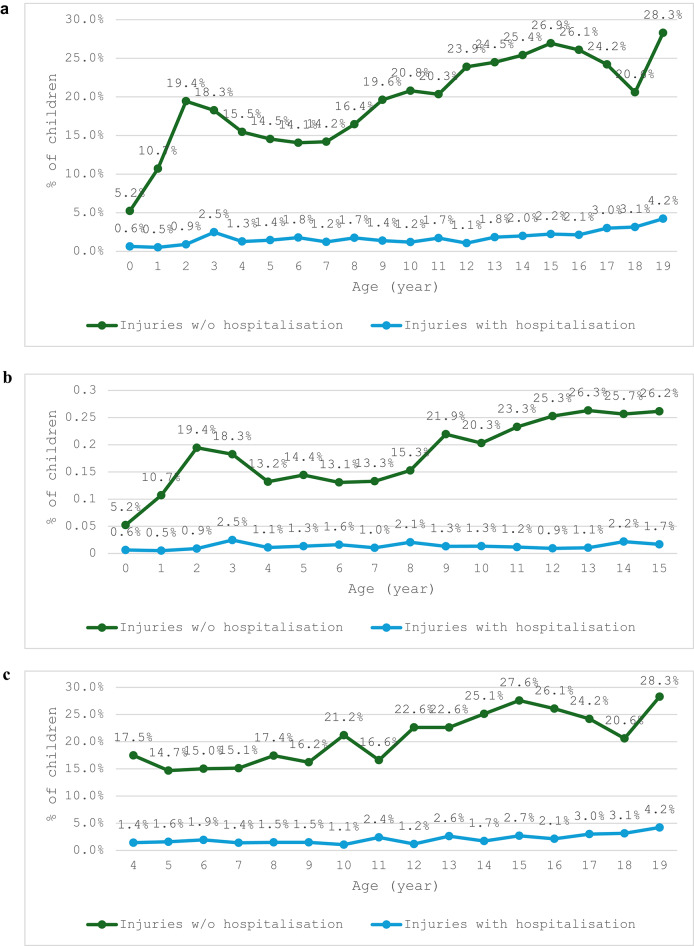 Figure 1
Peer Reviews
No public reviews on file for this paper yet. If you reviewed it on a platform where reviews are public (OpenReview, ICLR, NeurIPS, ICML), you can paste yours below so the community can read it here.
Videos
No videos yet. Explain this paper in a talk, walkthrough, or lecture? Add one.
Taxonomy
TopicsInjury Epidemiology and Prevention · Gun Ownership and Violence Research · Trauma and Emergency Care Studies
Introduction
Unintentional injury is the foremost cause of morbidity and mortality in children and youths worldwide [1]. Of the 5.04 million deaths of children under 5 in 2020, the WHO estimated a sizeable proportion (336,000) was attributable to unintentional injury [2]. In children under the age of 18, over 850,000 deaths per annum are ascribable to unintentional injury worldwide, and it remains the cardinal cause of mortality in the 10–19 year age group [1].
Children are especially vulnerable to unintentional injury due to their incomplete cognitive and physical development [1, 3]. The unintentional injuries measured principally included incidents such as traffic injuries, submersion, poisoning, burns, and falls– although this list is non-exhaustive [1]. Younger children generally lack the ability to properly assess risk and avoid probable hazards [3], whereas older children become increasingly influenced by risk-taking behaviour [3].
Injury-related healthcare costs are substantial globally. Studies in the United States and New Zealand estimate billions in annual economic losses due to childhood injury, including direct medical and productivity costs [4–8]. Despite this, there is limited national-level data on the economic burden of childhood injuries in Australia using comprehensive longitudinal cohorts, even though national statistics show that child health outcomes remain a key policy concern [9].
Recent Australian studies offer important epidemiological and policy context for understanding this burden. For example, Aboriginal and Torres Strait Islander (ATSI) children have been shown to experience hospitalisation due to unintentional injuries at 1.7 times the rate of non-Indigenous children, highlighting inequities in injury risk and healthcare outcomes [10]. Falls are the most common cause of child injury hospitalisations in Australia, with one study estimating over 168,000 hospital admissions due to falls alone over a ten-year period, contributing to a total healthcare cost of AUD $2.1 billion [11]. Further, psychological impacts of injury are significant. One Australian study demonstrated that exposure to traumatic injury in early life can increase the risk of developing long-term psychological disorders, leading to elevated health service use and associated costs [12]. In addition, researchers have documented the prevalence and risk factors for low-speed vehicle run-over incidents—a preventable and often fatal mechanism of injury among young children in residential driveways [13].
This study aims to estimate the excess outpatient and pharmaceutical costs associated with unintentional childhood injuries in Australia using data from the Longitudinal Study of Australian Children (LSAC). We seek to further understanding of the development, wellbeing, and life trajectories of Australian children over time, providing a unique opportunity for long-term population-based analyses. We specifically used LSAC to evaluate injury incidence, costs, and trends across age groups, comparing hospitalised and non-hospitalised cohorts.
Methods
Study design and data source
This study draws on data from the Longitudinal Study of Australian Children (LSAC), a nationally representative, prospective cohort study designed to track the health, development, and wellbeing of children across Australia. LSAC is conducted by the Australian Institute of Family Studies in partnership with the Department of Social Services and the Australian Bureau of Statistics. The study follows two cohorts of children: the Birth (B) cohort, which began in 2004 with children aged 0–1 year, and the Kindergarten (K) cohort, comprising children aged 4–5 years at baseline.
Although most legal and policy frameworks in Australia define a child as an individual under 18 years of age, we included participants up to age 19 to maintain the full longitudinal follow-up of the LSAC cohorts. As the LSAC study design involves biennial data collection, children recruited at ages 0–1 or 4–5 were followed up into late adolescence, with the final wave (Wave 8) capturing some participants at age 19. Including age 19 ensures completeness of cost trajectories and captures injury-related healthcare use during a critical transition period from adolescence to adulthood. This approach is consistent with other longitudinal analyses using LSAC data.
Data are collected biennially through structured interviews with parents and caregivers, teacher questionnaires, and direct child assessments. Crucially, LSAC includes linked administrative health data from the Medicare Benefits Schedule (MBS) and Pharmaceutical Benefits Scheme (PBS), allowing for detailed analysis of publicly funded outpatient service use and prescription medications.
For this analysis, we used Waves 1 through 8 (2004–2018) for both cohorts, providing a longitudinal window spanning early childhood through late adolescence. The repeated-measures design allows for robust tracking of injury events, healthcare utilisation, and cost trajectories over time.
Sample selection
The LSAC cohort was recruited using a two-stage clustered sampling design, in which children within the desired age brackets were randomly selected from the Medicare enrolment database, stratified by postcode to ensure national geographic representativeness. The sample was drawn from 311 postcodes across all Australian states and territories, covering urban, regional, and remote areas. Further detail on the LSAC sampling methodology is available in the technical documentation by Soloff et al. [14].
For this study, we included children with linked administrative health data available through Medicare—specifically, the Medical Benefits Schedule (MBS) and Pharmaceutical Benefits Scheme (PBS). These datasets capture government-subsidised outpatient and prescription medication use. Children with complete injury, cost, and relevant sociodemographic covariate data available across multiple waves were included in the analysis.
Injury classification
Unintentional injuries were identified through parental reports during LSAC interviews. Parents were asked whether their child had experienced any accidents or injuries that required treatment from a doctor or hospital during the last 12 month since the interview time of each wave. Only for B cohort of Wave 1, the duration of injuries or accidents were considered since birth. The injury types or accidents reported by the parents were as follows: broken or fractured bones, burn or scald, dislocation, sprain or strain, cut or scrape, concussion or internal head injury, internal injury (not head), dental injury, accidental poisoning or other. Children were classified into three categories based on reported injury severity: (1) no injury, (2) injury without hospitalisation (treated in community settings), and (3) injury with hospitalisation (hospital presentation reported). This stratification enabled the evaluation of the healthcare cost gradient associated with differing levels of injury severity.
While LSAC does not consistently distinguish between unintentional and intentional injuries across all waves, specific questions on injury intent — such as whether the injury was accidental, intentional, or self-inflicted — were asked in later waves (e.g. B10, B12, B14 and K14, K16). Based on available responses and the broader developmental context, most reported injuries in childhood are likely to be unintentional. This interpretation aligns with prior Australian population-based studies using similar data sources.
Outcome variable: healthcare cost
The primary outcome was total annual Medicare cost per child, including both MBS (outpatient services) and PBS (prescription medications) data. Costs were inflation-adjusted to 2018 Australian dollars. Cost estimates included population-level primary and secondary medical and pharmaceutical expenses, reflecting the structure of Australia’s mixed public-private healthcare system [15]. Importantly, inpatient hospital costs are not captured in MBS or PBS and are therefore excluded from our estimates.
Statistical analysis
We used a mixed-effects generalized linear model (GLM) with a gamma distribution and log link to estimate excess healthcare costs associated with injuries. This method accounts for the right-skewed distribution of cost data and repeated measures within individuals over time [16–18]. Covariates included age, sex, presence of chronic conditions (obesity, asthma medication/wheezing presence, and disability/medical conditions), non-injury hospitalization status to adjust for healthcare utilization unrelated to injury, lagged injury counts from prior waves to account for potential delayed cost impact, parental education, family income, area remoteness, private insurance, and parental proactiveness on health seeking behaviour. The equation form of the mixed-effect GLM regression model and detail description of its covariates have been presented in Supplementary (Annex A).
Prior to model fitting, we conducted data exploration and pre-modelling checks, assessing continuous variables for distributional assumptions and outliers, and categorical variables for missingness and sparsity. Variance Inflation Factor (VIF) diagnostics indicated no multicollinearity concerns (mean VIF = 1.37; maximum VIF = 2.75). Marginal cost estimates and 95% confidence intervals were derived using post-estimation margins commands after the model-run. Post-estimation diagnostics, for example, Residual plots of deviance residuals vs. fitted values, assessment of the distribution of random effects, evaluation of model robustness through executing a 5-fold cross-validation procedure and computation of the root mean squared error (RMSE) across held-out folds were conducted to assess model assumptions.
National cost projections
To estimate the national burden, marginal cost differences were multiplied by injury prevalence rates and applied to population data from the Australian Bureau of Statistics. This allowed us to generate age-stratified national-level estimates for both hospitalised and non-hospitalised injury cases.
Sensitivity analysis
Sensitivity analyses were conducted using alternative model specifications, including a GEE model (gamma, log link), a fixed-effects panel regression with log-transformed costs, and a pooled GLM. All models consistently demonstrated a positive and statistically significant association between injury severity and increased healthcare costs, supporting the robustness of the primary mixed-effects GLM findings. Model comparisons were based on effect sizes, precision, and consistency across approaches. As only one observation had zero cost and was excluded, a two-part modelling for sensitivity analysis was not required.
Results
Prevalence of injuries by age
The prevalence of injuries without hospitalization varied significantly across different age groups, as revealed from the combined observations of both cohorts, ranging from 5.2% (95% CI: 4.7–5.7%) to 28.3% (95% CI: 26.8–29.8%) (Fig. 1a). This pattern followed a multimodal distribution, with prominent peaks at 3 and 15 years of age (19.4%, 95% CI: 18.1–20.7%; and 26.9%, 95% CI: 25.3–28.5%, respectively), and a smaller but notable peak at age 10 (22.5%, 95% CI: 21.1–23.9%). In contrast, the prevalence of injuries with hospitalization progressed linearly with age, ranging from 0.6% (95% CI: 0.4–0.8%) at age 0 to 4.2% (95% CI: 3.7–4.7%) at age 19. Cohort-wise prevalence rates were presented in Fig. 1b and c.
Fig. 1(a) Prevalence of injuries over age, combined cohort, 2004 to 2018. (b) Prevalence of injuries over age, B cohort, 2004 to 2018. (c) Prevalence of injuries over age, K cohort, 2004 to 2018. Source/Notes: Authors’ analysis of data from the Longitudinal Study of Australian Children
Participant characteristics by injury type
Table 1 presents the characteristics of children by injury type, highlighting key differences in health and sociodemographic factors. Children who experienced injuries were more likely to have comorbid conditions such as asthma (18% in the hospitalised group vs. 11% in the non-injured group), disability, and overweight or obesity. Injured children also had higher rates of non-injury hospitalisations. Parental characteristics varied by injury type, with injured children more often having parents with lower educational attainment and reduced financial readiness to seek emergency healthcare—for example, 17% of parents in the hospitalised injury group reported low financial preparedness compared to 11% in the non-injured group. These patterns highlight the interplay between child health status, parental resources, and injury-related healthcare burden.
Table 1. Characteristics of the sampled childrenCharacteristicsAllBy injury type of the childrenNo injuryInjuries without hospitalisationInjuries with hospitalisationNumber of children in the first wave, B + K cohort (n)8852779896787Pooled number of observations (n)51,44841,0929566790 Child characterisitics Having any injury with or without hospitalisation (%) No Injury79.2--- Injury without hospitalisation19.1--- Injury with hospitalisation1.7--- Age, years (mean(SE))9.1 (0.03)8.7 (0.03)10.4 (0.06)10.7 (0.21) Sex, male (%)51.349.557.464.4Any hospitalisation (at least one night) due to non-injury reason No89.189.588.677.3 Yes5.45.54.510.7 Missing (K cohort Wave 8)5.55.16.812Asthma medication use history No84.284.882.378.8 Yes15.815.217.721.2Obesity category Underweight66.25.45.2 Normal Weight64.364.165.160.6 Overweight17.517.218.322.5 Obese8.99.17.98.3 Missing3.33.33.33.4Long-term disability or conditions by type No disability85.486.183.175.3 Sensory22.11.91.6 Physical0.90.90.81.6 Psychological0.60.510.8 Other long-term3.133.24.1 Multiple (two or more of the above)2.62.43.24.6 Missing (K cohort Wave 8)5.55.16.812 Parental charactisitcs Single Parents (%)18.117.619.923.3 Household Income Quintile * Quintile 1* 18.719.117.214.7 * Quintile 2* 18.618.618.317.8 * Quintile 3* 18.218.019.019.9 * Quintile 4* 18.418.119.418.7 * Quintile 5* 18.118.018.717.4 * Missing* 8.18.27.411.6Employment status of parent 1 * Employed* 68.767.672.972.4 * Unemployed* 3.02.93.23.0 * Not in labour force* 27.128.222.922 * Not disclosed* 1.21.21.02.6Education of parent 1 * Less than year 12* 17.617.816.520.4 * Year 12* 9.79.999.2 * Professional qualification/certificate course* 33.733.334.935.1 * Graduate/Diploma* 32.132.132.528.8 * Post-graduate* 6.96.97.16.5Parents having any private hospital insurance * Yes* 45.44547.242.6 * No* 54.65552.857.4Parental healthcare seeking proactiveness* High59.460.256.552.4 Moderate28.427.73132.8 Low10.710.511.512 No response1.51.60.92.9Residence Type * Major Cities* 67.968.56662.1 * Inner region* 20.219.821.421.9 * Outer region* 10.410.111.114.4
- Remote/Others* 1.61.61.41.6Total average healthcare costs (AUD. All the mean and percentage figures are presented imposing population weight
Statistical model outputs
Using a generalized linear model with a gamma distribution and log link (see supplementary Annex-B), we estimated that children who sustained injuries had significantly higher outpatient costs compared to those who did not (Table 2). Adjusted analyses controlled for confounding sociodemographic factors and allowed for repeated measures, thereby accounting for both between- and within-child variation over time to improve the accuracy of estimated injury-related cost differences. These findings remained robust across multiple sensitivity models, underscoring the substantial financial burden associated with childhood injuries in the Australian outpatient healthcare system.
Table 2. One-year total medicare costs ($ mean (SE)) per child by age-group and injury severity in the pooled observation of B and K cohort (N = 51448)Age (years)No of children by age groupGLM model results for mean total Medicare expenditure over two yearsMean (SE) by category of having injury and/or hospitalisationMean Diff. (95% CI) across the different injury categories by age of childrenP-valueNo injuryInjuries without hospitalisatonInjuries with hospitalisatonInjuries WOH (B-A)Injuries WH (C-A)(A)(B)(C)03,943392 (5)481 (8)741 (26)89 (79–99)349 (302–396)< 0.0011718409 (5)502 (8)774 (27)93 (83–103)365 (315–414)< 0.00122,802371 (4)455 (7)701 (24)84 (75–94)330 (286–375)< 0.00131,106378 (4)464 (7)715 (24)86 (77–95)337 (292–382)< 0.00146,338347 (3)426 (6)656 (22)79 (70–88)309 (268–351)< 0.00151,679356 (3)437 (6)673 (22)81 (72–90)317 (275–359)< 0.00164,740349 (3)427 (5)658 (22)79 (71–88)310 (269–352)< 0.00172,059350 (3)429 (5)662 (22)80 (71–88)312 (270–353)< 0.00184,410348 (3)427 (5)658 (22)79 (71–88)310 (269–352)< 0.00192,102361 (3)443 (5)683 (23)82 (74–91)322 (279–365)< 0.001103,844354 (3)434 (5)668 (22)80 (72–89)315 (273–357)< 0.001112,255369 (3)452 (6)697 (23)84 (75–93)328 (285–372)< 0.001123,280363 (3)445 (5)686 (23)83 (74–91)323 (280–366)< 0.001132,551374 (4)459 (6)707 (23)85 (76–94)333 (289–377)< 0.001143,307385 (4)472 (6)727 (24)88 (78–97)343 (297–388)< 0.001151,899386 (4)473 (6)729 (24)88 (79–97)344 (298–389)< 0.001161,270355 (5)435 (6)670 (23)81 (72–89)316 (274–358)< 0.00117997369 (5)452 (7)696 (24)84 (75–93)328 (284–372)< 0.001181,312512 (11)628 (14)968 (36)116 (103–129)456 (394–518)< 0.00119836530 (11)650 (15)1002 (37)120 (107–134)472 (408–537)< 0.001Total51,44817416819CI = Confidence Interval; SE = Standard Error. GLM model results presented using margins command after fitting a generalized linear model with gamma distribution and log link
Cost estimates by injury severity
The excess Medicare outpatient and pharmaceutical cost per child per year was A455 for children who had been hospitalised (Table 2). These values reflect increased medical utilization compared to their same aged peers who did not have any injuries, even in the absence of inpatient admission.
National-Level cost projections
Applying model estimates and prevalence data to population figures, we projected the annual cost burden for injury-related outpatient care. After projection, annual excess outpatient and pharmaceutical costs for injuries among 0–19 year-olds were A104.8 million for those only requiring community-based treatment (Table 3). These estimates do not include inpatient hospital costs, which are not captured in the Medicare dataset. These projections reveal that injuries in children result in significant fiscal implications for the healthcare system, particularly when aggregated across both hospitalised and non-hospitalised groups.
Table 3. Estimated total medicare costs ( Costs in millions Estimate (95% CI) for children with:Excess $ costs in millions above cost of non-injured children’s Estimate (95% CI) for children with:No injuriesInjuries without hospitalisationInjuries with hospitalisation0313,569115.6 (113 to 118.2)1.5 (1.4 to 1.5)0.7 (0.6 to 0.8)1308,080111.9 (109.4 to 114.3)3.1 (2.9 to 3.2)0.6 (0.5 to 0.6)2323,80995.6 (93.6 to 97.5)5.3 (5 to 5.6)1.0 (0.8 to 1.1)3318,29295.4 (93.5 to 97.2)5.0 (4.7 to 5.2)2.6 (2.3 to 3)4318,32691.9 (90.4 to 93.4)3.9 (3.6 to 4.1)1.2 (1.1 to 1.4)5324,00196.8 (95.3 to 98.3)3.8 (3.6 to 4)1.5 (1.3 to 1.7)6321,02894.0 (92.6 to 95.4)3.6 (3.4 to 3.8)1.8 (1.6 to 2)7320,25594.7 (93.4 to 96.1)3.6 (3.4 to 3.8)1.2 (1.1 to 1.4)8321,78791.6 (90.3 to 92.9)4.2 (3.9 to 4.4)1.7 (1.5 to 1.9)9317,46990.5 (89.2 to 91.9)5.1 (4.8 to 5.4)1.4 (1.2 to 1.6)10317,74687.5 (86.2 to 88.8)5.3 (5 to 5.5)1.2 (1 to 1.3)11314,44490.3 (88.8 to 91.7)5.3 (5.1 to 5.6)1.8 (1.6 to 2)12303,53082.6 (81.3 to 83.9)6.0 (5.7 to 6.2)1.0 (0.9 to 1.2)13292,01280.4 (79 to 81.8)6.0 (5.8 to 6.3)1.8 (1.6 to 2)14288,18580.4 (78.9 to 81.9)6.4 (6.1 to 6.7)1.9 (1.7 to 2.2)15285,57778 (76.5 to 79.5)6.7 (6.4 to 7)2.2 (1.9 to 2.4)16286,55972.9 (71.2 to 74.5)6.0 (5.7 to 6.3)1.9 (1.7 to 2.1)17294,68979 (77.1 to 80.8)5.9 (5.7 to 6.2)2.9 (2.6 to 3.2)18306,243119.5 (114.7 to 124.3)7.3 (6.9 to 7.7)4.4 (3.9 to 4.9)19317,676113.6 (109 to 118.2)10.8 (10.2 to 11.4)6.3 (5.6 to 7)104.839.1CI = Confidence Interval; AUD = Australian Dollars. Estimates based on GLM marginal means and injury prevalence extrapolated to national population figures
Additional results and supporting analyses
Further detailed results are provided in Table 4 and in the annexes to support and contextualise the main findings. Table 4 presents a comparison of government healthcare expenditure associated with childhood injury and other conditions based on previously published Australian studies. Annex C provides mean cost differences with 95% confidence intervals across injury categories by cohort and specific age groups. Annex D reports the marginal effects of injury-related healthcare costs across key covariate subgroups, illustrating variations in cost burden by sociodemographic and clinical factors. Lastly, Annex E presents the results of sensitivity analyses using alternative model specifications, confirming the robustness of our primary findings.
Table 4. Comparison of government healthcare expenditure in children associated with injury and other diseases adopted from different studiesStudyMedical conditionAge range and cohortStudy methodExcess costs per child (Am)For the duration of the study (price year)Per year in 2018 priceFor the age range in the price yearFor the age range in 2018 price Considering similar duration of other studies/diseases and this study Sciberras et al. (2013)ADHD4/5 to 8/9 years–K cohortGLM2,245/6 years (2012)42112.413.9Sciberras et al. (2013)ADHD symptom4/5 to 8/9 years–K cohortGLM753/6 years (2012)1381516.9Clifford et al. (2015)Overweight4/5 to 8/9 years–K cohortOLS164/6 years (2011)316.97.8Clifford et al. (2015)Obese4/5 to 8/9 years–K cohortOLS313/6 years (2011)595.56.3Au (2012)Overweight/Obese4/5 to 8/9 years–K cohortGLM93/5 years (2008)239.812.1Lucas et al. (2013)Mental health4/5 to 8/9 years–K cohortGLM909/4 years (2009)2774.75.7Quach et al. (2013)Sleep problem4/5 to 6/7 years–K cohortOLS226/4 years (2012)641112.4This StudyInjured without hospitalisation4 to 9 years–B/K cohortME-GLM480/6 years (2018)8024.224.2This StudyInjured with hospitalisation4 to 9 years–B/K cohortME-GLM1880/6 years (2018)3138.88.8 Considering whole duration of this study Injured without hospitalisation0 to 19 years– B/KME-GLM1741/15 years (2018)116104.8104.8This StudyInjured with hospitalisation0 to 19 years– B/KME-GLM6819/15 years (2018)45539.139.1GLM = Generalized Linear Model; OLS = Ordinary Least Squares; MBS = Medicare Benefits Schedule; PBS = Pharmaceutical Benefits Scheme; AUD = Australian Dollars. All cost estimates adjusted to 2018 AUD values
Discussion
Interpretation of key findings
This study highlights the substantial outpatient and pharmaceutical costs associated with childhood unintentional injury in Australia, with a clear gradient by injury severity and age. Notably, costs were markedly higher for children who were hospitalised compared to those treated solely in the community. The identification of a multimodal distribution in injury prevalence—with prominent peaks at ages 3, 10, and 15—underscores age-specific vulnerabilities.
Developmental explanations
The observed age-related trends can be explained through developmental and behavioural lenses. Early childhood is marked by limited coordination and poor hazard perception, while adolescence features increased independence and risk-taking behaviour due to ongoing neurological development, particularly in the prefrontal cortex [3]. The smaller but notable peak at age 10 may reflect increased unsupervised physical activity, organised sports participation, and limited risk awareness characteristic of late childhood.
Comparison with international literature
Our cost estimates were modest compared to those reported in other high-income countries. For instance, US-based studies report injury-related healthcare costs that are three to four times higher after adjusting to Australian dollars [6, 8]. These differences may reflect variations in healthcare systems, injury definitions, and methodological approaches. Nonetheless, the international comparisons validate the economic relevance of our findings.
Comparison with other childhood conditions
When benchmarked against other common childhood health conditions in Australia, the excess healthcare costs associated with unintentional injury were comparatively high. For instance, the annual Medicare cost of ADHD symptoms was estimated at approximately A31 and A59 per child, respectively [[19](#CR19)–[21](#CR21)]. More recent IV-based estimates suggest this burden may be even higher [[22](#CR22)]. Similarly, childhood sleep disorders have been associated with additional primary care costs of approximately A64 per child annually by age 7, further contextualising the outpatient burden of preventable conditions [23]. Mental health difficulties during childhood have been estimated to incur excess annual Medicare costs of approximately A$277 per child [24].
In contrast, our findings show excess Medicare costs of A487 for those hospitalised. These comparisons highlight that injury-related healthcare costs may exceed those of other chronic conditions during childhood. Given that many unintentional injuries are preventable, this reinforces the importance of targeting injury prevention as a priority area in health policy and child development strategies.
Policy implications
The national-level cost projections (Table 3) reinforce the significant fiscal burden of childhood injury on Australia’s healthcare system. These findings suggest a clear need for enhanced injury prevention strategies tailored to high-risk age groups, and especially in the domestic environment where injuries are more likely to occur [25]. Public health initiatives, school-based safety programs, and parental education could yield long-term cost savings and improve health outcomes.
Strengths and limitations
Key strengths of this study include the use of a nationally representative longitudinal cohort (LSAC), and linkage to administrative MBS and PBS data, allowing for robust cost estimation of outpatient services use and prescription medications. A key limitation of this study is the exclusion of inpatient hospital costs from the linked Medicare data, which captures only outpatient services and prescription medication use. Consequently, total injury-related healthcare expenditures are likely underestimated, particularly for injuries requiring hospitalisation, and absence of indirect costs such as parental work loss or long-term disability. Although external sources such as the AIHW Injury in Australia report [26], the NHCDC [27], and AR-DRG cost weights [28] provide estimates of hospital costs and injury case numbers separately, they are not directly linked. Integrating these sources would require strong assumptions about injury types, hospital service use, and case severity, which cannot be validated with the LSAC data. Nevertheless, this study offers important insights into the outpatient cost burden of childhood injury, and future research incorporating hospital separation and diagnosis data could enhance total cost estimations.
The LSAC sampling frame excluded children living in very remote areas and some discrete Indigenous communities. As a result, Aboriginal and Torres Strait Islander (ATSI) children living in these regions may be underrepresented in the sample. However, ATSI children residing in urban and regional areas were eligible and are included in the dataset. This limitation should be considered when generalising findings to all Indigenous populations in Australia.
Conclusion
The current study provides evidence of a significant relationship between injury among Australian children aged 0–19 years and major excess healthcare costs at the population level, estimated approximately A41.0 million for hospitalised injuries, annually. Public health spending could be significantly reduced by a successful campaign to prevent injuries in early childhood years of life. These research results will also assist health economists to estimate the cost of childhood injury from the healthcare services and medication perspective when conducting modelled economic evaluations of childhood injury.
Electronic supplementary material
Supplementary Material 1
The reference list from the paper itself. Each links out to its DOI / PubMed record.
- 1Peden M, Oyegbite K, Ozanne-Smith J, Hyder AA, Branche C, Rahman AKMF et al. World Report on Child Injury Prevention. Geneva: World Health Organization; 2008. Available from: https://iris.who.int/bitstream/handle/10665/43851/9789241563574_eng.pdf 26269872 · pubmed ↗
- 2World Health Organization. World Health Statistics 2015. Geneva: World Health Organization. 2015. Available from: http://apps.who.int/iris/bitstream/handle/10665/170250/9789240694439_eng.pdf
- 3Florence C, Simon T, Haegerich T, Luo F, Zhou C. Estimated lifetime medical and work-loss costs of fatal injuries—United States, 2013. Morbidity and Mortality Weekly Report. 2015;64(38):1074–1077. Available from: https://www.cdc.gov/mmwr/preview/mmwrhtml/mm 6438 a 4.htm 10.15585/mmwr.mm 6438 a 426421530 · doi ↗ · pubmed ↗
- 4Florence C, Haegerich T, Simon T, Zhou C, Luo F. Estimated lifetime medical and work-loss costs of emergency department–treated nonfatal injuries—United States, 2013. Morbidity and Mortality Weekly Report. 2015;64(38):1078–1082. Available from: https://www.cdc.gov/mmwr/preview/mmwrhtml/mm 6438 a 5.htm 10.15585/mmwr.mm 6438 a 526421663 · doi ↗ · pubmed ↗
- 5Australian Institute of Health and Welfare. Australia’s Children. Canberra: AIHW. 2022. Available from: https://www.aihw.gov.au/reports/children-youth/australias-children
- 6Soloff C, Lawrence D, Johnstone R. LSAC Sample Design (Technical Paper No. 1). Melbourne: Australian Institute of Family Studies; 2005. Available from: https://api.research-repository.uwa.edu.au/ws/portalfiles/portal/73664759/tp 1.pdf
- 7Stata Corp. glm — Generalized linear models. College Station (TX): Stata Corp LLC. Available from: https://www.stata.com/manuals/rglm.pdf
- 8Kopjar B, Wickizer TM. Population-based study of unintentional injuries in the home. American Journal of Epidemiology. 1996;144(5):456–462. Source/Notes: Authors’ compilation of conclusions from analogous studies, 2024.10.1093/oxfordjournals.aje.a 0089518781460 · doi ↗ · pubmed ↗