Identification and analysis of genomic regions influencing leaf morpho-physiological traits related to stress responses in greater yam (Dioscorea alata L.)
Komivi Dossa, Mahugnon Ezékiel Houngbo, Jean-Luc Irep, Aurélien Peter, Boris Yehouenou Tessi, Hanâ Chaïr, Denis Cornet

TL;DR
This study identifies genetic regions in greater yam linked to leaf traits that help the plant respond to stress, which can aid in breeding more resilient crops.
Contribution
The study provides new insights into the genetic basis of stress-related leaf traits in greater yam using GWAS and allele analysis.
Findings
24 significant associations were identified across 11 chromosomes for leaf traits related to stress responses.
Candidate genes like Dioal.18G049300 and Dioal.12G033600 were linked to stomatal density and net photosynthesis, respectively.
High heritability was observed for traits like transpiration rate and stomatal density, indicating potential for breeding improvement.
Abstract
Yams (Dioscorea spp.) are significant food security crops especially in West Africa. With the increasing tuber demand and climate change challenges, it is pertinent to strengthen breeding programs for developing high-yielding cultivars with climate resilience. The current study aimed at deciphering the genetic basis of leaf traits related to stress responses in a diverse panel of Dioscorea alata genotypes. Phenotypic characterization of 12 traits, including leaf dry matter content, mean leaf area, net photosynthesis, transpiration rate, transpiration use efficiency, stomatal density, stomatal index, preformed node count, leaf thickness, competitor, stress-tolerator, ruderal ecological strategies emphasized significant variations among the genotypes and across two planting locations. Weak correlations were observed among most of traits, suggesting that breeding simultaneously for some…
Genes, proteins, chemicals, diseases, species, mutations and cell lines named across the full text — each resolved to its canonical identifier and authoritative record.
Click any figure to enlarge with its caption.
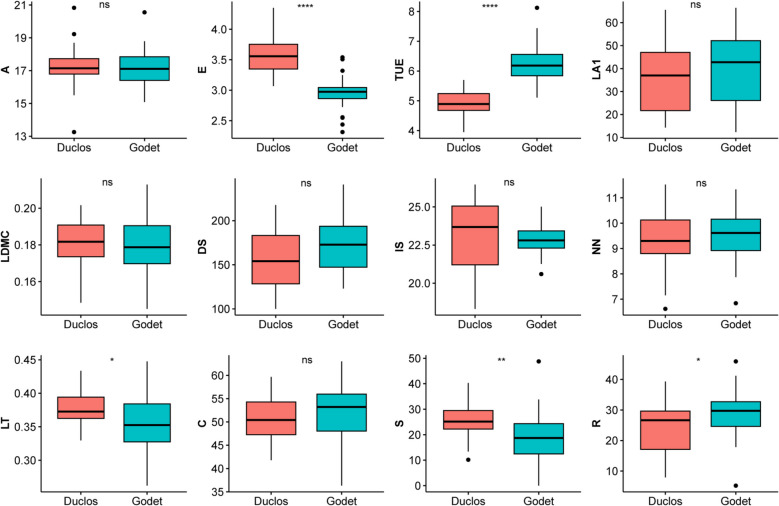 Figure 1
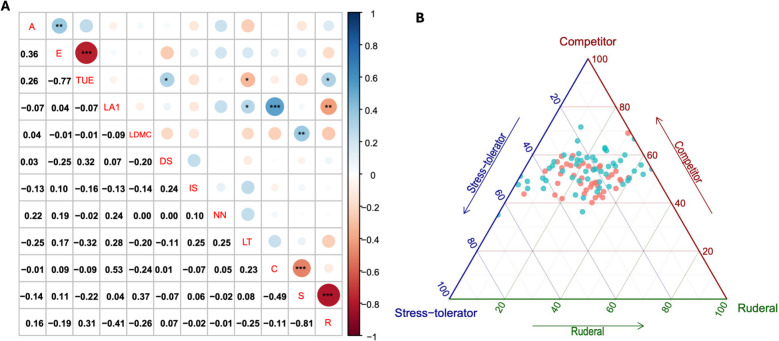 Figure 2
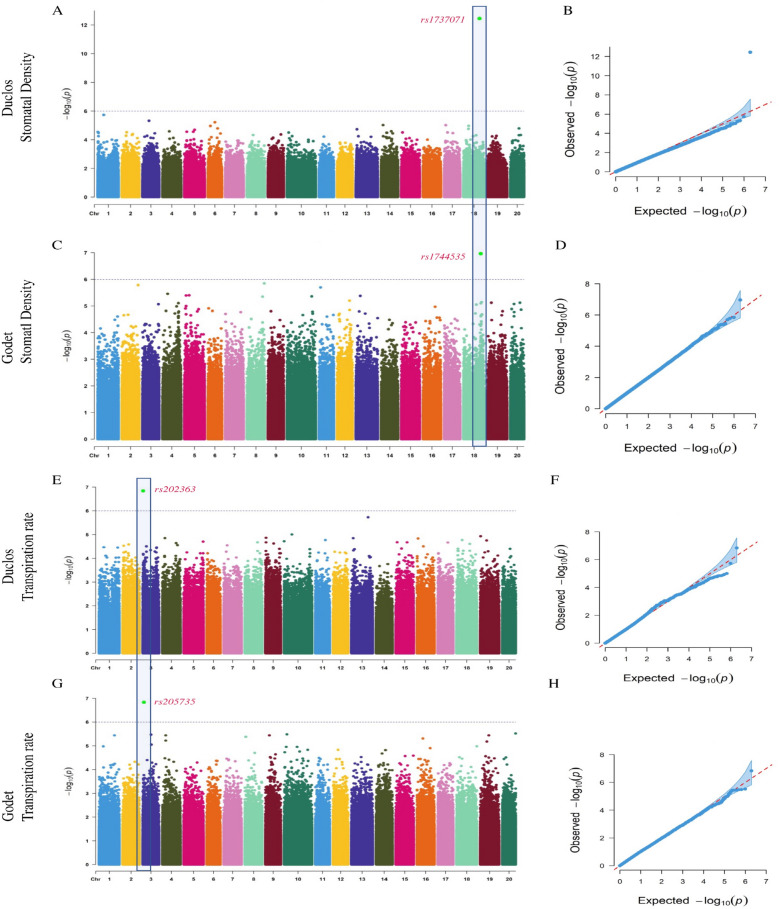 Figure 3
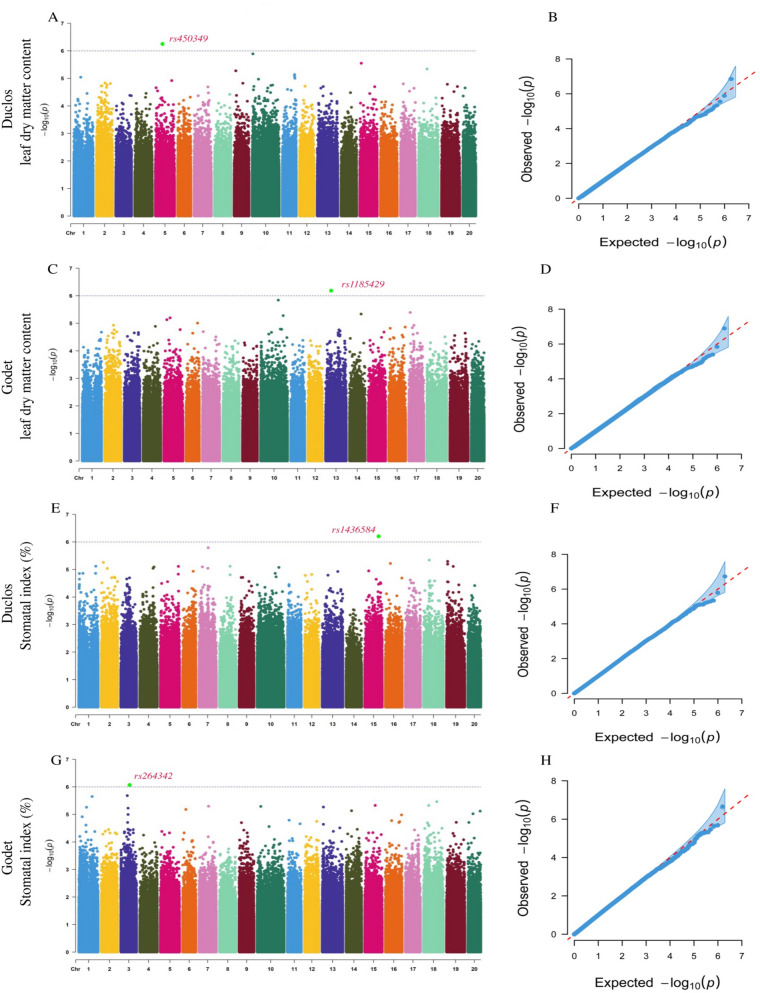 Figure 4
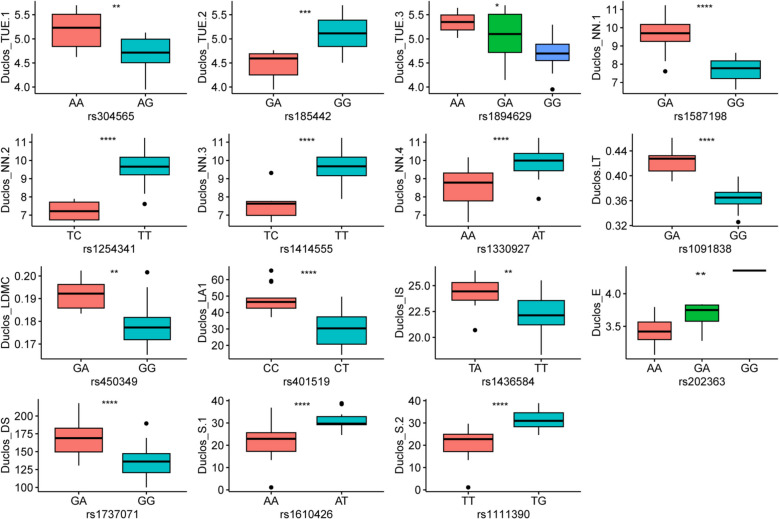 Figure 5
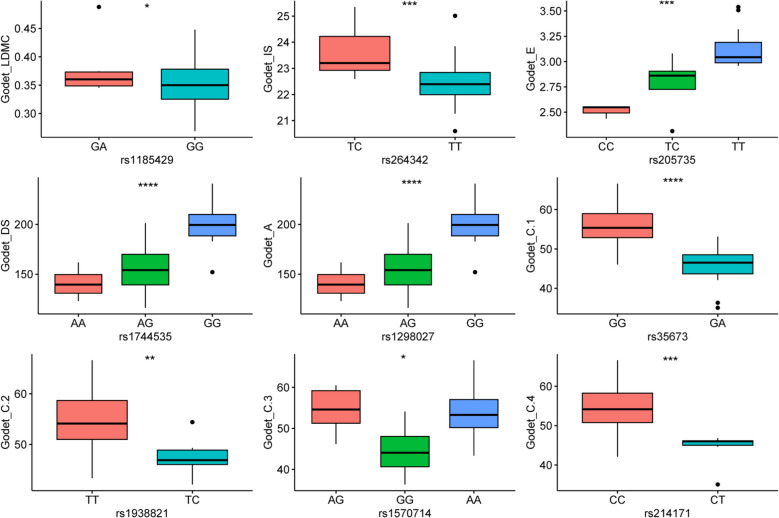 Figure 6
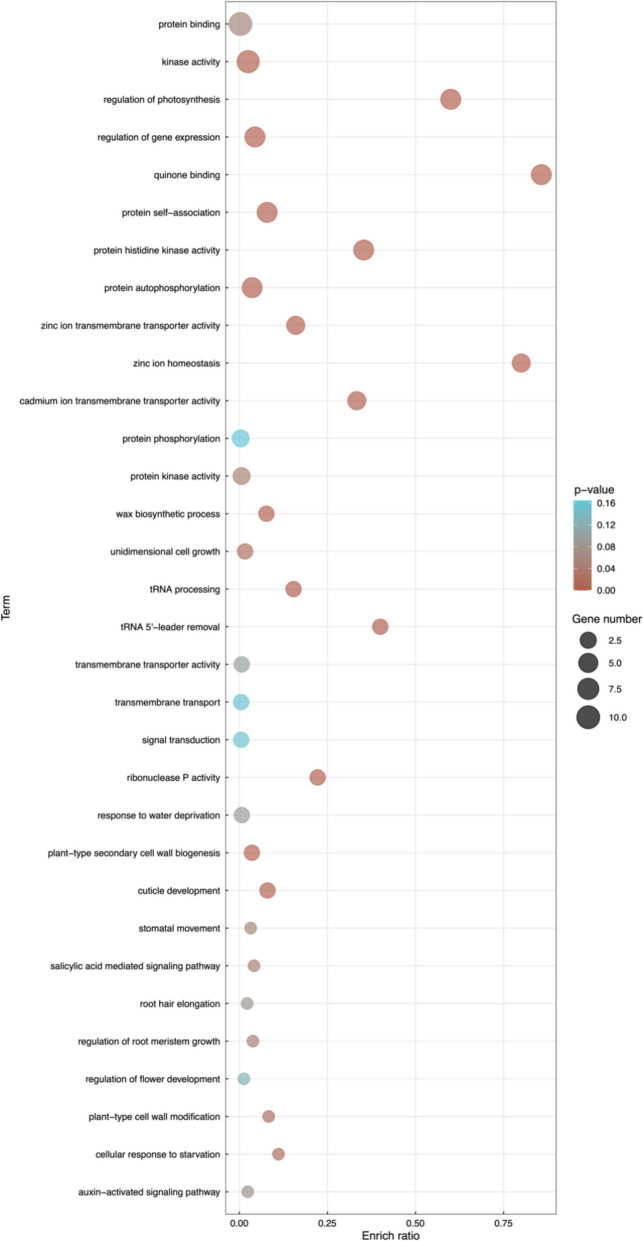 Figure 7
- —http://dx.doi.org/10.13039/100000865Bill and Melinda Gates Foundation
Peer Reviews
No public reviews on file for this paper yet. If you reviewed it on a platform where reviews are public (OpenReview, ICLR, NeurIPS, ICML), you can paste yours below so the community can read it here.
Videos
No videos yet. Explain this paper in a talk, walkthrough, or lecture? Add one.
Taxonomy
TopicsPotato Plant Research · Seed and Plant Biochemistry · Agricultural pest management studies
Background
Crop improvement involves population development, identification of key traits, phenotyping, deciphering the genetics, and combining the traits of interest [1–3]. Although classical breeding is still an effective way for crop improvement, modern technologies such as marker-trait associations have fast-tracked the understanding of natural variation pertaining phenotypic and genotypic diversities for further utilization in breeding programs [4–7]. Screening phenotypes with genotypic differences that can be manipulated is of fundamental interest in crop improvement. The inherited relationship between phenotypic and genotypic differences has been extensively studied in plants to understand the complex genetic architecture underlying agronomically important traits [8–10]. Phenotypic variation can be traced back to causative loci using quantitative trait loci (QTLs) and association mapping approaches [11]. Genome-wide association studies (GWAS) enable us to overcome some limitations of the QTL mapping approach and provide a relatively high resolution to comprehend allelic diversity [12]. GWAS have been extensively employed to identify the causative variations underlying specific traits in many crops, such as wheat [13, 14], rice [15, 16], cotton [17, 18], maize [19, 20], potato [21, 22] and yams [23–26]. For instance, Gatarira et al. [27] identified several putative candidate genes associated with dry matter accumulation and oxidative browning in Dioscorea alata using GWAS. Cormier et al. [28] conducted GWAS to decipher the genetic regulators of flowering control and sex determination in greater yam. Recently, Dossa et al. [29] located the genomic regions controlling tuber flesh color, oxidative browning and culinary traits in D. alata.
Yams (Dioscorea spp.) are considered major food security crops in Africa and other regions in the world [30, 31]. Dioscorea rotoundata, D. cayenensis, and D. alata are the most important yam species in West and Central Africa [32]. Dioscorea alata L., commonly known as greater yam or water yam, is widely distributed worldwide and significantly contributes to food security [27, 33]. In West Africa, greater yam is mainly cultivated in three ecological zones, including rainforests, the southern Guinea savanna, and the wetter portion of the northern Guinea savanna [34]. Rainfalls are the primary source of irrigation in yam-cultivated areas in Africa and 1000 to 1500 mm rainfall during the cropping season favors its production [34]. Leaf development, tuber initiation, and bulking are the critical growth stages, and a lack of sufficient water can reduce the yield to critical levels [35]. Diby et al. [36] reported a significant yield decrease in D. alata under water stress conditions. Moisture stress can directly impact dry matter accumulation due to low photosynthetic rate and metabolism, indirectly impacting tuber initiation and development [37, 38]. There is a consensus on developing drought and heat-tolerant greater yam cultivars for stable and improved tuber yield performance [37]. Climate change, unpredicted rainfalls, and increasing temperatures constantly threaten yam production [39, 40]. Moreover, the lack of studies concerning abiotic stress tolerance in yam requires attention to cope with the emerging challenges associated with climate change and food security [36].
Stress tolerance is a multi-stage phenomenon comprising stress sensing, signaling, and recovery [41]. Understanding the mechanisms underlying plant stress responses is crucial for improving crop resilience to abiotic and biotic stresses. Traits such as leaf dry matter content (LDMC), mean leaf area, net photosynthesis rate, transpiration rate, transpiration use efficiency (TUE), stomatal density, stomatal index, and leaf thickness are vital for stress adaptation. High LDMC, for instance, is associated with drought-resistance, while smaller leaf areas reduce transpiration and heat load under arid conditions [42, 43]. Net photosynthesis is critical for energy production, but its efficiency can decline under water-limited or saline conditions [44]. Traits like high TUE enhance biomass production per unit of water used, an essential adaptation for drought tolerance [45]. Meanwhile, stomatal density and index regulate gas exchange and water loss, balancing carbon fixation with water conservation [46]. Ecological strategies such as competitor, stress-tolerator, and ruderal (CSR) also provide insights into resource allocation and survival strategies across varying environmental conditions [47]. These traits and strategies collectively interact to mitigate stresses such as drought, salinity, extreme temperatures, nutrient deficiencies, herbivory, and pathogen attacks. While these relationships have been extensively studied in crops like rice, corn, wheat, soybean, and cowpea, they remain underexplored in yams.
Research to unravel the genetic basis of major agronomic traits associated with stress response will have far-reaching implications for the genetic improvement of D. alata. This is the first such study aimed at deciphering the genetic architectures of leaf morpho-physiological attributes related with stress response in D. alata. To achieve this objective, a diversified panel of D. alata was assembled and phenotyped for the studied traits at two locations. Thanks to the reference genome of D. alata v2.1 [48], we conducted GWAS to detect the genomic variations and putative candidate genes associated with the studied traits. The results provide a framework for further improvement in breeding programs concerning the development of climate-resilient D. alata cultivars.
Results
Leaf morpho-physiological characterization
Summary statistics showed significant variation for the 12 traits in the association panel, which is useful for deciphering their genetic architectures (Table 1 and Fig. S1). The broad-sense heritability (H^2^) computed for the different traits ranged from 0.48 stress-tolerator ecological strategy (S) to 0.94 transpiration rate (E).Table 1. Summary statistics for leaf morpho-physiological traits associated with stress response in greater yamTraitsUnitMinMaxAverageSEVSDCVGGxEH^2^LDMC%0.100.270.182,25E-030.00136369.0020.430.58LA1cm^2^7.3285.6732.371.04288.2116.9852.44ns0.92AµmolCO_2_M^−2^ s^−1^0.9523.3312.650.2019.634.4335.04ns0.81Emol m⁻^2^ s⁻^1^0.484.452.66374.000.600.7729.000.94TUEµmolCO_2_mmol^−1^H_2_O0.389.154.830.061.811.3427.820.76IS%8.8937.1422.740.2223.224.8221.19ns0.77DSmm^−2^50.44353.10170.692.623366.3858.0233.99ns0.87NNNA3.0015.009.420.156.072.4626.16ns0.74LTmm0.20000.60000.36000.00480.00580.075920.800.72S%064.9524.541.65137.0111.4647.020.48C%35.0571.651.900.9442.426.4912.490.77R%045.923.561.49108.7310.3244.090.49LDMC* Leaf dry matter content, LA1 Mean leaf area, A Net photosynthesis, E Transpiration rate, TUE Transpiration use efficiency, IS Stomatal index, DS Stomatal density, NN Preformed node count, LT Leaf thickness, C Competitor, S Stress-tolerator, R Ruderal. Nb Number of values, Min Minimum, Max Maximum, SE Standard error, V Variance, SD Standard deviation, CV Coefficient of variation, H^2^ Broad sense heritability, G Genotype, GxE Genotype-Environment interaction, ns Non-significant difference^*^ significant difference at P < 0.05^^ significant difference at P < 0.01^***^ significant difference at P < 0.001
Furthermore, comparisons of these traits at the two planting locations suggested the planting sites significantly affected transpiration use efficiency (TUE), E, leaf thickness (LT), S, and ruderal ecological strategy (R) variations within the panel (Fig. 1). Pearson’s correlation between traits was estimated, where negative and strong correlations were observed between E and TUE; S and R (Fig. 2A). Mean leaf area (LA1) was positively correlated with competitor ecological strategy (C), while negatively correlated with R (Fig. 2A). Interestingly, we observed weak correlations between most of traits, suggesting that breeding simultaneously for some of these stress responses-related traits would be possible.Fig. 1. Leaf morpho-physiological trait characterization at two planting sites, Duclos and Godet. Where LDMC = leaf dry matter content, LA1 = mean leaf area, A = net photosynthesis, E = transpiration rate, TUE = transpiration use efficiency, IS = stomatal index, DS = stomatal density, NN = preformed node count, LT = leaf thickness, C = competitor, S = stress-tolerator, R = ruderal ecological strategies. * significant difference at P < 0.05, ** significant difference at P < 0.01, ****significant difference at P < 0.0001, and ns refers to statistically non-significant differenceFig. 2Correlation among traits and overview of the competitor, stress-tolerator, ruderal (CSR) ecological strategies in our diversity panel. A Pearson’s correlation estimates among studied traits; (B) Position of yam genotypes of the D. alata diversity panel on Grime’s CSR triangle. Turquoise dots correspond to dryer site (Godet) and Salmon dots from wetter site (Duclos); Where LDMC = leaf dry matter content, LA1 = mean leaf area, A = net photosynthesis, E = transpiration rate, TUE = transpiration use efficiency, IS = stomatal index, DS = stomatal density, NN = preformed node count, LT = leaf thickness, C = competitor, S = stress-tolerator, R = ruderal ecological strategies; * significant difference at P < 0.05, ** significant difference at P < 0.01, *** significant difference at P < 0.001
Figure 2B represents the ecological strategy of yam genotypes as classified by Grime [49] into competitive ability (C), physiological tolerance to stress (S) and ruderality, i.e., adaptation to disturbance (R). There is quite a large diversity of physiological tolerance to stress (S-R axes) and the genotypes exhibited an important phenotypic plasticity illustrated by different behaviors in the two environments with contrasting climatic conditions (Fig. 2B and Fig. S2).
Genotyping and genome-wide association studies
A total of. 1.9 million high-quality SNPs were used for genome-wide association study (GWAS). The advanced multiple loci statistical model “Bayesian-information and linkage-disequilibrium iteratively nested keyway” implemented in the R package GAPIT3 [50] was employed. It has been proven more robust than the traditional Mixed Linear Model [51]. In this study, GWAS was independently conducted using phenotypic data from each location to identify environment-specific QTLs as well as stable QTLs across locations. The threshold for significant associations was set at log_10_P = 6.
At the two locations, we identified significant associations for all the traits, except for ruderal ecological strategy. We observed that for traits with high H^2^, similar genomic regions were stably identified at the two locations. For example, for stomatal density, which has an H^2^ = 0.87, a strong SNP rs1744535 at position 22,836,023 on Chromosome (Chr) 18 was identified at Godet (Fig. 3A, B and Table 2) while a close SNP rs1737071 at position 22,259,955 on Chr18 was detected at Duclos (Fig. 3C, D). Likewise, for transpiration rate, which has a very high H^2^ = 0.94 in our panel, GWAS resulted in a significant SNP rs205735 at position 326,438 on the Chr3 at Duclos and a close SNP rs202363 at position 346,038 on Chr3 at Godet (Fig. 3E-H).Fig. 3GWAS for stomatal density (DS) and transpiration rate (E) in D. alata. A Manhattan plot for DS at Duclos, with the peaks indicating significant GWAS signals and the dotted horizontal lines indicating the genome-wide significance threshold, (B) The QQ-Plot associated with DS at Duclos shows the -log_10_P of the expected vs. observed P values of each SNP (blue dots). The red line is a guide for the perfect fit to -log_10_P. The shaded area shows the 95% confidence interval for the QQ-plot under the null hypothesis of no association between the SNP and the trait, (C) Manhattan plot for DS at Godet, (D) The QQ-plot associated with the DS at Godet. E Manhattan plot for transpiration rate at Duclos, with the peaks indicating significant GWAS signals, and the dotted horizontal lines indicating the genome-wide significance threshold, (F) The QQ-Plot associated with transpiration rate at Duclos shows the -log_10_P of the expected vs. observed P values of each SNP (blue dots). G Manhattan plot for transpiration rate at Godet, (H) The QQ-plot associated with the transpiration rate at GodetTable 2Significant SNPs and their effect on stress response-related leaf traits in D. alataLocationTraitsSNPChrPositionAllelep-value (-log_10_)Effect (R^2^)GodetLMDCrs1185429Chr137,719,492G/A6.18E + 009.39%GodetISrs264342Chr312,192,098T/C6.07E + 0015.89%GodetErs205735Chr31,346,038T/C6.83E + 0025.28%GodetDSrs1744535Chr1822,836,023A/G6.96E + 0038.36%GodetArs1298027Chr146,889,304C/T6.10E + 0023.84%GodetCrs35673Chr19,542,330G/A7.47E + 0031.44%rs1938821Chr2011,950,212T/C6.52E + 0010.82%rs1570714Chr171,304,546A/G6.34E + 0010.49%rs214171Chr32,944,668C/T6.00E + 0012.85%DuclosTUErs304565Chr319,525,040A/G6.14E + 0012.11%rs185442Chr218,993,473G/A6.11E + 0019.56%rs1894629Chr201,613,539G/A6.06E + 009.60%DuclosNNrs1587198Chr174,889,485G/A6.40E + 0019.89%rs1254341Chr1324,382,368T/C6.26E + 0016.32%rs1414555Chr1513,757,209T/C6.12E + 0014.68%rs1330927Chr1414,848,380A/T6.07E + 0010.05%DuclosLTrs1091838Chr125,760,157G/A1.21E + 0131.32%DuclosLDMCrs450349Chr59,839,496G/A6.25E + 0011.36%DuclosLA1rs401519Chr580,613C/T7.19E + 0022.84%DuclosISrs1436584Chr1519,347,003T/A6.20E + 0015.80%DuclosErs202363Chr3326,438G/A6.84E + 009.23%DuclosDSrs1737071Chr1821,259,955G/A1.24E + 0136.09%DuclosSrs1610426Chr179,692,719A/T6.28E + 0022.19%rs1111390Chr1210,073,121T/G6.13E + 0024.42%LDMC Leaf dry matter content, LA1 Mean leaf area, A Net photosynthesis, E Transpiration rate, TUE Transpiration use efficiency, IS Stomatal index, DS Stomatal density, NN Preformed node count, LT Leaf thickness, C Competitor, S Stress-tolerator ecological strategiesThe alleles in bold letters correspond to the favorable alleles
However, this is not true for traits with lower H^2^. For instance, for leaf dry matter content we identified significant SNPs from different genomic regions (Chr5 and Chr13) at Godet and Duclos (Fig. 4A-D). Similarly, two SNPs on Chr15 (rs1436584) and Chr3 (rs264342) were identified for stomatal index at Godet and Duclos, respectively (Fig. 4E-G). Overall, 24 significant marker-trait associations were detected in this study (Fig. S3 and Table 2).Fig. 4GWAS for leaf dry matter content and stomatal index in D. alata. A Manhattan plot for leaf dry matter content at Duclos, with the peaks indicating significant GWAS signals, and the dotted horizontal lines indicating the genome-wide significance threshold, (B) The QQ-Plot associated with leaf dry matter content at Duclos shows the -log_10_P of the expected vs. observed P values of each SNP (blue dots). The red line is a guide for the perfect fit to -log_10_P. The shaded area shows the 95% confidence interval for the QQ-plot under the null hypothesis of no association between the SNP and the trait, (C) Manhattan plot for leaf dry matter content at Godet, (D) The QQ-plot associated with the leaf dry matter content at Godet. (E) Manhattan plot for stomatal index at Duclos, with the peaks indicating significant GWAS signals, and the dotted horizontal lines indicating the genome-wide significance threshold, (F) The QQ-Plot associated with stomatal index at Duclos shows the -log_10_P of the expected vs. observed P values of each SNP (blue dots). G the Manhattan plot for stomatal index at Godet, and (H) The QQ plot associated with the stomatal index at Godet
Characterization of peak SNPs for their allelic effects on the traits
The favorable alleles at each significant locus were identified and the phenotypic variance explained was computed (Table 2). For example, the SNP (Chr18: rs1737071) could explain 36% of the stomatal density variation in our panel at Duclos (Table 2). We observed that the heterozygote accessions (GA) at this locus had significantly higher stomatal density than the homozygous accessions (GG) (Fig. 5). Hence the accessions with the GA genotype could better control water loss rate and CO_2_ uptake [52]. Similarly, SNP (Chr5: rs450349) explained 11.36% of the variation with the allele GA associated with higher leaf dry matter content compared to GG (Fig. 5). High stomatal density and leaf dry matter content have been linked to improved photosynthetic induction and biomass production in plants [53]. Moreover, other peak SNPs detected at Duclos, and the nine peak SNPs detected at Godet were characterized for their favorable alleles (Figs. 5 and 6).Fig. 5. Allelic effect of 15 significant SNPs identified at Duclos. LDMC = leaf dry matter content, LA1 = mean leaf area, A = net photosynthesis, E = transpiration rate, TUE = transpiration use efficiency, IS = stomatal index, DS = stomatal density, NN = preformed node count, LT = leaf thickness, S = stress-tolerator ecological strategy. * significant difference at P < 0.05, ** significant difference at P < 0.01, *** significant difference at P < 0.001 and **** significant difference at P < 0.0001Fig. 6Allelic effect of nine significant SNPs identified at Godet. A = net photosynthesis, DS = stomatal density, E = transpiration rate, IS = stomatal index, LDMC = leaf dry matter content, C = competitor ecological strategy. * significant difference at P < 0.05, ** significant difference at P < 0.01, ** significant difference at P < 0.001 and **** significant difference at P < 0.0001
Identification of candidate genes associated to the stress response leaf traits
We searched for candidate genes controlling the studied traits around the associated significant SNPs in a window size of 5 kb [7]. Overall, 44 genes with diverse biological functions were extracted. Sixteen genes with known functions were identified as putative candidates for physiological attributes associated with stress response. For the stomatal density trait at Duclos, the peak SNP was located between two genes (Dioal.18G049200 and Dioal.18G049300) (Table 3). There was no functional annotation for Dioal.18G049200, but the gene Dioal.18G049300 was annotated as a 3-keto acyl-coenzyme A synthase. At Godet, the peak SNP were identified downstream of Dioal.18G055600 annotating Glutathione S-transferase. We speculate that Dioal.18G049300 and Dioal.18G055600 could be the potential regulators of stomatal density in D. alata.Table 3. List of candidate genes associated with stress response-related leaf traits in greater yamTraitsSNPUpstream the gene/downstream the geneLocalizationFunctionGodet_LMDCrs1185429Dioal.13G049900intergenicRetrotransposon proteinDioal.13G050000Neprosin_APGodet_ISrs264342Dioal.03G049700intergenicSHR-BDDioal.03G049800Major facilitator superfamily proteinGodet_Ers205735Dioal.03G019500intergenicFatty acid hydroxylase superfamilyDioal.03G019600Nodulin MtN21/EamA-like transporter family proteinGodet_DSrs1744535Dioal.18G055600downstreamGLUTATHIONE S-TRANSFERASEGodet_Ars1298027Dioal.12G033500intergenicABC-2 type transporter family proteinDioal.12G033600Phosphatidyl inositol monophosphate 5 kinase 4Godet_Crs35673Dioal.01G024000intergenicIRON/ASCORBATE OXIDOREDUCTASEDioal.01G024100RNA-directed DNA polymerasers1938821Dioal.20G032000intergenicNADioal.20G032100PROTEASE DO-LIKE 1rs1570714Dioal.17G018200upstreamS-ADENOSYLMETHIONINE CARRIER 2rs214171Dioal.03G033700intergenicLeucine Rich RepeatDioal.03G033800F-box domain and LRR containing proteinDuclos_TUErs304565Dioal.03G073900intergenicAnkyrin repeat family proteinDioal.03G074000Seed imbibition 2rs185442Dioal.02G062100exonicNon-specific serine/threonine protein kinasers1894629Dioal.20G005200intergenicProtein phosphatase 2 C family proteinDioal.20G005300Non-specific serine/threonine protein kinaseDuclos_NNrs1587198Dioal.17G048200intergenicCCT motif family proteinDioal.17G048300UDP-D-glucose/UDP-D-galactose 4-epimerase 5rs1254341Dioal.13G076500intergenicExostosin familyDioal.13G076600NArs1414555Dioal.15G047700intergenicLipid transfer protein 12Dioal.15G047800Non-specific serine/threonine protein kinasers1330927Dioal.14G073400intergenicS-adenosyl-L-methionine-dependent methyltransferase proteinDioal.14G073500pentatricopeptideDuclos_LTrs1091838Dioal.12G033000intergenicNADioal.12G033100Domain of unknown function (DUF4228)Duclos_LDMCrs450349Dioal.05G072500intergenicChloroplast sensor kinaseDioal.05G072600NADuclos_LA1rs401519Dioal.05G000800intergenicNon-specific serine/threonine protein kinaseDioal.05G000900DNA/RNA helicase proteinDuclos_ISrs1436584Dioal.15G069300intergenicBifunctional inhibitor/lipid-transfer protein/seed storage 2S albumin superfamily proteinDioal.15G069400ARM repeat superfamily proteinDuclos_Ers202363Dioal.03G004300intronicHeavy metal ATPase 4Duclos_DSrs1737071Dioal.18G049200intergenicNADioal.18G049300Very-long-chain 3-ketoacyl-CoA synthaseDuclos_Srs1610426Dioal.17G055400intergenicNADioal.17G055500Tetratricopeptide repeat domain containing proteinrs1111390Dioal.12G035200intergenicWD domain, G-beta repeat (WD40)Dioal.12G035300Retrotransposon gag proteinLDMC Leaf dry matter content, LA1 Mean leaf area, A Net photosynthesis, E Transpiration rate, TUE Transpiration efficiency, IS Stomatal index, DS Stomatal density, NN Preformed node count, LT Leaf thickness, C Competitor ecological strategy, S Stress-tolerator ecological strategy
Net photosynthesis showed one association signal rs1298027 on Chr14, accounting for 23.84% of the phenotypic variance (Table 2). The peak SNP was located between Dioal.12G033500 and Dioal.12G033600, annotated as ABC-2 type transporter family protein and Phosphatidyl inositol monophosphate 5 kinase 4, respectively. Moreover, three putative candidate genes (Dioal.03G019500, Dioal.03G019600, and Dioal.03G004300) for transpiration rate, five (Dioal.03G073900, Dioal.03G074000, Dioal.02G062100, Dioal.20G005200, and Dioal.20G005300) for transpiration efficiency, and four (Dioal.03G049700, Dioal.03G049800, Dioal.15G069300, and Dioal.15G069400) for stomatal index were identified, some containing exonic and intronic SNPs.
For leaf morphological traits and preformed node count, 13 putative candidate genes were identified on different chromosomes. Retrotransposon protein, Neprosin_AP, and Chloroplast sensor kinase were identified as putative candidate genes for leaf dry matter content. Dioal.17G048200, Dioal.17G048300, Dioal.13G076500, Dioal.15G047700, Dioal.15G047800, Dioal.14G073400, and Dioal.14G073500 were identified for preformed node count (Table 3). Domain of unknown function (DUF4228), Non-specific serine/threonine protein kinase, and DNA/RNA helicase protein were identified as candidate genes for mean leaf area and leaf thickness.
For competitor and stress-tolerator ecological strategies, we identified 11 genes around the significant SNPs with some genes (Iron/ascorbate oxidoreductase, F-box domain and S-adenosylmethionine) well known to be involved in stress responses in plants (Table 3) [54–57].
Gene ontology enrichment analysis of the candidate genes highlighted several terms related to leaf morphogenesis and stress response, including regulation of gene expression, regulation of photosynthesis, wax biosynthetic process, response to water deprivation, cuticle development, stomatal movement, cellular response to starvation, auxin − activated signaling pathway (Fig. 7). All these results suggest that the candidate genes detected in this study have potential for enhancing stress response in D. alata genotypes.Fig. 7. Gene ontology enrichment for the candidate genes detected around the significant SNPs associated with stress response-related leaf traits in greater yam
Discussion
In this study, we investigated the genetic basis for several leaf traits related to stress response through genome-wide association studies (GWAS). Although QTL mapping and GWAS have been successfully implemented for various traits in yams [23, 25–28, 58, 59], stress-related traits have not yet been characterized using GWAS or other genetic approaches [7].
In this study, GWAS resulted in the identification of 24 significant associations with a stringent threshold (log_10_P = 6), which was much higher than previously published reports [23, 25, 28]. A stringent threshold increased the significance of identified SNPs and candidate genes but may have reduced the number of significant associations [7]. Despite successfully identifying genetic variants associated with these traits, the phenotypic variation explained are much lower relative to heritability estimates. This has been reported to be related to the presence of structural variations, genotype-environment interactions, epistasis, origin, and errors in heritability estimates [60, 61]. However, we identified consistent associations at two locations where trait heritability estimates were high (E and DS). These results are consistent with previous reports suggesting the identification of stable QTLs for traits with high heritability [62, 63].
Identification and characterization of alleles associated with key SNPs enable us to understand the effect of significant associations on the leaf traits [7, 64]. Response to abiotic stress is a complex mechanism [65]. During stress, photosynthesis is mainly affected, and plants tend to close their stomata, simultaneously restricting the inflow of CO_2_ and reducing the photosynthesis rate [66]. We identified 24 advantageous alleles with positive contributions to the studied traits. It is important to mention that although the traits studied are known to be involved in stress response in plants, further studies are needed to check how the favorable alleles at the marker-trait associations influence stress response in greater yam genotypes. Hence, abiotic stress experiments can be carried out using selected genotypes in our diversity panel to confirm the relationship between the leaf traits, the alleles at the associated SNPs and stress response. Genotypes with advantageous alleles (associated with trait performance) could be further utilized in breeding programs to accumulate the desirable variation for developing resilient cultivars [67, 68]. Genomic-assisted breeding which has been successful in the development of resilient crops against stress, such as wheat [69, 70] and rice [71, 72] could be applied in greater yam.
The gene Dioal.18G049300 annotated as 3-keto acyl-coenzyme A synthase (KCS) enzyme was identified as a putative candidate gene for DS, which is involved in synthesizing very long-chain fatty acids. It has been demonstrated that the Arabidopsis thaliana KCS gene (hic) controls stomatal development through CO_2_ perception, and the mutant plants displayed a 42% increase in stomatal density in response to elevated CO_2_ [73]. Another gene Dioal.18G055600 was identified, annotated as Glutathione s-transferase (GST). GST has been shown to control plant response to a wide range of biotic and abiotic stress conditions [74–76].
Similarly, Dioal.12G033500 (ABC-2 type transporter family protein) was identified as a putative candidate gene for net photosynthesis. A previous report suggests that disruption of ATP-binding cassette transporters causes deregulation of stomatal opening and increases drought susceptibility [77]; therefore, variation in Dioal.12G033500 function or expression could explain the photosynthesis variation in the GWAS panel and could be an excellent candidate for further functional verification in D. alata. Retrotransposon protein [78], Domain of unknown function (DUF4228) [79, 80], Non-specific serine/threonine protein kinase [81, 82], DNA/RNA helicase protein [83, 84] have also been characterized for their potential role in coping with stress conditions and maintaining the plant growth. Gene expression data facilitate the identification of candidate genes from GWAS projects since genetic variants falling in genic or intergenic regions often lead to non-functional genes or altered gene expression. There is no transcriptome data related abiotic stress response available in greater yam. Therefore, we recommend that a future study can generate gene expression data under various stresses to support the ongoing genetic studies.
Conclusions
We successfully employed GWAS to detect genomic signals (24) and candidate genes (44) linked to leaf traits related to stress response in Dioscorea alata. Traits with high heritability estimates, stomatal density, and transpiration rate, were identified with consistent GWAS signals on Chr18 and Chr3. Nonetheless, additional efforts are needed to enlarge the diversity panel to improve the GWAS power and detect more marker-trait associations. Accessions accumulating favorable alleles at the different significant loci will be used as genitors in our breeding programs. Moreover, developing allele-specific markers for the strong and stably detected significant marker-trait associations will improve marker-assisted selection, introgression, and the pyramiding of favorable alleles/genes in greater yam cultivars.
Methods
Plant material and leaf morpho-physiological characterization
Plant materials used in this study include 53 genotypes of Dioscorea alata L. [28] (Table S1). This panel comprises genotypes from nine countries of the yam belt countries of west Africa, the Caribbean, and the Pacific islands. The plant materials were obtained from the germplasm collection of the Centre de coopération Internationale en Recherche Agronomique pour le Développement, Guadeloupe and the Biological Resource Centre for tropical plants in the West Indies. The plant materials were planted at two locations, Duclos (16°120′ N, 61°39′ O, 125 m above sea level (a.s.l.)), and Godet (16°20′ N, 61°30′ 0.10 m a.s.l.), in Guadeloupe. The two locations have contrasting climatic conditions (Fig. S2). A total of 10 seedlings of each cultivar were planted in three replicates (30 seedlings per genotype in total). These plants were spread over three ridges (65 m long) spaced 30 cm apart within the ridges. Cane straw was used as mulch over the entire plot to limit weeds at Godet, while paper mulch was used at Duclos. The plot was drip irrigated, and planting started in March 2021. Genotypes were planted from harvested seeds at year n-1 when 50% of the tubers of the genotype germinated in the storage shed. All the genotypes were characterized for 12 morpho-physiological traits associated with stress response, including leaf dry matter content (LDMC), mean leaf area (LA1), net photosynthesis (A), transpiration rate (E), transpiration efficiency (TUE), stomatal index (IS), stomatal density (DS), preformed node count (NN), leaf thickness (LT), C = competitor, S = stress-tolerator, R = ruderal ecological strategies as classified by Grime.
Traits were characterized prior to tuber initiation, between 45 and 60 days after emergence, to ensure the presence of enough mature leaves. LDMC was measured using three fully mature leaves collected from each genotype. Fresh leaf samples were always taken in the early morning hours, between 6 and 8 am, when relative humidity was still high (70–95%) and temperatures were around 25 °C. The leaves were wrapped in similarly-sized wet papers to avoid drying and transported to the laboratory in a cooler. Fresh weight was measured immediately after collection, while dry weight was determined after drying the leaves in an oven at 60 °C for three days. LDMC was calculated using the formula.
\documentclass[12pt]{minimal} \usepackage{amsmath} \usepackage{wasysym} \usepackage{amsfonts} \usepackage{amssymb} \usepackage{amsbsy} \usepackage{mathrsfs} \usepackage{upgreek} \setlength{\oddsidemargin}{-69pt} \begin{document}$$LDMC=\frac{Leaf\;dry\;weight}{leaf\;fresh\;weight}$$\end{document}Leaf area estimation was performed using the LiCor 3100c planimeter (LI-COR Biosciences, Lincoln, NE, USA). Leaf thickness was measured using a digital micrometer (Mitutoyo, Kawasaki, Japan). Each leaf was gently placed between the micrometer jaws, and measurements were taken at three different points along the leaf to ensure accuracy and consistency.
The estimation of the CSR ecological strategy was conducted using the methodology developed by Pierce et al. [85]. This approach involves assessing plant traits that correspond to the competitive, stress-tolerant, and ruderal strategies in plants. NN was recorded for 3 plants of each genotype and corresponds to the number of juvenile phytomers from the stem apex to the first node carrying a mature leaf.
Determination of stomatal density and index
Samples were collected in the morning before 9 am. The stomata are present on the abaxial surface of the leaf [86]. To estimate the stomatal density, the procedure was adapted from Paul et al. [87] to prepare the slides for microscopic observations using suitable replica fluid/adhesive. The slides were then observed under a microscope with 40 × magnification, and 60 images were saved for each genotype with ZEN software (Carl Zeiss microscope, GmbH, version 2.3, blue version, 2011). ZEN allows us to directly convert the number of pixels to metric units and get the scale of the captured image. We calculated DS and IS by the following formula.
\documentclass[12pt]{minimal} \usepackage{amsmath} \usepackage{wasysym} \usepackage{amsfonts} \usepackage{amssymb} \usepackage{amsbsy} \usepackage{mathrsfs} \usepackage{upgreek} \setlength{\oddsidemargin}{-69pt} \begin{document}$$DS=\frac{Nb\;stomata}{Image\;surface}\times10^6$$\end{document} \documentclass[12pt]{minimal} \usepackage{amsmath} \usepackage{wasysym} \usepackage{amsfonts} \usepackage{amssymb} \usepackage{amsbsy} \usepackage{mathrsfs} \usepackage{upgreek} \setlength{\oddsidemargin}{-69pt} \begin{document}$$IS=\frac{Nb\;stomata}{Nb\;stomata+Nb\;cellular}\times100$$\end{document}where Nb stomata is the number of stomata per unit area, and Nb cellular is the number of epidermal cells per unit area.
Gas exchange measurement
To estimate the gaseous exchange (A, E, TUE), we used ADC LCPro + infrared gas exchange analyzer (ADC bioscience, Hodstone UK Limited). All measurements were taken from 7 to 9 am in the morning. The parameters were set as follows: temperature 30 °C, saturation brightness is 1400 µ mol photon m^−2^ s^−1^, while relative humidity was stable (80%). We estimated A and E and then calculated transpiration use efficiency by the following formula
\documentclass[12pt]{minimal} \usepackage{amsmath} \usepackage{wasysym} \usepackage{amsfonts} \usepackage{amssymb} \usepackage{amsbsy} \usepackage{mathrsfs} \usepackage{upgreek} \setlength{\oddsidemargin}{-69pt} \begin{document}$$TUE=\frac{A}{E}$$\end{document}Genome-wide association studies
Dossa et al. [29] fully detailed the DNA extraction, sequencing and data processing steps. GWAS was performed with all 1.9 million SNPs using the advanced multiple loci model statistical model Bayesian-information and linkage-disequilibrium iteratively nested keyway (BLINK) implemented in the R package “GAPIT3” [50]. BLINK provides an efficient platform with increased power compared to other methods, while reducing the calculation time. The Manhattan plots were also generated in R4.0.23 with the “CMplot” package [88]. SNPs having a significant association with traits were determined by the adjusted p-value. The threshold of P < 10^–8^ (0.05/n, with n = number of SNPs) was set to report a significant association. The quantile–quantile (QQ) plots were generated by plotting the negative logarithms (− log_10_) P-values relative to their expected p-values to fit model relevance GWAS with the null hypothesis of no association and to determine to what extent the models considered the structure of the population.
Putative candidate gene identification
To inventory potential genes near associated SNP markers for target traits, we used ANNOVAR version 2.4 to identify genes downstream and upstream of the significant SNPs based on linkage disequilibrium (LD = 5 Kb) [29]. The identified candidate genes were screened for their putative functional attributes. Subsequently, we extracted the related genes and conducted a Gene Ontology (GO) enrichment analysis using the KOBAS-i tool. The significantly enriched GO terms were then visualized using the “ggplot” package from the R4.0.23 software.
Statistical analysis
The effect of alleles at significant SNPs was assessed by comparing phenotyping data for haplotype groups. A Student's t-test was used to compare the groups of haplotypes (P < 0.05) in the R4.0.23 software with the “ggpubr” and “rstatix” packages.
Using the LME4 package [89] available on R4.0.23, we considered the genotype as a random effect to obtain the variance components of all the traits: Trait ~ (1|genotype) + (1|location) + (1|location:genotype). We then calculated phenotypic variance share of genetic source as broad sense heritability (H^2^) according to Falconer and Mackay [90]:
\documentclass[12pt]{minimal} \usepackage{amsmath} \usepackage{wasysym} \usepackage{amsfonts} \usepackage{amssymb} \usepackage{amsbsy} \usepackage{mathrsfs} \usepackage{upgreek} \setlength{\oddsidemargin}{-69pt} \begin{document}$${H}^{2}=\frac{{\sigma }^{2}g}{{\sigma }^{2}g+ \raisebox{1ex}{${\sigma }^{2}g*e$}\!\left/ \!\raisebox{-1ex}{$E$}\right.+\raisebox{1ex}{${\sigma }^{2}e$}\!\left/ \!\raisebox{-1ex}{$N$}\right.+{\sigma }^{2}\varepsilon }$$\end{document}where σ^2^g is genotype variance, \documentclass[12pt]{minimal} \usepackage{amsmath} \usepackage{wasysym} \usepackage{amsfonts} \usepackage{amssymb} \usepackage{amsbsy} \usepackage{mathrsfs} \usepackage{upgreek} \setlength{\oddsidemargin}{-69pt} \begin{document}$${\sigma }^{2}g*e$$\end{document} is Genotype-by-environment interaction variance, \documentclass[12pt]{minimal} \usepackage{amsmath} \usepackage{wasysym} \usepackage{amsfonts} \usepackage{amssymb} \usepackage{amsbsy} \usepackage{mathrsfs} \usepackage{upgreek} \setlength{\oddsidemargin}{-69pt} \begin{document}$${\sigma }^{2}e$$\end{document} is Environmental variance, \documentclass[12pt]{minimal} \usepackage{amsmath} \usepackage{wasysym} \usepackage{amsfonts} \usepackage{amssymb} \usepackage{amsbsy} \usepackage{mathrsfs} \usepackage{upgreek} \setlength{\oddsidemargin}{-69pt} \begin{document}$${\sigma }^{2}\varepsilon$$\end{document} is Residual variance, E is Number of environments and N is Number of replicates per genotype in each environment.
The basic descriptive analysis of the stress response-related leaf traits was performed by statistix 8.1. Pearson’s correlation analysis between different stress response-related traits was performed by R4.0.23 using the “corrplot” package [91]. The differences in two planting sites for each trait were estimated using analysis of variance according to Steel et al. [92]. AOV-function in R4.0.23 was employed to perform analysis of variance. P-value < 0.05 was regarded as significant.
Supplementary Information
Supplementary Material 1. Supplementary Material 2. Supplementary Material 3. Supplementary Material 4.
The reference list from the paper itself. Each links out to its DOI / PubMed record.
- 1Yasir M, He SP, Sun GF, Geng XL, Pan ZE, Gong WF, et al. A genome-wide association study revealed key SN Ps/genes associated with salinity stress tolerance in upland cotton. Genes. 2019;10(10) :1-12.10.3390/genes 10100829 PMC 682653631640174 · doi ↗ · pubmed ↗
- 2Sarfraz Z, Iqbal MS, Geng X, Iqbal MS, Nazir MF, Ahmed H, He S, Jia Y, Pan Z, Sun G. GWAS mediated elucidation of heterosis for metric traits in cotton (Gossypium hirsutum L.) across multiple environments. Front Plant Sci. 2021;12:566.10.3389/fpls.2021.565552 PMC 817305034093598 · doi ↗ · pubmed ↗
- 3Leng Z-X, Liu Y, Chen Z-Y, Guo J, Chen J, Zhou Y-B, Chen M, Ma Y-Z, Xu Z-S, Cui X-Y. Genome-wide analysis of the DUF 4228 family in soybean and functional identification of Gm DUF 4228–70 in response to drought and salt stresses. Front Plant Sci. 2021;12:680.10.3389/fpls.2021.628299 PMC 816623434079564 · doi ↗ · pubmed ↗
- 4Yin L. C Mplot: circle manhattan plot. C Mplot: Circle Manhattan Plot 2020. https://github.com/Yin Li Lin/C Mplot.