Derivation of a health‐based guidance value for Δ8 ‐tetrahydrocannabinol (Δ8 ‐THC) and its occurrence in food
Helle Katrine Knutsen, Agneta Åkesson, Vasileios Bampidis, Margherita Bignami, James Kevin Chipman, Gisela Degen, Antonio Hernández‐Jerez, Tim Hofer, Christer Hogstrand, Stefano Landi, Jean‐Charles Leblanc, Kyriaki Machera, Evangelia Ntzani, Isabelle P. Oswald, Guido Rychen

TL;DR
This paper derives a health-based guidance value for Δ8-THC in food and assesses its occurrence alongside Δ9-THC in hemp products.
Contribution
The study provides a relative potency factor and acute reference dose for Δ8-THC based on clinical data and occurrence analysis.
Findings
The relative potency of Δ9-THC to Δ8-THC was estimated between 1 and 1.4.
An acute reference dose of 1 μg/kg body weight was proposed for Δ8-THC.
High detection rates of Δ8-THC were found in sweet and supplement products, suggesting possible enrichment or synthetic addition.
Abstract
The European Food Safety Authority (EFSA) was asked to deliver a scientific opinion on the derivation of a health‐based guidance value (HBGV) for Δ8‐tetrahydrocannabinol (Δ8‐THC) in food with an assessment of the occurrence of Δ8‐THC and the co‐occurrence with Δ9‐THC in hemp and hemp‐derived products. Data from a clinical study were used to inform on the relative potency between Δ9‐THC and Δ8‐THC. The point estimate of the relative potency (ratio Δ9‐THC/Δ8‐THC) was in the range between 1 and 1.4, with 95% confidence between 0.97 and 1.63. Based on this range, the CONTAM Panel, using a conservative approach, set a relative potency factor of one for Δ8‐THC. The CONTAM Panel had previously set an acute reference dose (ARfD) of 1 μg/kg body weight for Δ9‐THC derived from adverse effects on human central nervous system (CNS). Given the similarity in the effects and the mode of action between…
Genes, proteins, chemicals, diseases, species, mutations and cell lines named across the full text — each resolved to its canonical identifier and authoritative record.
Click any figure to enlarge with its caption.
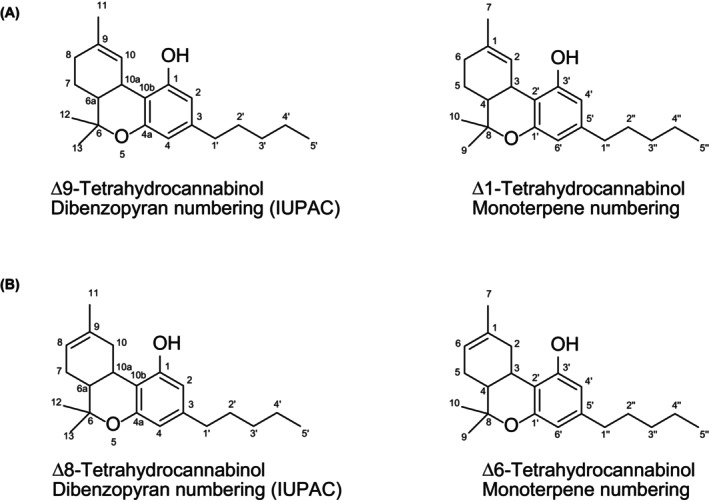 FIGURE 1
 FIGURE 2
 FIGURE 3
 FIGURE 4
 FIGURE 5
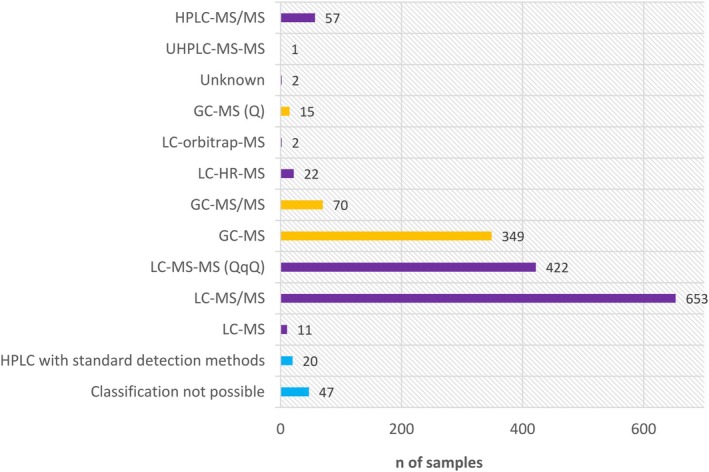 FIGURE 6
 FIGURE 7
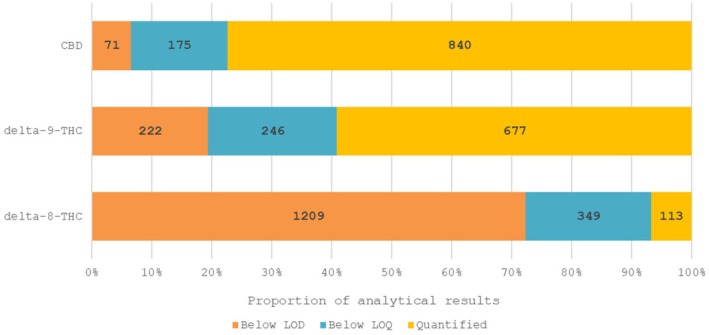 FIGURE 8
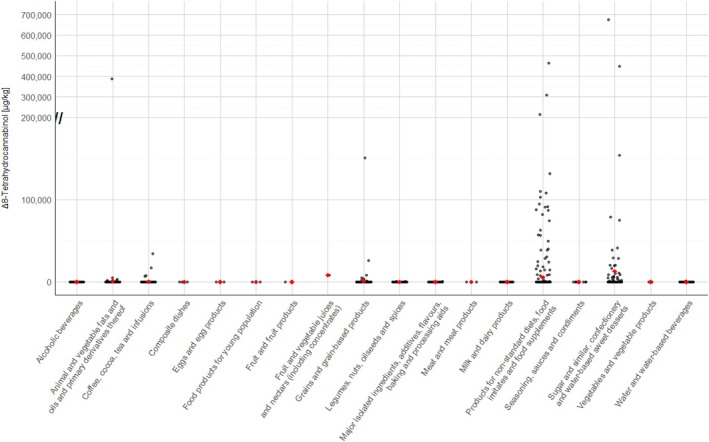 FIGURE 9
 FIGURE 10
 FIGURE 11
| THC isomers and dosage | Cmax (ng/mL) | Tmax (h) | AUC (ng/mL.h) |
|---|---|---|---|
| 10 mg Δ8‐THC | 2.5 (0.8–5.8) | 2.4 (1.5–4.0) | 10.7 (3.1–27.1) |
| 20 mg Δ8‐THC | 5.9 (1.5–12.2) | 2.6 (1.0–4.0) | 28.4 (6.9–82.9) |
| 40 mg Δ8‐THC | 15.1 (3.5–45.2) | 2.8 (2.0–4.0) | 62.1 (13.6–143.8) |
| 20 mg Δ9‐THC | 4.2 (1.5–8.9) | 2.4 (1.0–3.0) | 19.3 (9.1–34.9) |
| THC isomers and dosage | Ratio Δ8‐THC/11‐OH‐Δ8‐THC | Ratio Δ9‐THC/11‐OH‐Δ9‐THC | Ratio Δ8‐THC/11‐nor‐9‐carboxy‐Δ8‐THC | Ratio Δ9‐THC/11‐nor‐9‐carboxy‐Δ9‐THC |
|---|---|---|---|---|
| 10 mg Δ8‐THC | 2.5 | ND | 0.06 | ND |
| 20 mg Δ8‐THC |
| ND |
| ND |
| 40 mg Δ8‐THC | 3.8 | ND | 0.11 | ND |
| 20 mg Δ9‐THC | ND |
| ND |
|
| Compound (purity) | Vehicle | LD50 mg/kg bw | |
|---|---|---|---|
| Male | Female | ||
| Δ9‐THC (90%) | 2.5% ethanol in sesame oil | 1910 (1390–2680) | 1040 (820–1320) |
| Δ9‐THC (96%) | Sesame oil | 1015 (780–1320) | 800 (630–1010) |
| Δ8‐THC (99%) | 2.5% ethanol in sesame oil | 1980 (1580–2470) | 860 (680–1090) |
| CME | Sesame oil | 3300 (2480–4390) | 1380 (950–2020) |
| Reference | Animals | Vehicle/purity | Exposure | Findings | Dose–response descriptors | |
|---|---|---|---|---|---|---|
| Δ8 ‐THC | Δ9 –THC | |||||
| Inhibition of locomotor activity and other behavioural changes | ||||||
| Brown ( |
Mice, CF1 Male, 18–25 g
|
Purity and source: not reported |
i.p., 0, 3.2, 10, 32 mg/kg bw, 15 min Volume: 0.1 mL/10 g bw | Decrease of locomotor activity |
NOAEL: 10 mg/kg bw (12.5% inhibition vs. 0) LOAEL: 32 mg/kg bw (43.5% inhibition vs. 0) |
NOAEL: 3.2 mg/kg bw (14.6% inhibition vs. 0) LOAEL: 10 mg/kg bw (24.6% vs. 0) |
| Janoya et al. ( |
Mice, albino ICR Male, 22–35 days old
Head‐twitch response (HTR) and ear‐scratch response (ESR) were induced a selective CB1 receptor antagonist, 2.5 mg/kg bw, i.p. |
1:1:18 ethanol, emulphor and 0.9% saline Purity: not reported Source: Commercial |
i.p.,
Volume: 10 mg/kg bw | Decrease of locomotor activity | ED50 = 10.5 mg/kg bw, 95% CL = 6.3–17.4 | ED50 = 9.3 mg/kg bw, 95% CL = 5.2–16.8 |
| Decrease in rear frequency | ED50 = 9.2 mg/kg bw 95% CL 6.1–13.7 | ED50 = 8.4 mg/kg bw, 95% CL = 5.4–12.8 | ||||
| Reduction of the induced head‐twitch response (HTR) |
ID50 = 9.98 mg/kg bw 95% CL = 3.4–26.2 | ID50 = 4.4 mg/kg bw, 95% CL = 3.4–5.7 | ||||
| Reduction of the induced ear‐scratch response (ESR) |
ID50 = 18.6 mg/kg bw 95% CL = 6.9‐50 | ID50 = 2.6 mg/kg bw, 95% CL = 1.1–6.1 | ||||
| Modulation of central excitatory effects | ||||||
| Consroe and Man ( |
Rat Female, 180–195 g
|
Suspended in 10% Tween 80 in saline Purity and source: not reported |
i.v. (tail vein)
| Decrease in audiogenic seizures | ED50 = 4.7 mg/kg (95% CL 3.11–7.09) | ED50 = 3.3 mg/kg (95% CL 2.00–5.45) |
| Decrease in maximal electroshock seizure (MES) | ED50 = 2.6 mg/kg (95% CL 1.57–4.29) |
ED50 = 4.25 mg/kg (95% CL 2.21–7.8). Not significant vs. Δ8 | ||||
| Cannabimimetic effects | ||||||
| Vanegas et al. ( |
Mice, C57BL/6J male and female
|
5% EtOH, 5% Kolliphor EL, 90% saline
Purity: 92% Synthetised from hemp‐derived CBD (< 0.18% Δ9 THC)
|
0, 6.25, 12.5, 25, 50, 100 mg/kg bw
| Catalepsy | ED50 = 58.47 mg/kg bw (95% CI: 44.58–76.71) | ED50 = 8.99 mg/kg bw (95% CI: 6.44–12.55) |
| Antinociception | 100 mg/kg bw | 30 mg/kg bw | ||||
| Hypothermia |
NOAEL: 12 mg/kg bw LOAEL: 25 mg/kg bw |
NOAEL: 1 mg/kg bw LOAEL: 10 mg/kg bw | ||||
| Reference | Animals | Vehicle/purity | Exposure | Findings | Dose–response descriptors | |
|---|---|---|---|---|---|---|
| Δ8 ‐THC | Δ9 ‐THC | |||||
| Wiley et al. ( |
Mice, C57BL/6J trained with Δ9 5.6 mg/kg bw, i.p.
|
7.8% polysorbate 80 in saline Purity: 96.1% |
i.p.,
| Increase in responding on the Δ9 ‐associated feeder |
ED50: 3.61 mg/kg bw 95% CI = 2.6–5
ED50:7.79 mg/kg bw, 95% CI = 5.62–10.8 |
ED50: 1.19 mg/kg bw 95% CI = 0.94–1.52
ED50:1.88 mg/kg bw, 95% CI = 1.51–2.33 |
| Study | Cell lines used | EC50 (nM) for Δ8‐THC | EC50 (nM)for Δ9‐THC | ||
|---|---|---|---|---|---|
| CB1 | CB2 | CB1 | CB2 | ||
|
Govaerts et al. ( | CHO cells | ND | 1.32 | ND | 23.4 |
| Husni et al. ( | HEK293 cells | 5820 | 524 | 269 | 327 |
| Gerard et al. ( | CHO cells | 82 | ND | 13 | ND |
| Effect | Time of the maximum relative potency | Maximum relative potency | 95% CI lower | 95% CI upper |
|---|---|---|---|---|
| DAT | 4 h | 1.4 | 1.21 | 1.63 |
| DRUID | 4 h | 1.05 | 1.02 | 1.07 |
| DSST | 4 h | 1.1 | 1.05 | 1.16 |
| PASAT | 4 h | 1.0 | 0.97 | 1.09 |
| Heart rate | 2.5 h | 1.1 | 1.04 | 1.13 |
| Food category, FoodEx2 level 1 |
| %LC | P 50 | P 75 | P 95 | |||
|---|---|---|---|---|---|---|---|---|
| LB | UB | LB | UB | LB | UB | |||
| Alcoholic beverages | 41 | 98 | 0 | 4 | 0 | 10 | ||
| Animal and vegetable fats and oils and primary derivatives thereof | 347 | 98 | 0 | 100 | 0 | 200 | 0 | 500 |
| Coffee, cocoa, tea and infusions | 210 | 98 | 0 | 50 | 0 | 100 | 0 | 5000 |
| Grains and grain‐based products | 147 | 91 | 0 | 20 | 0 | 20 | 350 | 1000 |
| Legumes, nuts, oilseeds and spices | 167 | 99 | 0 | 40 | 0 | 150 | 0 | 500 |
| Major isolated ingredients, additives, flavours, baking and processing aids | 25 | 96 | 0 | 50 | 0 | 250 | ||
| Milk and dairy products | 30 | 100 | 0 | 2 | 0 | 2 | ||
| Products for non‐standard diets, food imitates and food supplements | 487 | 91 | 0 | 200 | 0 | 25,100 | 24,000 | 75,000 |
| Seasoning, sauces and condiments | 14 | 100 | 0 | 20 | 0 | 50 | ||
| Sugar and similar, confectionery and water‐based sweet desserts | 134 | 78 | 0 | 50 | 0 | 1510 | 39,100 | 39,100 |
| Water and water‐based beverages | 53 | 85 | 0 | 2 | 0 | 18 | ||
| Food category, FoodEx2 level 5 | N | N of quantified results | LC (%) | Range of quantified values | |
|---|---|---|---|---|---|
| Minimum | Maximum | ||||
| Hemp seed oil | 336 | 5 | 99 | 199 | 34,600 |
| Hemp infusion leaves | 115 | 5 | 96 | 510 | 3200 |
| Hemp seeds | 158 | 2 | 99 | 400 | 490 |
Peer Reviews
No public reviews on file for this paper yet. If you reviewed it on a platform where reviews are public (OpenReview, ICLR, NeurIPS, ICML), you can paste yours below so the community can read it here.
Videos
No videos yet. Explain this paper in a talk, walkthrough, or lecture? Add one.
Taxonomy
TopicsCannabis and Cannabinoid Research · Carcinogens and Genotoxicity Assessment · Agricultural safety and regulations
SUMMARY
Following a request from the European Commission, the EFSA Panel on Contaminants in the Food Chain (CONTAM Panel) was asked to deliver a scientific opinion on the derivation of a health‐based guidance value (HBGV) for Δ^8^‐tetrahydrocannabinol (Δ^8^‐THC) in food with an assessment of the occurrence of Δ^8^‐THC and the co‐occurrence with Δ^9^‐THC in hemp and hemp‐derived products.
Δ^8^‐THC is naturally formed by isomerisation from the thermodynamically less stable Δ^9^‐THC. In the hemp plant, Δ^9^‐THC is formed by a biosynthetic pathway leading to Δ^9^‐tetrahydrocannabinolic acid (Δ^9^‐THCA) which subsequently undergoes non‐enzymatic (abiotic) decarboxylation. Δ^8^‐THC formed from natural Δ^9^‐THC by isomerisation yields the (−) trans Δ^8^‐THC isomer. No cis Δ^8^‐THC has been reported in natural hemp, although both the trans and cis isomers of Δ^9^‐THC have been identified in natural hemp.
Δ^8^‐THC is not detected in the majority of samples tested; however, it is detected sporadically in a few individual samples across various matrices. Possible explanations for this observation include its formation as artefact of the analytical process or during food processing, co‐elution with Δ^9^‐THC, high limit of detection (LOD) of the analytical methods used or intentional or unintentional addition of semi‐synthetic Δ^8^‐THC. Liquid chromatography‐tandem mass spectrometry (LC‐MS/MS) allows the efficient separation of both neutral and acidic cannabinoids as well as their specific and sensitive detection. Gas chromatography (GC) can also be used after careful method validation to mitigate the risks of artefacts due to co‐elution or unintended isomerisation during the analytical processes.
Regarding ADME, while a large data set is available for Δ^9^‐THC, there is scant information on Δ^8^‐THC ADME in experimental animals and the majority of the studies used non‐oral routes of administration. Upon oral exposure, Δ^8^‐THC is rapidly absorbed and distributed to a limited extent to the brain; after parenteral exposure, relatively high concentrations are detected in the bile and fat. Δ^8^‐THC and Δ^9^‐THC cross the placenta. The metabolic fate of Δ^8^‐THC is similar in most mammalian species. According to both in vitro and in vivo investigations, Δ^8^‐THC in liver undergoes a series of CYP‐mediated oxidations yielding 11‐OH‐Δ^8^‐THC, 11‐oxo‐Δ^8^‐THC and 11‐nor‐9‐carboxy‐Δ^8^‐THC. The relative potency in inducing cataleptogenic effects was in the order 11‐OH‐Δ^8^‐THC > > 11‐oxo‐Δ^8^‐THC ~ Δ^8^‐THC > 11‐nor‐9‐carboxy‐Δ^8^‐THC. Moreover, there is evidence of the in vitro/in vivo glucuronidation of Δ^8^‐THC and of its oxidised metabolites. Conjugated derivatives are excreted via the urinary and biliary routes, although no qualitative or quantitative information is available. Contrary to Δ^9^‐THC, no data on the mammary excretion of Δ^8^‐THC and its metabolites could be retrieved in experimental or food‐producing animals. No major differences in ADME in animals between Δ^8^‐THC and Δ^9^‐THC have been reported after oral exposure; the cataleptogenic potency of the Δ^9^‐THC oxidised metabolites ranks the same order of their counterparts derived from Δ^8^‐THC.
In a clinical study in humans where Δ^8^‐THC was orally administered to 19 volunteers, the Tmax ranged from 2.4 to 2.8 h, suggesting a rapid oral absorption. There are no human data regarding the distribution of Δ^8^‐THC. Δ^8^‐THC is metabolised both in the liver and the brain into 11‐OH‐Δ^8^‐THC which is subsequently metabolised to 11‐nor‐9‐carboxy‐Δ^8^‐THC. Two other metabolites (7α‐OH‐Δ^8^‐THC and 7β‐OH‐Δ^8^‐THC) have been detected, but the information on their pharmacological activity is lacking. There are no studies on the excretion of Δ^8^‐THC in humans. Taken together, after oral exposure, Δ^8^‐THC and Δ^9^‐THC are rapidly absorbed in humans with oral bioavailabilities of 9% and 6%, respectively. Similar to Δ^8^‐THC, Δ^9^‐THC is metabolised by the CYP2C9 and converted to an active metabolite, the 11‐OH‐THC metabolite. The 11‐OH‐THC is further oxidised to an intermediate aldehyde metabolite (11‐oxo‐THC), which is transformed by oxidation into 11‐nor‐9‐carboxy‐THC (inactive molecule) by an aldehyde oxidase. The carboxy group is further glucuronidated and excreted in faeces and urine. Both Δ^8^‐THC and Δ^9^‐THC are oxidised at the 11 position to form 11‐OH‐Δ^8^‐THC and 11‐OH‐Δ^9^‐THC, respectively. 11‐OH‐Δ^8^‐THC is formed less efficiently than 11‐OH‐Δ^9^‐THC by CYP2C9. Recent data suggest that Δ^8^‐THC is metabolised into 11‐OH‐Δ^8^‐THC by CYP450 to a lesser extent (1.7 times less) compared to Δ^9^‐THC.
The existing oral rodent studies on acute toxicity show that Δ^9^‐THC and Δ^8^‐THC exhibit LD50 values of the same magnitude, with females being more sensitive than males. Results obtained in Beagle dogs and Rhesus monkeys after oral administration show a tendency to a lower potency of Δ^8^‐THC compared to Δ^9^‐THC. Single oral doses of Δ^8^‐THC or Δ^9^‐THC were non‐lethal up to a dose of 3000 mg/kg bw in Beagle dogs and up to 9000 mg/kg bw in Rhesus monkeys. Single oral doses of Δ^8^‐THC induce CNS effects and behavioural changes indicative of depression in mice, rats (hypothermia, bradypnoea, rapid weight loss, inactivity, wide stance, ataxia, muscle tremors and prostration), Beagle dogs (drowsiness, ataxia, prostration, anaesthesia, tremors, mild hypothermia, salivation, emesis and anorexia) and Rhesus monkeys (initial hyperreactivity to stimuli, and in a second‐phase lethargy, drowsiness, characteristic crouched posture and abnormal eating procedures) as well as endocrine effects in one i.p. study (ovulation disruption). Similar effects have also been shown for Δ^9^‐THC. Taken together, in neurotoxicity studies, cannabimimetic effects, anxiogenic effects and psychoactivity, pain tolerance as well as behavioural and somatic signs of physical dependence were observed for Δ^8^‐THC and Δ^9^‐THC. Δ^8^‐THC produced Δ^9^‐THC‐like discriminative stimulus effect in both males and females, suggesting a qualitatively similar psychoactive outcome. However, Δ^8^‐THC demonstrated greater potency in females than in males. Existing oral acute animal studies showed that both Δ^8^‐THC and Δ^9^‐THC exhibit effects on the CNS with a tendency to a lower potency of Δ^8^‐THC compared to Δ^9^‐THC. However, the available data after oral administration do not allow a quantitative evaluation of possible differences.
From repeated dose rodent studies with oral or i.p. administration, there is evidence that Δ^8^‐THC shows Δ^9^‐THC‐like effects. A subchronic oral study in rats showed, for both Δ^8^‐THC and Δ^9^‐THC, a first short phase of CNS depression followed by a continuous phase of hyperactivity.
Adverse effects were also observed in the reproductive system in two studies with limitations including stromal degeneration of the ovaries induced by Δ^8^‐THC and interference with male pubertal growth by Δ^8^‐THC and Δ^9^‐THC in developing male rats.
Standard genotoxicity tests that would allow to assess the potential of Δ^8^‐THC for inducing gene mutations or structural or numerical chromosomal aberrations are not available. Based on read‐across from existing data on Δ9‐THC, for which the available evidence indicates that it is not genotoxic in vivo, Δ8‐THC is also not considered to be genotoxic in vivo. Quantitative structure–activity relationship (QSAR) analysis supports the read‐across hypothesis between Δ^8^‐THC and Δ^9^‐THC. The analysis only considered QSAR predictions with good reliability. These are available for bacterial mutagenicity (Ames) tests and indicate negative results.
Human pharmacological and toxicological data on Δ^8^‐THC include evidence from case reports, acute intoxications in children and clinical studies. Case reports of intoxications caused by the consumption of unregulated Δ^8^‐THC products, which include food‐like products such as gummies that resemble popular sweets, have shown serious adverse effects, especially in children. Symptoms like bradypnoea, lethargy and unresponsiveness have been observed in patients positively screened for THC in plasma or urine. Few clinical studies with both Δ^8^‐THC and Δ^9^‐THC were performed. These studies involving oral administration of Δ^8^‐THC in doses ranging from 10 to 75 mg have demonstrated psychotropic, psychomotor and cognitive effects along with physiological responses such as increased heart rate and enhanced airway conductance. No appropriate studies in the low dose range (< 10 mg/person) were available to identify a reference point for Δ^8^‐THC. However, an oral clinical study allowed a direct comparison of the potencies of Δ^8^‐THC and Δ^9^‐THC and the derivation of a relative potency factor.
As regards the mode of action, the effects of Δ^8^‐THC are likely mediated by its activity as agonist for CB1 and CB2 receptors, both at CNS level and autonomic nervous system level, similar to Δ^9^‐THC.
For Δ^8^‐THC, the cognitive and psychomotor effects observed in human clinical studies, as well as the increase of heart rate, are considered the critical effects. Given the similarity in the effects between Δ^8^‐THC and Δ^9^‐THC and the mode of action of the two substances, the Panel considers that human data can be used to inform on the relative potency of Δ^8^‐THC compared to Δ^9^‐THC. From one clinical study, the CONTAM panel compared cognitive/psychomotor (Digit Symbol Substitution Task (DSST), the Divided Attention Task (DAT), the Paced Auditory Serial Addition Task (PASAT), the DRiving Under the Influence of Drugs (DRUID)® tasks) and heart rate performances for Δ^8^‐ and Δ^9^ THC at the dose of 20 mg administrated in 19 healthy human volunteers. Based on this comparison, the CONTAM Panel considered that Δ^8^‐THC is equally or slightly less potent than Δ^9^‐THC (ratio Δ^9^‐THC/Δ^8^‐THC is 1.0–1.6). Using a conservative approach, the Panel set a relative potency factor of one for Δ^8^‐THC. This is supported by the results of limited in vivo studies in animals and clinical studies in humans in which Δ^8^‐THC appears to be less potent or at best equipotent with respect to Δ^9^‐THC.
The CONTAM Panel had previously set an acute reference dose (ARfD) of 1 μg/kg bw for Δ^9^‐THC derived from adverse effects on human CNS. Given the similarity in the effects and the mode of action between Δ^9^‐THC and Δ^8^‐THC, the Panel considered that the established ARfD can be considered as a group ARfD for the sum of Δ^9^‐ and Δ^8^ THC.
The Panel considered that uncertainties identified in the hazard characterisation of Δ^8^‐THC compared to Δ^9^‐THC were mostly of low priority. Based on quantitative analysis of data, the relative potency of Δ^9^‐THC compared to Δ^8^‐THC is very likely (certainty 90%–95%) within the range of 1–1.6.
A data set of 1671 samples/analytical results for Δ^8^‐THC obtained using different analytical methods was available. The occurrence data on Δ^8^‐THC covered 18 FoodEx2 (Level 1) food categories with the majority of samples being left censored (93%). For hemp infusion leaves, hemp seed oil and hemp seeds, 96%–99% were left censored.
For the majority of positive samples in all food categories, the content of Δ^8^‐THC was low. The highest value (P95) was reported for ‘Sugar and similar, confectionery and water‐based sweet desserts’ with 39,100 μg/kg (LB=UB), followed by ‘Products for non‐standard diets, food imitates and food supplements’ with 24,000–75,000 μg/kg (LB–UB) and by ‘Grains and grain‐based products’ with 350–1000 μg/kg (LB–UB).
To gain additional insights concerning the origin of Δ^8^‐THC, co‐occurrence data were extracted for the other cannabinoids CBD (1086 results) and Δ^9^‐THC (1145 results). These additional results pertained to the same samples analysed for Δ^8^‐THC; however, for co‐occurrence data, the Panel focused on a subset of samples that were analysed using the more reliable LC‐MS‐based methods. While Δ^9^‐THC was present in most samples, Δ^8^‐THC was detected only in few samples. In 96 of 1145 samples, both substances were detected jointly. The Δ^8^/Δ^9^ ratio was very variable and ranged from 0.009 up to 17.7, with an average of 1.37 and a standard deviation of 2.28. In literature, all samples containing Δ^8^‐THC from natural origin had a Δ^8^/Δ^9^ ratio below 1, whereas in the EFSA database, many of the samples positive for Δ^8^‐THC had a Δ^8^/Δ^9^ ratio above 1. As discussed above, this indicates either addition of semi‐synthetic Δ^8^‐THC, formation during processing or enrichment of natural Δ^8^‐THC.
The CONTAM Panel recommends the following:
- According to relevant information from a preliminary screening of the new literature on Δ^9^‐THC since 2015, data suggest that a further risk assessment of Δ^9^‐THC is needed. The Panel recommends to update the evaluation of genotoxicity and of the mechanism of action as well as of dose–effect relationships especially for the low‐dose range in human and experimental animal studies, and endpoints investigated in developmental and reproductive toxicology studies.
- Further studies on the transfer rate of Δ^8^‐THC, and its metabolites, into animal products intended for human consumption would be needed, after confirming the actual presence of Δ^8^‐THC in hemp feed materials.
- Monitoring/data evaluation of food samples should be performed using suitable and validated analytical methods for Δ^8^‐THC.
- Investigations into the formation of Δ^8^‐THC from naturally present cannabinoids during food processing and storage should be carried out to give more insights into the source of Δ^8^‐THC in food.
INTRODUCTION
1
Background and Terms of Reference as provided by the requestor
1.1
BACKGROUND
The EFSA Panel on Contaminants in the Food Chain (CONTAM Panel) adopted in 2015 a Scientific Opinion on the risks for human health related to the presence of tetrahydrocannabinol (THC) in milk and other food of animal origin. The CONTAM Panel derived an acute reference dose (ARfD) of 1 μg Δ^9^‐THC/kg bw by applying an overall uncertainty factor of 30. In the opinion the toxicity of Δ^8^‐THC was only briefly referred to.
Besides Δ^9^‐THC, also Δ^8^‐THC have been found in hemp‐derived foods, sometimes in significant amounts. It is questioned to which extent the ARfD for Δ^9^‐THC is also relevant for Δ^8^‐THC and if the ARfD of 1 μg/kg bw can be considered as a group‐ARfD for Δ^8^‐THC and Δ^9^‐THC and if a potency factor has to be applied to Δ^8^‐THC in comparison to Δ^9^‐THC or if a separate Health Based Guidance Value (HBGV) for Δ^8^‐THC needs to be derived.
It is appropriate for EFSA to address this question by conducting a hazard characterisation for Δ^8^‐THC and to provide an overview of the occurrence of Δ^8^‐THC and the co‐occurrence with Δ^9^‐THC in hemp and hemp derived products. In case a HBGV for Δ^8^‐THC is established separate from the HBGV for Δ^9^‐THC, a comprehensive risk assessment of the risks for public health related to the presence of Δ^8^‐THC in food will be necessary.
TERMS OF REFERENCE
In accordance with Art. 29 (1) (a) of Regulation (EC) No 178/20021, the Commission asks EFSA for a scientific opinion on the derivation of a health‐based guidance value (HBGV) for Δ^8^‐tetrahydrocannabinol (Δ^8^‐THC) in food with an assessment of the occurrence of Δ^8^‐THC and the co‐occurrence with Δ^9^‐THC in hemp and hemp derived products.
In case a HBGV for Δ^8^‐THC is derived separately from the HBGV for Δ^9^‐THC, the scientific opinion should comprise a comprehensive risk assessment on the risks for public health related to the presence of Δ^8^‐THC in food.
Interpretation of the Terms of Reference
1.2
The present scientific opinion will address the request of the European Commission for the derivation of a health‐based guidance value (HBGV) for Δ^8^‐tetrahydrocannabinol (Δ^8^‐THC) in food and an assessment of the occurrence of Δ^8^‐THC and the co‐occurrence with Δ^9^‐tetrahydrocannabinol (Δ^9^‐THC) in food products. In general, reference will be made to data on Δ^9^‐THC as evaluated in 2015 (EFSA CONTAM Panel, 2015) without systematically reviewing newly published data for Δ^9^‐THC since that assessment.
However, a preliminary screening of the new literature on Δ^9^‐THC, since 2015, will be conducted and if relevant information emerges, suggesting that a further risk assessment of Δ^9^‐THC is needed, this will be highlighted in the recommendations.
Additional information
1.3
Cannabinoids are substances found in the hemp plant Cannabis sativa Linn (synonym Cannabis indica Lam.), several of which exhibit biological activity. The cannabinoid composition is known to vary widely depending on the plant variety and growing conditions. Fibre and oilseed varieties of hemp are cultivated for industrial, feed and food purposes and have non‐psychoactive effects, containing very limited amounts of the active cannabinoid Δ^9^‐tetrahydrocannabinol (Δ^9^‐THC). Its structural isomer, Δ^8^‐tetrahydrocannabinol (Δ^8^‐THC), is also believed to occur naturally in hemp plants, though in much lower amounts.
Legislation
1.3.1
At the European level, the Regulation of the European Parliament and of the Council (EU) 2021/21152 on the common agricultural policy (CAP) includes varieties of hemp that are listed in the EU's ‘Common Catalogue of Varieties of Agricultural Plant Species’ and whose maximum total THC content does not exceed 0.3% w/w.
Commission Regulation (EU) 2023/9153 on maximum levels for certain contaminants in food sets limits for Δ^9^‐THC in certain food products. Specifically, the regulation sets limits for the sum of Δ^9^‐THC and Δ^9^‐tetrahydrocannabinolic acid (Δ^9^‐THCA), with Δ^9^‐THCA being converted to Δ^9^‐THC equivalents by applying a factor of 0.877. The maximum levels for hemp seeds, ground hemp seeds, partially defatted hemp seeds and other hemp seed processed products, except hemp seed oil, are 3 mg/kg. For hemp seed oil, the maximum level is 7.5 mg/kg.
In the updated Novel Food Catalogue, it is stated that ‘A history of consumption in the EU has also been demonstrated for the water infusion of hemp leaves (when not accompanied by the flowering and fruiting tops) consumed as such or as part of herbal infusions. Such use(s) is (are) therefore not novel’. Therefore, leaves from varieties listed in the Common Catalogue can be used for infusion without further restrictions if not conflicting with national drug legislation of the Member States.
Illegal use of THC isomers is controlled under 1971 UN Convention on Psychotropic substances and their status as narcotic drugs is under discussion.4 Member States may lay down their own rules for hemp use and cultivation.
Previous assessments
1.3.2
In 2011, a scientific Opinion on the safety of hemp (Cannabis genus) for use as animal feed was published by the EFSA FEEDAP Panel (2011). Δ^9^‐THC (named as THC in the opinion) and its metabolites with psychoactive properties, mainly 11‐hydroxy‐Δ^9^‐THC (11‐OH‐THC), may be distributed to the different tissues and organs of animals, fat being the target tissue. They are excreted via milk; the transfer rate of oral THC to milk from dairy cows is likely 0.15%. Studies in humans identified psychotropic effects at a lowest observed effect level (LOEL) of 0.04 mg THC/kg bw. By applying an uncertainty factor of 100, a provisional maximum tolerable daily intake (PMTDI) of 0.0004 mg/kg bw was derived. In all scenarios (varying intake of feed material derived from hemp plant and milk yields), consumer exposure to THC was considerably above the PMTDI for adults and for children; results from the same exposure scenarios applied to hemp seed‐derived feed materials were below the PMTDI. The FEEDAP Panel recommended to put the whole hemp plant‐derived feed materials in the list of materials whose placing on the market or use for animal nutritional purposes is restricted or prohibited and to introduce a maximum THC content of 10 mg/kg to hemp seed‐derived feed materials. The Opinion addressed Δ^9^‐THC and made no reference to Δ^8^‐THC.
In 2015, EFSA CONTAM Panel delivered a Scientific Opinion on the risks for human health related to the presence of tetrahydrocannabinol (THC) in milk and other food of animal origin, in particular of Δ^9^‐THC. In this Opinion, previous assessments were also summarised. From human data, the CONTAM Panel concluded that 2.5 mg Δ^9^‐THC/day, corresponding to 0.036 mg Δ^9^‐THC/kg bw per day for an adult, represents the lowest observed adverse effect level (LOAEL) based on the observed CNS effects. By applying an overall uncertainty factor of 30, an acute reference dose (ARfD) of 1 μg Δ^9^‐THC/kg bw was derived. Considering that the exposure was estimated at most 3% and 13% of the ARfD, in adults and toddlers, respectively, the CONTAM Panel concluded that the exposure to Δ^9^‐THC via consumption of milk and dairy products, resulting from the use of hemp seed‐derived feed materials at the concentrations analysed, is unlikely to pose a health concern. In that opinion, from the limited literature considered, the concentrations in which Δ^8^‐THC occurs in preparations of C. sativa were found to be usually minuscule and not contributing substantially to the activity of Δ^9^‐THC.
In a Scientific Report published in 2020, EFSA (EFSA, 2020) provided an acute human exposure assessment to Δ^9^‐THC. Previous exposure assessments were also summarised. In this report, the EFSA ARfD of 1 μg/kg bw was exceeded in the adult high consumers of most considered hemp and hemp‐containing products, under the lower bound (LB) and upper bound (UB) scenarios. The presence of Δ^8^‐THC was not discussed in this report.
FDA in a memorandum, dated 2 December 2021 (FDA, 2021a, 2021b), reviewed the available literature and was unable to conclude that the addition of Δ^8^‐THC to food meets the statutory criteria for classification as generally recognised as safe (GRAS) and that the data raise concerns for potential adverse effects of Δ^8^‐THC on the nervous, respiratory, circulatory, reproductive and endocrine systems, as well as on neurodevelopment in gestationally exposed individuals. In a more recent memorandum, FDA confirmed that new data and information identified in updated literature searches, up to 26 October 2023, did not change these conclusions (FDA, 2024).
Chemistry
1.3.3
The current Opinion addresses (−) trans Δ^8^‐tetrahydrocannabinol (Δ^8^‐THC) ((6aR,10aR)‐6,6,9‐trimethyl‐3‐pentyl‐6a,7,10,10a‐tetrahydro‐6H‐benzo[c]chromen‐1‐ol; CAS‐No 5957‐75‐5). It has a molecular formula C21H30O2 and a molecular weight of 314.46 g/mol. It has a low water solubility of 0.018 mg/L at 25°C but shows a good solubility in most organic solvents. The vapour pressure at 25°C is 4.63 × 10^−8^ mm Hg and the Henry's Law constant is 2.44 × 10^−7^ atm‐m^3^/mol at 25°C. It should be noted that, until the 1970s, a different ring numbering nomenclature was used under which Δ^8^‐THC was named Δ^6^ or Δ^1(6)^‐THC (and Δ^9^‐THC was Δ^1^‐THC) (Tagen & Klumpers, 2022) (Figure 1). Theoretically, three other stereoisomers are conceivable: (+) trans Δ^8^‐THC, (−) cis Δ^8^‐THC and (+) cis Δ^8^‐THC. Δ^8^‐THC being formed from natural Δ^9^‐THC by isomerisation yields the (−) trans Δ^8^‐THC isomer. Although, in natural hemp, the cis isomer of Δ^9^‐THC is present besides the trans isomer (Maly et al., 2024), no cis Δ^8^‐THC has been reported in natural hemp. Δ^8^‐THC obtained by chemical synthesis from natural cannabidiol (CBD) would also be present as the (−) trans Δ^8^‐THC isomer since the cyclisation does not change the stereochemistry in the respective ring system. The cis isomers of Δ^8^‐THC have been synthesised for research purposes (Gurgone et al., 2023), but are not naturally occurring (Dalzell et al., 1981).
(A) Structure and numbering of Δ9‐THC (Δ1‐THC, according to previous used nomenclature following the monoterpene numbering) (B) Structure and numbering of Δ8‐THC (Δ6‐THC, according to previous used nomenclature following the monoterpene numbering).
Δ^9^‐THC is formed in the hemp plant by a biosynthetic pathway leading to Δ^9^‐tetrahydrocannabinolic acid (Δ^9^‐THCA) and its subsequent (abiotic) decarboxylation. Δ^8^‐THC is then formed by isomerisation from the thermodynamically less stable Δ^9^‐THC (Figure 2) (Geci et al., 2023). It is assumed that certain conditions favour the isomerisation, e.g. acidic and oxidative conditions (Hanuš et al., 2016; Mechoulam, 1970). Dalzell et al. (1981) showed that treatment of pure Δ^9^‐THC with acid resulted in a mixture that contained only 3% Δ^9^‐THC but 97% Δ8‐THC. Taylor et al. (1966) report facile heat isomerisation while Gaoni and Mechoulam (1966) have not observed an isomerisation up to 300°C.
Formation of Δ8‐THC (CBD, Cannabidiol; CBDA, Cannabidiolic acid; CBGA, Cannabigerolic acid; THCA, Tetrahydrocannabinolic acid).
Many authors state that Δ^8^‐THC is naturally present in hemp in minor amounts, primarily based on the findings of Hively's 1966 scientific report on the isolation and identification of Δ^8^‐THC in natural hemp (Hively et al., 1966). In this publication, the presence of this substance and its isolation from marijuana is described and their concentration ratio determined as 9:1 (Δ^9^‐THC:Δ^8^‐THC) by thin layer chromatography. Lerner and Zeffert (1968) investigated marijuana and hashish samples by GC‐FID. They report the Δ^8^‐THC content as percentage of the ‘total THC’ and found values of 0.1%–1.2% for fresh marijuana and substantially higher values for aged hashish and hashish oil (up to 60%). It is not specified if total THC includes THCA (being converted to THC in the injector of the GC). Furthermore, the used detector is unspecific so that it cannot be excluded that other cannabinoids unknown at that time coeluted. New cannabinoids continue to be discovered (Ferrer & Thurman, 2024).
Recent scientific data on the natural occurrence of Δ^8^‐THC in hemp are contradictory. In most studies in which hemp plant material or hemp‐based products were analysed for both Δ^9^‐THC and Δ^8^‐THC, no Δ^8^‐THC was found. This holds both for industrial hemp varieties with low THC content as well as for THC‐rich material from medicinal/drug hemp. Berthold et al. (2020) measured 56 industrial hemp plant samples. They detected Δ^9^‐THC (besides the other main cannabinoids) in all of them, but no Δ^8^‐THC. It has to be stated though that the quantification limit (≤ 0.05% w/w) was rather high as the study was focussed on the regulatory level for the distinction between industrial and drug hemp (0.3% total THC). Even if Δ^8^‐THC had been present at a level of 10% of Δ^9^‐THC, it would have gone unnoticed. On the other hand, Büttenbender et al. (2022) detected Δ^8^‐THC in 1 of 82 and Wang et al. (2018) in 1 of 32 seized cannabis samples. Coogan (2019) evaluated 245 test reports of medical marijuana and stated that Δ^8^‐THC is not detected in all but a few reports. Specifically for food including hemp flour and bakery products, mix for infusions and coffees, honey and some alcoholic beverages, there were only few studies with positive findings for ∆^8^‐THC (e.g. Pisciottano et al., 2021). The literature data for food are described in more detail in Section 3.2.2.
The situation in the occurrence of ∆^8^‐THC is complex, particularly understanding why it is present in individual samples of a given matrix type, but not present in the vast majority of samples. In a recent comprehensive review, Abdel‐Kader et al. (2024) conclude that, based on the published results, further research is needed to answer the question, if ∆^8^‐THC is a natural cannabinoid or an artefact. There are several conceivable explanations for the contradictory occurrence data:
- Δ^8^‐THC is formed as an artefact in the analytical process from Δ^9^‐THC by acid or oxidatively promoted shift of the endocyclic double bond, or from CBD by electrophilic cyclisation (Hanuš et al., 2016);
- Due to partial co‐elution with Δ^9^‐THC, Δ^8^‐THC is not properly quantified;
- The materials in which Δ^8^‐THC was detected have undergone conditions that favour the formation of Δ^8^‐THC from Δ^9^‐THC by isomerisation;
- Δ^8^‐THC was not detected in the samples because its levels were below the LOD of the analytical method;
- Semi‐synthetic Δ^8^‐THC was intentionally added to the material (or is present as a contamination).
Besides natural formation from ∆^9^‐THC, Δ^8^‐THC can be chemically synthesised from other cannabinoids, in particular CBD. In the USA, Δ^8^‐THC products such as gummies, edibles, oils and vapes have been widely available ‘over the counter’, e.g. at gas stations and online due to an unclear legal status (Babalonis et al., 2021). In addition to this commercial synthesis, there are instructions circulating on internet on how to prepare Δ^8^‐THC from CBD at home using household chemicals (Huang et al., 2024).
Analytical methods
1.3.3.1
Many analytical methods for cannabinoids in a pharmacological or forensic context have been available for decades for various matrices, including marihuana, hashish, plant material, as well as urine and serum. Widely used techniques include gas chromatography (GC) coupled with different detectors, e.g. flame ionisation detectors (FID) or mass spectrometry (MS), as well as high‐performance liquid chromatography (HPLC) coupled with UV or fluorescence detectors. Thin layer chromatography (TLC) was a popular technique until the 1980s, but was increasingly replaced by the more sensitive and selective GC and HPLC techniques.
The Union method for THC as laid down in Annex 1 of the Commission Delegated Regulation (EU) 2022/1265 was designed to verify the 0.3% criterion for the eligibility of hemp varieties for agricultural subsidies and is based on GC‐FID. This method determines THC as the sum of Δ^9^‐THC and the respective acids (THCA) as well as Δ^8^‐THC when it co‐elutes. It is usually not suited to detect Δ^8^‐THC individually and to quantify it at relevant levels.
Methods for the quantification of cannabinoids in food were not widely available. In 2016, the European Commission issued a monitoring recommendation for Δ^9^‐THC in hemp‐derived foods and foods containing hemp or hemp‐derived ingredients.6 It asked to also analyse the non‐psychoactive precursors Δ^9^‐tetrahydrocannabinolic acids (2‐COOH‐Δ^9^‐THC termed Δ^9^‐THCA‐A and 4‐COOH‐Δ^9^‐THC termed Δ^9^‐THCA‐B) and other cannabinoids (such as Δ^8^‐tetrahydrocannabinol (Δ^8^‐THC), cannabinol (CBN), cannabidiol (CBD) and Δ^9^‐tetrahydrocannabivarin (Δ^9^‐THCV)). In 2022, regulatory maximum levels for Δ^9^‐THC equivalents (sum of Δ^9^‐THC + 0.877 × Δ^9^‐THCA) in hemp seeds and hemp seed oil were set in Commission Regulation (EU) 2022/1393.7 As a consequence, the number of available methods for cannabinoids in food increased (Nahar et al., 2020; Yang & Sun, 2024). The majority of laboratories currently uses liquid chromatography coupled to mass spectrometry (LC‐MS). In most cases, quadrupole mass spectrometers operating in tandem mode (LC‐MS/MS) are used, although high‐resolution mass spectrometers (LC‐HRMS) are also used in some cases. LC‐MS allows the efficient separation of both neutral and acidic cannabinoids as well as their specific and sensitive detection. Methods intended for food often include Δ^9^‐THC, CBD, CBN and their corresponding acids (THCA, CBDA, CBNA) but differ in the degree to which they include further cannabinoids such as Δ^8^‐THC. The method of the European Reference Laboratory (EURL) for mycotoxins and plant toxins uses LC‐MS/MS and includes CBD, CBDA, CBG, CBGA, CBN, Δ^9^‐THC and Δ^9^‐THCA in its scope (EURL MP, 2024). However, an increasing number of methods has been published that do include also Δ^8^‐THC (e.g. Di Marco Pisciottano et al., 2018, Lindekamp et al., 2024). While LC‐MS methods in general are very specific, care has to be taken that Δ^8^‐THC is chromatographically separated from Δ^9^‐THC because both isomers have the same mass. In case of (partial) co‐elution, the correct quantification would be hampered. The presence of Δ^8^‐THC (when present in minor amounts compared to Δ^9^‐THC) could be overlooked or Δ^8^‐THC could be taken for Δ^9^‐THC and vice versa.
In gas chromatography, the acidic cannabinoids are thermally decarboxylated in the injector. As a result, reported values for the neutral cannabinoids are the sum of the neutral and the acidic cannabinoid (minus the mass of CO_2_). For forensic applications, this was often not a hindrance since it was assumed that cannabis is smoked so that THCA is decarboxylated to THC anyway. Other processes that could happen in the heated injector as well as on the column are not well investigated. This includes i.a. the cyclisation of CBD to THC (both isomers) and the isomerisation of Δ^9^‐THC to Δ^8^‐THC.
The decarboxylation in the injector can be circumvented by derivatisation of the sample extract prior to injection. In this way, also the acidic cannabinoids become amenable to GC analysis. Cyclisation and isomerisation remain a possible issue, it has also been reported that certain derivatisation conditions may lead to the formation of Δ^8^‐THC. For example, Holler et al. (2008) demonstrated that Δ^9^‐THC is isomerised to Δ^8^‐THC upon derivatisation with perfluoroacid anhydrides in combination with perfluoroalcohols. These effects would have to be addressed carefully in the method validation to avoid artefacts.
DATA AND METHODOLOGIES
2
The current EFSA assessment on Δ^8^‐THC was developed applying a structured methodological approach, which implied developing a priori the protocol or strategy of the full assessment and performing each step in line with the strategy and documenting the process. The protocol in Annex A of this Opinion contains the method that was proposed for all the steps of the assessment process, including any subsequent refinements/changes made.
The CONTAM Panel considered its previous assessment on the risks for human health related to the presence of tetrahydrocannabinol (THC) in milk and other food of animal origin (EFSA CONTAM Panel, 2015) as a starting point for drafting the current Opinion.
The draft scientific Opinion underwent a public consultation from 31 July 2025 to 15 September 2025. The comments received were taken into account when finalising the scientific Opinion and are presented and addressed in Annex E.
Supporting information for the assessment
2.1
Literature searches were conducted to identify information in reviews and other peer‐reviewed publications. Details about the literature searches are given in Annex B. During the development of the opinion, additional publications were collected by applying a ‘snowballing approach’.
The information was summarised in a narrative way based on expert knowledge and judgement.
In this opinion, the adverse effects of Δ^8^‐THC will be compared with the effects previously reported on Δ^9^‐THC (EFSA CONTAM Panel, 2015). Since this last evaluation, a significant amount of new information has become available. An extensive literature screening for Δ^9^‐THC since 2014 was conducted to collect relevant articles. The methodology and the results of this screening are published in Annex C.
Hazard identification and characterisation
2.2
The selection of the scientific papers for inclusion or exclusion was based on consideration of the extent to which the study was relevant to the assessment or on general study quality considerations (e.g. sufficient details on the methodology, performance and outcome of the study, on dosing, substance studied and route of administration and on statistical description of the results), irrespective of the results (Annex A). Limitations in the information used are documented in this Scientific Opinion.
In addition, for this opinion, summaries of new relevant data on adverse effects of Δ^9^‐THC in humans and animals, collected via the additional literature screening on Δ^9^‐THC (Annex C), will be considered and if they indicate a need for an update of the risk assessment of Δ^9^‐THC and hence of its comparison with Δ^8^‐THC, this necessity will be emphasised in the recommendations.
Occurrence data
2.3
Data collection and validation
2.3.1
Within the annual call for data issued by EFSA for chemical contaminants occurrence data in food and feed, also including data on Δ^8^‐THC8 were collected. European national authorities and similar bodies, research institutions, academia, food business operators and other stakeholders were invited to submit analytical data on Δ^8^‐THC in food. The Commission Recommendation (EU) 2016/21159 on the monitoring of the presence of Δ^9^‐tetrahydrocannabinol, its precursors and other cannabinoids in food mentioned above contributed to the increase of the data collected on Δ^8^‐THC.
All analytical results on Δ^8^‐THC reported to EFSA were considered. Additionally, for samples for which data on Δ^8^‐THC were reported, co‐occurrence data of Δ^9^‐THC and CBD were also extracted from the same samples. This selection of results was used for two purposes: (i) to investigate co‐occurrence of Δ^8^‐THC and Δ^9^‐THC (as requested by the mandate) and (ii) to get an indication from the ratio of CBD to Δ^9^‐THC on the origin of the cannabinoids contained in the same sample (fibre hemp, drug hemp, hemp extracts/CBD oils).
The data submission to EFSA followed the requirements of the EFSA Guidance on Standard Sample Description (SSD) for Food and Feed (EFSA, 2010a) and the EFSA Guidance on Standard Sample Description ver.2.0 (EFSA, 2013). Occurrence data were managed following the EFSA standard operational procedures (SOPs) on ‘Data collection and validation’ and ‘Analysis of data from the EFSA Scientific Data Warehouse for the assessment of dietary exposure’.
Data were extracted from the EFSA database on 24 September 2024. Data received after that date were not included for further evaluation within this Opinion.
Data analysis
2.3.2
Following the EFSA's Technical report on handling of occurrence data for dietary exposure assessment (EFSA, 2021) to guarantee an appropriate quality of the data used in the exposure assessment, the initial data set was evaluated by applying several data cleaning and validation steps. Special attention was paid to the identification of duplicates and to the accuracy of different parameters, such as ‘Analytical methods’, ‘Sampling year’, ‘Sampling country’, ‘Result express’ (expression of results, e.g. 88% dry weight), ‘Reporting unit’, ‘Limit of detection/quantification’, ‘Sampling strategy’ and the codification of analytical results under FoodEx classification (EFSA, 2011a, 2011b; EFSA, 2015). Special attention was also given to the verification of sample classification and analytical method, in order to confirm the accuracy and specificity of results with high content for Δ^8^‐THC reported. The outcome of the data analysis is presented in Section 3.2.1 and Annex D.
The left‐censored data (results below LOD or LOQ) were treated by the substitution method as recommended in the ‘Principles and Methods for the Risk Assessment of Chemicals in Food’ (JECFA, 2009). The same method is indicated in the EFSA scientific report ‘Management of left‐censored data in dietary exposure assessment of chemical substances’ (EFSA, 2010b) as an option in the treatment of left‐censored data. The guidance suggests that the lower bound (LB) and upper bound (UB) approach should be used for chemicals likely to be present in the food (e.g. naturally occurring contaminants, nutrients and mycotoxins). The LB is obtained by assigning a value of zero (minimum possible value) to all samples reported as lower than the LOD (< LOD) or the LOQ (< LOQ). The UB is obtained by assigning the numerical value of the LOD to values reported as < LOD, and the LOQ to values reported as < LOQ (maximum possible value), depending on whether LOD or LOQ is reported by the laboratory.
The variability of concentrations observed within the occurrence data set is shown by reporting, at each level of the FoodEx2 classification, the percentiles for LB and UB occurrence values that can be reliably estimated when applying the following minimum sample size for each percentile: 5 samples for the P50, 11 samples for the P75, 29 samples for the P90, 59 samples for the P95 and 119 samples for the P97.5 (EFSA, 2011c; Meeker et al., 2017).
Occurrence data from the literature
2.3.3
An extensive literature search was carried out to collect data on the occurrence of Δ^8^‐THC in food and feed including articles on co‐occurrence with Δ^9^‐THC. Bibliographic searches were conducted in bibliographic databases or scientific citation search platforms via an extensive literature review as described in Annex B. During the development of the opinion, additional publications were collected by applying a ‘snowballing approach’.
Food classification
2.3.4
Occurrence data were codified according to the FoodEx2 classification system (EFSA, 2011a, 2011b). Since 2018, all consumption records in the Comprehensive Database as well as all occurrence data submitted to EFSA have been codified according to the FoodEx2 classification system (EFSA, 2015). The FoodEx2 classification system consists of a large number of standardised basic food items aggregated into broader food categories in a hierarchical parent–child relationship. Additional descriptors, called facets, are used to provide additional information about the codified foods (e.g. information on food processing as milling).
ASSESSMENT
3
Hazard identification and characterisation
3.1
Toxicokinetics
3.1.1
In experimental animals
Summary of toxicokinetics data on Δ9
‐THC as previously evaluated (EFSA CONTAM Panel, 2015)
3.1.1.1
In apparent contrast with its lipophilicity, Δ^9^‐THC undergoes a slow and limited absorption upon oral administration. This results in a bioavailability of about 26% in monkeys, also due to an extensive pre‐systemic metabolism (see below). The role of drug transporters (P‐gp) in limiting enteric absorption has been demonstrated in mice. Blood peaks in animals are detected 1–4 h after oral exposure.
Studies concerning the distribution of Δ^9^‐THC in animals are consistent with a high degree of plasma protein binding of the parent molecule and of some of its metabolites (see below) which are extensively distributed to body fat, lungs, kidney, liver, heart, spleen and brain. Brain levels of the active metabolite 11‐OH‐Δ^9^‐THC were found to be higher (up to about 10‐fold) in female rats than in male rats.10 The volume of distribution is large; in addition, a remarkable re‐distribution phase has been reported allowing the detection of measurable concentrations of Δ^9^‐THC and some of its metabolites for several days. In line with the kinetic data mentioned above, long terminal half‐lives (2–8 days) have been measured in rabbits and dogs (i.v. dosing) and rats (i.p. administration). In dogs, rats and monkeys, Δ^9^‐THC crosses the placental barrier and distributes to fetal tissues including brain.
In all tested species, the Δ^9^‐THC metabolism consists in sequential oxidative pathways (mainly mediated by CYP2C and to a lesser extent by CYP3A) yielding first an active hydroxylated metabolite, 11‐OH‐Δ^9^‐THC; sex‐related differences are reported in rats, females producing 11‐OH‐Δ^9^‐THC derivative to a greater extent compared to males. This metabolite in turn is further oxidised to the inactive carboxylic derivative 11‐nor‐9‐carboxy‐Δ^9^‐THC. Both are partly conjugated mainly by uridin‐diphospho‐glucuronyltransferase (UGT) 1A to form glucuronides which are then mostly excreted via the biliary route and undergo entero‐hepatic circulation. The mentioned metabolic reactions mainly occur in the liver, although the involvement of extrahepatic tissues (intestine, brain) has been demonstrated in in vitro studies. In the brain, pharmacologically active metabolites hydroxylated at the pentyl side (mostly 4’‐OH derivatives) chain are formed. The excretion of Δ^9^‐THC and its metabolites in animals is slow because of tissue re‐distribution, entero‐hepatic cycling and renal tubular reabsorption. The parent compound and its metabolites (mainly glucuronides) are both excreted in faeces (via the bile) and in urine, approximately in the proportion of 2/3 and 1/3, respectively. Finally, the mammary excretion of Δ^9^‐THC and, to a lesser extent, 11‐OH‐Δ^9^‐THC and 11‐nor‐9‐carboxy‐Δ^9^‐THC has been demonstrated in experimental animals and food‐producing animals as well. Based on a limited database, a transfer rate of Δ^9^‐THC in milk in the range 0.10%–0.15% has been estimated in dairy cows.
Toxicokinetics of Δ8
‐THC
3.1.1.2
Absorption
Male and female Sprague–Dawley rats (age range 7–13 weeks, N = 6 per dose group) received a single oral dose of Δ^8^‐THC via gavage at 0.32, 1, 3.2 or 10 mg/kg bw for either 1 day (single‐dose trial) or daily for 14 consecutive days (repeated‐dose trial) (Moore et al., 2023). Blood was collected at 0.45, 1.5, 3 and 24 h after the last dosing in both trials. Irrespective of the dose and the duration of the exposure, measurable Δ^8^‐THC blood levels (> LOQ, 1 ng/mL) were detected as early as 0.45 min after treatment. As regards the single‐dose trial, after 24 h, median Tmax was in the range 1.5–3 h for all groups, while both Cmax and AUC (area under the curve) values (mean ± SD) were increasing according to the administered dose being 2.0 ± 0.7 up to 149 ± 52 ng/mL (Cmax) and 3.7 ± 1.2 up to 1025 ± 279 ng/mL/h (AUC). T_1/2_ values were not reported. No consistent sex‐related differences were noticed. After 14 days, blood concentrations in two of four groups tended to increase by a factor of 2–3 (C max), and a similar increase (two‐ to fourfold) was observed in 0.32, 1 and 3.2 mg Δ^8^‐THC/kg bw‐dosed animals (AUC) indicating Δ^8^‐THC blood accumulation after the 14 days of repeated exposure.
Distribution
No data could be retrieved on the extent of protein binding of Δ^8^‐THC in experimental animals.
Tritiated Δ^8^‐THC was i.p. administered to mice, guinea pigs and rabbits at doses of 240, 204 and 42 mg/kg bw, respectively; after 2 h, animals were killed and organs and bile were pooled and homogenised (Agurell et al., 1979). In all tested species, total radioactivity (sum of the parent compound and metabolites) was relatively low in brain compared to liver, kidney, bile and spleen in the different species.
In the Moore et al. (2023) study mentioned above, Δ^8^‐THC concentrations were also measured in brains from rats sacrificed 24 h after the single and 14‐day repeated oral dosing, respectively. Values < LOQ (1 ng/mL) were detected in 0.32, 1 and 3.2 mg Δ^8^‐THC/kg bw‐dosed animals; measurable low concentrations (around 5 ng/g) were only found in samples from animals exposed to the highest dosage (10 mg/kg bw), with no significant differences according to treatment duration.
The plasma content and tissue distribution of ^14^C Δ^8^‐THC (30 μg) were investigated in rats after single (i.m.) and repeated (i.p.) exposure (Bronson et al., 1984). Animals receiving a single dose were sacrificed at 1, 2, 3, 4, 6 and 24 h after treatment; animals from the repeated dose group received the same amount of drug every 2 days up to 34 days and were sacrificed every 6 days. Sampling included peripheral blood (plasma), brain, lung, liver, spleen, testis and epididymal fat, which were subjected to total radioactivity measurement and referred to as ng Δ^8^‐THC/g tissue. In the single dose experiment, plasma concentrations peaked 2 hr after treatment (4.8 ± 2.0 ng/g), then declined to 2.8 ± 2.0 ng/g at 4 h and rose again to 4.0 ± 1.0 ng/g at 24 h. In liver, lung, heart and spleen, total radioactivity was higher (average range 7.4–16.8 ng/g) during the first 2–4 h reaching an approximate equilibrium with plasma at 24 h. A similar trend was observed in brain, with levels of 9.2 ± 1.4 ng/g at 4 h and not significantly different from plasma concentrations at 24 h. In testis, total radioactivity was similar to plasma during the first 4 h and then declined at 24 h to levels below those found in plasma (1.0 ± 0.4 ng/g). A completely different behaviour was recorded in fat where a plateau was reached after 6 h (average 34–36 ng/g) and was maintained at 24 h. Upon repeated administration, there was an increase in total radioactivity in plasma and all the collected tissues. Compared to the values measured at day 2, at day 34, an almost 12‐fold increase was recorded in fat (432 ± 112 ng/g), followed by plasma (~ 6‐fold, 7.0 ± 1.2 ng/g) and liver (~ 4‐fold, 5.8 ± 0.6 ng/g); the concentration in brain (5.2 ± 0.6 ng/g) and in testis (1.7 ± 0.4 ng/g) rose only by a factor of 2.
The distribution of ^3^H‐Δ^8^‐THC and of its active metabolite ^3^H‐11‐OH‐Δ^8^‐THC (see below) in brain has been studied in rats treated i.v. with either compound and sacrificed at 15, 30 and 60 min after dosing (Ho et al., 1973). Both substances entered the brain in amounts that were not statistically significant different at any tested time point (e.g. 10.6 ± 0.02 vs. 10.8 ± 0.06 nmoles/g tissue at 15 min); in ^3^H‐11‐OH‐Δ^8^‐THC‐injected rats, the measured radioactivity was almost entirely due to the unchanged compound, suggesting that this active metabolite does not undergo further substantial biotransformation in cerebral tissue.
The disposition of Δ^8^‐THC and of its active metabolites 11‐OH‐Δ^8^‐THC and 11‐oxo‐Δ^8^‐THC (see below) in blood, liver and brain has been studied in mice treated i.v. with 10 mg/kg bw of each compound, respectively (Watanabe et al., 1981). Mice were sacrificed 0.5, 1, 5, 15, 30 and 60 min after dosing and blood, liver and brain were sampled at each time point. All the tested compounds exhibited a biphasic decline in blood concentration, the half‐lives (β phase) being 32, 12 and 6 min for Δ^8^‐THC, 11‐OH‐Δ^8^‐THC and 11‐oxo‐Δ^8^ THC, respectively. Brain peak concentrations of both metabolites were reached at 0.5 min; in contrast to what observed in rats (Ho et al., 1973), they were higher than those of the parent compound, particularly for 11‐OH‐Δ^8^‐THC (about 3‐fold). Similar results were obtained by Ohlsson et al. (1980) in mice i.v. treated with comparable amounts of Δ^8^‐THC and 11‐OH‐Δ^8^‐THC. This indicates a greater ability of the active hydroxylated metabolites to cross the blood–brain barrier as compared to Δ^8^‐THC. Side‐chain hydroxylated metabolites at 1′, 2′, 3′, 4′ and 5′ positions are also generated (see Metabolism) all being able to cross the blood–brain barrier.
The i.v. administration of ^3^H‐Δ^8^‐THC in pregnant mice (GD 17) resulted in amounts of radioactivity estimated as ‘moderate’ by the authors in the placenta and as ‘low’ in fetuses, never exceeding those found in the maternal blood (Ryrfeldt et al., 1973).
Metabolism
The metabolic fate of Δ^8^‐THC has been characterised in a number of in vitro investigations. Most of the available information is concerned with phase I biotransformations. The studies by Foltz et al. (1970) identified 11‐OH‐Δ^8^‐THC as the major Δ^8^‐THC metabolite in rat liver microsomes. The comparative oxidative metabolism of Δ^8^‐THC was investigated in liver microsomes from mouse, rat, guinea pig, rabbit and hamster. In mice, rat and rabbit microsomes, the generation of 11‐OH metabolites was prevalent (65%–85% of all the hydroxylated metabolites), while in guinea pig preparations, significant amounts of 4’‐OH‐ and 5’‐OH‐Δ^8^‐THC were detected. A completely different pattern was observed in hamster microsomes, the 7 beta‐OH derivative being the most abundant metabolite (82%). Minor amounts of 1’‐OH and 3’‐OH‐Δ^8^‐THC were found in microsomal fractions from the mentioned species (Harvey & Brown, 1991).
Since the studies of Watanabe et al. (1980) with rabbit liver microsomes, it is generally accepted that, in mammalian species, 11‐OH‐Δ^8^‐THC is further oxidised to an oxo‐ (aldehyde) derivative by different CYP‐dependent monooxygenases (Watanabe et al., 1980). Such enzymes mediate the subsequent oxidation of 11‐oxo‐Δ^8^‐THC to yield the carboxylic acid derivative 11‐nor‐9‐carboxy‐Δ^8^‐THC (Figure 3) in mouse (Watanabe, Hirahashi, et al., 1991) and rat (Watanabe, Matsunaga, et al., 1991) preparations.
The above‐described biotransformation pathways have also been confirmed by various in vivo investigations. In the Agurell et al. (1979) study detailed above, Δ^8^‐THC metabolites in liver and kidney were identified by TLC followed by GC‐MS. The presence (sum of liver and kidney content) of both mono‐hydroxylated metabolites and mono‐carboxylic acid derivatives predominates in mice, followed by guinea pigs and rabbits. The metabolic fate of i.v. injected 11‐OH‐Δ^8^‐THC was investigated in rats. Animals were euthanised, and livers were removed, homogenised and analysed with GC‐MS for the presence of carboxylic acid derivatives. Results confirmed that 11‐nor‐9‐carboxy‐Δ^8^‐THC was the main carboxylic acid derivative of 11‐OH‐Δ^8^‐THC (15 ± 0.9 nmol/g liver); besides, a considerable amount (8 ± 0.2 nmol/g liver) of another metabolite (11‐COOH‐7‐OH‐Δ^8^‐THC) was detected. The time course of the liver formation of both 11‐nor‐9‐carboxy‐Δ^8^‐THC and 11‐COOH‐7‐OH‐Δ^8^‐THC was investigated in rats administered i.v. with 11‐OH‐Δ^8^‐THC; the respective increase/decrease in metabolite formation in animals treated with inducers or inhibitors of CYPs, respectively, supported the conclusion that both metabolites are generated via CYP‐dependent monooxygenases (Watanabe et al., 1980).
Investigations performed in mice confirmed the oxidative biotransformation pathways outlined above. In the study by Watanabe et al. (1981), extensive formation of 11‐OH‐Δ8‐THC and 11‐nor‐9‐carboxy‐Δ8‐THC (3.6 and 3.8 μg/kg, respectively) was observed in the livers of male mice administered Δ8‐THC intravenously at a dose of 10 mg/kg body weight, along with minor amounts of 11‐oxo‐Δ8‐THC. The pretreatment of animals with SKF 525A, a known non‐selective inhibitor of CYP‐dependent monooxygenases, leads to a significant reduction of the rate of the metabolic oxidative breakdown of Δ^8^‐THC up to the inactive metabolite 11‐nor‐9‐carboxy‐Δ^8^‐THC.
Plasma samples of guinea pigs were found to contain 11‐nor‐9‐carboxy‐Δ^8^‐THC after the topical application of Δ^8^‐THC (Valiveti et al., 2005).
It is worth noting that the affinity towards brain cannabinoid receptors ‐and hence the pharmacological potency‐ is reported to differ considerably between the parent compound and its metabolites. Bovine cerebral cortex preparations were used in a receptor assay with Δ^8^‐THC and its metabolites oxidised at the 11 position; the binding affinities to the synaptic membranes were expressed as the potency ratio in competing with the specific binding of CP55‐940^,^ (Yamamoto et al., 2003). The relative pharmacological potency compared to Δ^8^‐THC (conventionally assumed to be 100) was 500 for 11‐OH‐Δ^8^‐THC, 147 for 11‐oxo‐Δ^8^‐THC and < 2 for 11‐nor‐9‐carboxy‐Δ^8^‐THC. Differences of the same order of magnitude in inducing cataleptogenic effects were reported in mice i.v. injected with the parent compound or each of the above metabolites (Watanabe et al., 1980).
Extrahepatic metabolism of cannabinoids is reported to occur. Brain microsomal metabolism of Δ^8^‐THC was investigated in rats, mice, guinea pigs and rabbits and found to differ from that occurring in liver, in that oxidation occurred at the pentyl side chain to yield mostly 4’‐OH derivatives (Watanabe et al., 1988). More recent studies with brain murine microsomes point to the involvement of CYP3A in the generation of the mentioned side chain hydroxylated metabolites (Watanabe et al., 2011). The cataleptic effects of some side‐chain hydroxylated metabolites were compared in i.v. dosed mice with those of the parent compound Δ^8^‐THC and its main active metabolite 11‐OH‐Δ^8^‐THC; when normalised to brain concentrations of each tested compound, their potency was found in the following order: Δ^8^‐THC > 11‐OH‐Δ^8^‐THC > 3’‐OH‐Δ^8^‐THC > 4’‐OH derivatives (Ohlsson et al., 1980).
Relatively little is known on phase II metabolism. Although glucuronidation and, to a minor extent, sulfation are regarded as general metabolic pathways of cannabinoids (for a review, see Bardhi et al., 2022), scant information is available for Δ^8^‐THC. The formation of Δ^8^‐THC O‐glucuronides was demonstrated in vitro after the incubation with partially purified UDP‐glucuronosyltransferase but also in livers from Δ^8^‐THC i.p. administered mice (Harvey et al., 1977); Δ^8^‐THC C‐glucuronides were also detected in livers from mice treated with the cannabinoid in the same way (Levy & Heppner, 1978).
Excretion
Little is known about the excretion of Δ^8^‐THC and its metabolites. The i.v. or s.c. dosing of rabbits with 11‐OH‐Δ^8^‐THC resulted in the urinary excretion of a small amount of the unchanged compound, which was also excreted as glucuronide and sulfate derivatives (no quantitative data) (Agurell et al., 1971). Another study was concerned with the disposition of the chemically synthetised less active metabolites Δ^8^‐THC O‐glucuronide (5 mg/kg bw) and Δ^8^‐THC O‐sulfate (3 mg/kg bw). Both were administered i.v. to intact or bile duct cannulated rats; bile and urine were collected over 24 h after dosing. Biliary excretion of the unchanged Δ^8^‐THC O‐glucuronide and Δ^8^‐THC O‐sulfate was estimated to be around 43% and 10% of the injected dose, respectively. By contrast, the urinary excretion of either compound was found to be negligible (Watanabe et al., 1979).
No data on the mammary excretion of Δ^8^‐THC and/or its metabolites in experimental animals were made available. Measurable levels of Δ^8^‐THC were not detected in dairy milk from cows fed hemp silage (1.68 kg DM hemp silage per day) for 7 days (Wagner et al., 2022). The concentration of Δ^8^‐THC in the feed was below the limit of detection (0.2–2 ng/g DM).
Summary
Little information is available on Δ^8^‐THC ADME in experimental animals and the large majority of the studies were performed with administration routes different than the oral one.
Absorption of Δ^8^‐THC upon the single oral administration of increasing dosages is rapid; median Tmax was 1–3 h and a dose‐related increase in both AUC and Cmax was noticed. The repeated exposure to the same doses resulted in an increase in Δ^8^‐THC blood concentrations.
A rapid tissue distribution (total radioactivity) was observed after the single i.p. or i.m. administration of labelled Δ^8^‐THC, with relatively high values in the bile and fat. The single oral exposure of Δ^8^‐THC resulted in a limited distribution to brain and no increase in brain concentration occurred upon the repeated exposure via the same route. Species variations in the brain distribution of Δ^8^‐THC and its active metabolite 11‐OH‐Δ^8^‐THC (single i.v. exposure) were reported; while in rats, no apparent differences between the two substances were detected; in mice, the extent of 11‐OH‐Δ^8^‐THC brain transfer was greater than that of the parent compound.
The metabolic fate of Δ^8^‐THC is similar in most mammalian species. According to both in vitro and in vivo investigations, biotransformation in liver consists of a series of CYP‐mediated oxidations with the formation of 11‐OH‐Δ^8^‐THC, 11‐oxo‐Δ^8^‐THC and 11‐nor‐9‐carboxy‐Δ^8^‐THC. Based on a limited data set of studies, the relative potency in inducing cataleptogenic effects was in the order 11‐OH‐Δ^8^‐THC > > 11‐oxo‐Δ^8^‐THC ~ Δ^8^‐THC > 11‐nor‐9‐carboxy‐Δ^8^‐THC. Extrahepatic (brain) metabolism results in the generation of side‐chain oxidised metabolites retaining the pharmacological activity. There is evidence of the in vitro/in vivo glucuronidation of Δ^8^‐THC and of its oxidised metabolites.
In i.v. studies performed in rats with synthetic Δ^8^‐THC‐glucuronides and sulfates, it was found that biliary excretion of Δ^8^‐THC‐glucuronides largely prevails over that of sulfates; the urinary excretion of both conjugated metabolites seems to be negligible.
No data on mammary excretion Δ^8^‐THC and its metabolites were retrieved either in experimental or food‐producing animals.
Comparison between Δ8
‐THC and Δ9 ‐THC
3.1.1.3
While ADME of Δ^9^‐THC has been extensively investigated under different exposure routes and conditions, much less information is available for Δ^8^‐THC. In addition, very few experimental comparative studies have been performed (see Tagen & Klumpers, 2022 for a review).
No major differences between Δ^8^‐THC and Δ^9^‐THC have been reported in the oral absorption, which is relatively rapid, with Tmax values of the same order of magnitude (0.5–4 h). No data on Δ^8^‐THC bioavailability could be retrieved while in Δ^9^‐THC orally exposed animals, bioavailability was low (20%–25%) mostly due to a remarkable first‐pass effect mainly in the liver.
Once reached the systemic circulation, Δ^9^‐THC is highly bound to plasma proteins (no information on Δ^8^‐THC). The autoradiographic distribution of labelled Δ^8^‐THC and Δ^9^‐THC, injected via i.v., was studied in the monkey Callithrix jaccus; an identical distribution was found in the main tissues (fat and brain not examined). In a review comparing the distribution of the two labelled isomers after single and multiple i.m. dosing in rats, Nahas et al. (2002) found a very similar distribution pattern to all tissues, with significant accumulation in fat and low levels of either cannabinoid in the brain. Finally, no significant differences in the brain accumulation of tritiated Δ^8^‐THC, Δ^9^‐THC and the active metabolite 11‐OH‐Δ^8^‐THC were found in i.v. injected rats at different time points (15, 30 and 60 min) after treatment (Ho et al., 1973). Placental transfer of both Δ^8^‐THC and Δ^9^‐THC has been documented.
Although species‐related differences have been reported, Δ^8^‐THC and Δ^9^‐THC share identical biotransformation pathways. The most important metabolites arise from CYP‐mediated oxidation yielding in turn 11‐OH‐, 11‐oxo‐ and 11‐nor‐9‐carboxy‐derivatives, which totally (11‐OH‐metabolites) or partially (11‐oxo‐metabolites) retain the pharmacological activity, while the carboxy‐derivatives are inactive metabolites. The parent compound and the oxidated metabolites are then subjected to phase II biotransformations; the resulting glucuronide‐ and sulfate derivatives are then excreted via the bile and the urine, with possible quali‐quantitative differences according to the species and the administration routes (Leighty, 1973). The mammary excretion of the parent compound and its metabolites has been documented for Δ^9^‐THC only.
Biotransformation of Δ8‐THC and Δ9‐THC in liver and brain microsomes from experimental animals and humans.
Overall, no major differences in ADME seem to occur between Δ^8^‐THC and Δ^9^‐THC in experimental animals.
In humans
Summary of toxicokinetics of Δ9
‐THC as previously evaluated (EFSA CONTAM Panel, 2015)
3.1.1.4
The oral bioavailability was estimated at 6%, based on human volunteers who ingested 20 mg of Δ^9^‐THC (via a chocolate cookie), and the peak of Δ^9^‐THC concentrations was observed 1–5 h after ingestion.
Due to its lipophilic nature, Δ^9^‐THC is accumulated in adipose tissues from which it may be redistributed to other tissues, including the brain. The transplacental passage of Δ^9^‐THC was also well documented in humans.
Δ^9^‐THC is pharmacologically active and is metabolised by the CYP2C9 and CYP3A4 into 11‐OH‐Δ^9^‐THC, an active metabolite that also contributes to the psychoactive effects. There are more than 100 metabolites of Δ^9^‐THC, the most studied being the 11‐OH‐Δ^9^‐THC. In humans, the first‐pass effect accounts for the generation of 11‐OH‐Δ^9^‐THC in almost equimolar proportion with respect to Δ^9^‐THC; this ratio has been reported to vary markedly as a result of some individuals carrying CYP2C9 genetic polymorphism.
Δ^9^‐THC and 11‐OH‐Δ^9^‐THC are possibly equally potent as their pharmacological activity is not significantly different when administered intravenously (Perez‐Reyes et al., 1972).
The 11‐OH‐Δ^9^‐THC is oxidised to an intermediate aldehyde metabolite (11‐oxo‐Δ^9^‐THC), which is transformed by oxidation into 11‐nor‐9‐carboxy‐Δ^9^‐THC by aldehyde oxidase (AOX). The carboxy group is further glucuronidated and excreted in faeces and urine.
In humans, the oral administration of Δ^9^‐THC results in the prevalent faecal (via the biliary route) (25%–40%) as well as urinary (approximately 13% of the total dose) excretion of both conjugated and non‐conjugated metabolites.
Toxicokinetics of Δ8
‐THC in humans
3.1.1.5
Absorption
Zamarripa et al. (2025) preformed a clinical study (crossover design) in 19 healthy adult volunteers; in order to compare the pharmacokinetic (toxicokinetic) and the acute pharmacodynamic (toxicodynamic) parameters of Δ^8^‐THC and Δ^9^‐THC. They were exposed to single oral doses of 0 (placebo), 10, 20, 40 mg of Δ^8^‐THC, and 20 mg of Δ^9^‐THC per person via brownie ingestion. The wash out period between dosages was at least 1 week. Blood samples were collected at the baseline and 0.5, 1, 1.5, 2, 3, 4, 6 and 8 h post‐dosing and the concentrations of Δ^8^‐THC and Δ^9^‐THC as well their respective metabolites (11‐OH‐Δ^8^‐THC, 11‐nor‐9‐carboxy‐Δ^8^‐THC, 11‐OH‐Δ^9^‐THC and 11‐nor‐9‐carboxy‐Δ^9^‐THC) were quantified.
Tmax was reached between 1 and 4 h after Δ^8^‐THC oral exposure for all dose levels. The Cmax and the AUC increased depending on the dose (Table 1). At the dose of 20 mg, the comparison of the AUC of Δ^8^‐THC and Δ^9^‐THC indicated that the oral bioavailability of Δ^8^‐THC was 1.5 times higher than that of Δ^9^‐THC. This was probably due to metabolic difference between the two isomers, see metabolism section below.
Therefore, the CONTAM Panel estimates a relative oral bioavailability of 9% for Δ^8^‐THC (i.a. comparison of AUC between Δ^8^‐THC and Δ^9^‐THC at the dose of 20 mg and considering an oral bioavailability of 6% for Δ^9^‐THC).
Distribution
There are no studies on the distribution of Δ^8^‐THC in humans.
Metabolism
Watanabe et al. (2007) performed a comparative metabolism study in human liver microsomes, on Δ^8^‐THC, Δ^9^‐THC and CBN. The authors found that Δ^8^‐THC was metabolised primarily by CYP2C9 mainly into 11‐OH‐Δ^8^‐THC and to a less extent to 7α‐OH‐Δ^8^‐THC. The authors also showed that CYP3A4 was responsible for the 7α‐ and 7β‐hydroxylation of Δ^8^‐THC, and for the 9α,10α‐epoxidation of Δ^9^‐THC in human hepatic microsomes. These results were previously found by Matsunaga et al. (2000) and Yamamoto et al. (1983). No sufficient information is available on the pharmacological activity of 7α‐OH‐Δ^8^‐THC and 7β‐OH‐Δ^8^‐THC.
Watanabe et al. (2013) used human brain microsomes to study the metabolism of Δ^8^‐THC and Δ^9^‐THC. The authors found that Δ^8^‐THC was mainly metabolised into two metabolites, corresponding to 7α‐ΟΗ‐Δ^8^‐THC and 11‐ΟΗ‐Δ^8^‐THC. The 11‐OH‐Δ^8^‐THC could be subsequently metabolised to the non‐psychoactive 11‐carboxy metabolites, as shown for 11‐OH‐Δ^9^‐THC (Figure 3) (Huestis, 2007).
Zamarripa et al. (2025) measured the concentrations of Δ^8^‐THC and Δ^9^‐THC metabolites (11‐OH‐Δ^8^‐THC, 11‐nor‐9‐carboxy‐Δ^8^‐THC, 11‐OH‐Δ^9^‐THC and 11‐nor‐9‐carboxy‐Δ^9^‐THC) after oral exposure of Δ^8^‐THC and Δ^9^‐THC (Table 2). The authors found that the ratio of Δ^8^‐THC/11‐OH‐ Δ^8^‐THC was higher than the ratio of Δ^9^‐THC/11‐OH‐Δ^9^‐THC. The opposite observation was made for the 11‐nor‐9‐carboxy‐THC metabolite, where the ratio of Δ^8^‐THC/11‐nor‐9‐carboxy‐Δ^8^‐THC was lower than the ratio of Δ^9^‐THC/11‐nor‐9‐carboxy‐Δ^9^‐THC.
These data suggest that Δ^8^‐THC is metabolised into 11‐OH‐Δ^8^‐THC by CYP450 to a less extent (1.7 times less) compared to 11‐ΟΗ‐Δ^9^‐THC. On the other hand, the further oxidation of the 11‐OH‐metabolite to inactive 11‐nor‐9‐carboxy‐Δ^8^‐THC is 2.6 times higher than the oxidation of 11‐OH‐Δ^9^‐THC to 11‐nor‐9‐carboxy‐Δ^9^‐THC.
Genetic variations in CYP2C9 genes result in individual differences in the metabolism of xenobiotics. The CYP2C93* gene variant is encoding a CYP2C9 enzyme that metabolises xenobiotics slower than its wild‐type form (CYP2C91* gene). On average, CYP2C93/3 homozygotes individuals had a greater internal exposure to THC with the median area under the curve of Δ^9^‐THC to be threefold higher than in CYP2C91/1 homozygotes (Sachse‐Seeboth et al., 2009). This is in line with the currently used uncertainty factor of 3.16 for interindividual variability in toxicokinetics. CYP2C93* prevalence was graded across Europe with overall lower frequencies in North and Central Europe (4.7%–7.2%) compared to South and East Europe (7.9%–10.1%) (Zhou et al., 2023). In individuals carrying the variant gene (one or two allele), the time occurring for the biotransformation of 11‐OH‐Δ^8^‐THC into 11‐nor‐9‐carboxy‐Δ^8^‐THC is longer compared to the wild‐type phenotype.
Excretion
There are no studies on the excretion of Δ^8^‐THC in humans, and the terminal half‐life is not reported. The biliary excretion and enterohepatic circulation were not documented for Δ^8^‐THC in humans. Nevertheless, Fabritius et al. (2012) found high concentrations of 11‐nor‐9‐carboxy‐Δ^9^‐THC ‐glucuronide in human bile samples (N = 10) and suggested that biliary excretion and an enterohepatic recirculation could occur. Moreover, in his review, Huestis (2007) suggested that the enterohepatic circulation of Δ^9^‐THC‐carboxy metabolite contributes to a long terminal half‐life of THC in plasma. It is assumed that, based on the similar structure between Δ^8^‐THC and Δ^9^‐THC, an enterohepatic recirculation could occur for Δ^8^‐THC.
Summary
Little information is available on Δ^8^‐THC ADME in humans after oral administration.
After a single oral administration of Δ^8^‐THC in 19 volunteers, the T max ranged from 2.4 to 2.8 h, suggesting a rapid oral absorption.
There are no data regarding the distribution of Δ^8^‐THC in humans.
Δ^8^‐THC is metabolised both in the liver and the brain into 11‐OH‐Δ^8^‐THC which is subsequently metabolised to 11‐nor‐9‐carboxy‐Δ^8^‐THC, similar to its biotransformation in animals (Figure 3). In addition, the metabolites 7α‐OH‐Δ^8^‐THC and 7β‐OH‐Δ^8^‐THC have been detected, but the information on their pharmacological activity is lacking.
There are no studies on the excretion of Δ^8^‐THC in humans.
Comparison between Δ8
‐THC and Δ9 ‐THC
3.1.1.6
For Δ^8^‐THC, there are limited studies on its toxicokinetic profile in humans. In contrast to Δ^9^‐THC, the oral absorption of Δ^8^‐THC has not been directly characterised. The CONTAM Panel estimated the oral bioavailability of Δ^8^‐THC of 9%, based on an oral bioavailability of 6% for Δ^9^‐THC.
Δ^8^‐THC and Δ^9^‐THC are metabolised by the CYP2C9 and converted to an active metabolite, the 11‐OH‐THC metabolite. The 11‐OH‐THC is further oxidised to an intermediate aldehyde metabolite (11‐oxo‐THC), which is transformed by oxidation into 11‐nor‐9‐carboxy‐THC (inactive molecule) by an aldehyde oxidase. The carboxy group is further glucuronidated and excreted in faeces and urine.
Both Δ^8^‐THC and Δ^9^‐THC are oxidised at the 11 position to form 11‐OH‐Δ^8^‐THC and 11‐OH‐Δ^9^‐THC, respectively. 11‐OH‐Δ^8^‐THC is formed less efficiently than 11‐OH‐Δ^9^‐THC by CYP2C9. Recent data suggest that Δ^8^‐THC is metabolised into 11‐OH‐Δ^8^‐THC by CYP450 in a less extend (1.7 times less) compared to Δ^9^‐THC.
Toxicity in experimental animals
3.1.2
Summary of experimental toxicity data of Δ9
‐THC as previously evaluated (EFSA CONTAM Panel, 2015)
3.1.2.1
Acute oral exposure to Δ^9^‐THC in single doses of up to 3000 and 9000 mg/kg bw in dogs and monkeys, respectively, was not found to be lethal. Clinical observations in these experiments included behavioural changes, emesis, hypothermia and anorexia (Thompson, Rosenkrantz, et al., 1973). The oral LD50 values for Δ^9^‐THC were reported in the range of 666–1910 mg/kg bw in rats and 482 mg/kg bw in mice (Phillips et al., 1971; Thompson, Rosenkrantz, et al., 1973).
For subchronic and chronic toxicity, the most relevant results originate from NTP (US National Toxicology Program) studies in F344/N rats and B6C3F1 mice, following oral administration of Δ^9^‐THC in corn oil by gavage for 5 days each week, for 13 weeks with a 9‐week recovery period and for 2 years (NTP, 1996). In the 13‐week studies with or without recovery period, animals of each species were dosed at 0, 5, 15, 50, 150 or 500 mg/kg bw per day. In the 2‐year studies, Δ^9^‐THC doses for rats amounted to 0, 12.5, 25 and 50 mg/kg bw per day and for mice to 0, 125, 250 and 500 mg/kg bw per day.
In rats, findings in the 13‐week study included mortality attributable to treatment at the high dose (500 mg/kg bw per day), decreases in body weight, nervous system effects (e.g. aggressiveness, lethargy, convulsions), decreases in epididymal weights and sperm motility and increases in abnormal sperm, lower uterus weight, increase in oestrus cycle length. Histopathological findings included atrophy of the testes and ovarian and uterine hypoplasia. In the 2‐year rat study, increased hormone levels were observed at the 15‐month interim analysis in male rats for follicle‐stimulating hormone (FSH) and luteinising hormone (LH) at ≥ 12.5 mg/kg bw per day.
In mice, decreases in body weight, nervous system effects (e.g. aggressiveness, lethargy, convulsions), lower sperm concentration, increase in oestrus cycle length, lower uterus weight, hyperplasia of thyroid gland follicular cells and of the forestomach were noted. Increased incidences of thyroid gland follicular cell adenomas were noted for male and female mice in the 2‐year study at 125 mg/kg bw per day, which was interpreted by the NTP as equivocal evidence of carcinogenic activity of Δ^9^‐THC in male and female B6C3F1 mice (NTP, 1996). The dose response modelling of subchronic and chronic effects of Δ^9^‐THC on different endpoints observed in the NTP studies resulted in 0.73 mg/kg bw per day as the lowest BMDL_10_, which was calculated for the increased oestrus cycle length observed in the subchronic rat study (EFSA CONTAM Panel, 2015).
From in vitro and in vivo studies, it is known that Δ^9^‐THC affects various parameters of the immune system of mice, e.g. inhibition of natural killer cells activity, induction of apoptosis in macrophages and dendritic cells and reduced resistance to influenza virus after oral administration (Do et al., 2004; Karmaus et al., 2013; Massi et al., 1998; Zhu et al., 1998). Perinatal i.p. administration of Δ^9^‐THC to mice caused fetal thymic atrophy and postnatal T‐cell dysfunction (Lombard et al., 2011).
There is no evidence of teratogenicity following exposure of mice to 5–150 mg Δ^9^‐THC/kg bw and rats to 12.3–49.2 mg Δ^9^‐THC/kg bw. Other findings from reproduction studies in rodents include decreases in the number of viable pups, an increase in fetal mortality and early resorptions, in the presence of maternal toxicity (FDA, 2004). From a study, in which Δ^9^‐THC was administered i.p. to female rats, it was concluded that Δ^9^‐THC at low doses may cause a delay in the onset of puberty and permanent alterations in reproductive functions in adult female animals (Wenger et al., 1988). It was concluded that Δ^9^‐THC and other cannabinoids may affect the hypothalamic–pituitary–gonadal axis.
Exposure to Δ^9^‐THC may lead to neurotoxic effects, such as alterations in locomotor activity and decreased responsiveness to amphetamine, reduced social interactions and impaired learning, as shown in a number of animal studies with parenteral or, more rarely, oral administration. Wistar rats which obtained oral doses of 5 mg Δ^9^‐THC/kg bw per day from GD15 until PND9 and were investigated at PND80 (young adult stage) displayed impaired learning (passive avoidance test) and social recognition, associated with alterations in the expression of genes related to the glutamatergic and noradrenergic systems (Campolongo et al., 2007). From in vitro experiments and rat studies with single s.c. administration, there is evidence that the developing brain is more sensitive to Δ^9^‐THC than that of adult animals (Downer et al., 2007), and that doses of Δ^9^‐THC, which do not have detrimental effects alone, may potentiate the effects of chemicals, such as ethanol, phenobarbital and dizocilpine (Hansen et al., 2008).
In vitro ** genotoxicity studies ** with Δ^9^‐THC were performed in the framework of the US National Toxicology Program (NTP, 1996). Exposure with Δ^9^‐THC did neither induce gene mutations in Salmonella typhimurium strains (TA97, TA98, TA100 or TA1535), nor result in chromosomal aberrations in cultured Chinese hamster ovary cells, both tests conducted with or without S9 metabolic activation. At the highest dose tested, for which cell cycle delay indicative of toxicity was observed, Δ^9^‐THC induced sister chromatid exchanges in cultured Chinese hamster ovary cells, in the presence of S9. The induction of single‐ and double‐strand breaks, as well as abasic sites, was measured by single‐cell gel electrophoresis in a series of human cancer cell lines and primary human cell cultures, yielding inconsistent results (Koller et al., 2013). Similarly inconsistent results were obtained in non‐standard assays measuring DNA breaks and micronuclei in zebra mussels (Dreissena polymorpha) (Parolini & Binelli, 2014). Furthermore, in an in vivo study in male and female mice, no increases in the frequency of micronucleated erythrocytes in the peripheral blood were observed after 13 weeks of oral administration of Δ^9^‐THC by gavage at doses of 0, 50, 150 and 500 mg/kg bw per day (NTP, 1996). Overall, although Δ^9^‐THC has shown some limited effects on DNA damage in vitro, it was concluded that the available evidence indicates that it is not genotoxic in vivo.
Acute toxicity studies/single‐dose animal studies
3.1.2.2
General studies
Δ ^ 8 ^ ‐THC in comparison to Δ ^ 9 ^ ‐THC
Mice
Chesher et al. (1973) compared the effects of single oral doses of Δ^9^‐THC (4, 7.5, 15, 30, 60 mg/kg bw), Δ^8^‐THC (4, 9.5, 15, 30 mg/kg bw), cannabinol acetate (10, 20, 40, 60 mg/kg bw), cannabidiol (4, 9.5, 15, 30, mg/kg bw), cannabis extract (composition: 22% Δ^9^‐THC (Δ^8^‐THC not specified), 43% cannabidiol, 34% cannabinol; 7.5, 15, 30, 60, 100 mg/kg bw) or pethidine (2, 4, 6, 8 mg/kg bw) on nociception in male mice (SW strain) by using the hot‐plate method. The cannabinoids (purity not indicated) and the extract were dissolved or suspended in propylene glycol. Δ^9^‐THC, Δ^8^‐THC, cannabinol acetate, cannabis extract and pethidine exhibited dose‐dependent antinociceptive activity; the ED_50_ values being 5.0, 5.0, 32.5, 47.0 and 7.0 mg/kg bw, respectively. Cannabidiol was inactive at the tested dose of 30 mg/kg bw. Pethidine, Δ^9^‐THC and Δ^8^‐THC did not differ significantly in potency. Δ^9^‐THC was estimated to be 6.5 times more active than cannabinol acetate. The same publication also reports the results of another experiment in which oral administration of Δ^9^‐THC, Δ^8^‐THC three cannabis extracts or morphine led in mice to dose‐dependent depressions of the passage of a charcoal meal. Δ^9^‐THC and Δ^8^‐THC were equipotent and were approximately five times less potent than morphine.
Thompson, Rosenkrantz, et al. (1973) administered orally single doses of Δ^9^‐THC, Δ^8^‐THC and a crude marihuana extract (CME, composition: 25%–32% Δ^9^‐THC, 2% Δ^8^‐THC, 2.9% cannabidiol, 3.5% cannabinol and 4% ethanol) per intubation with a catheter to rats, dogs and monkeys as solutions in either absolute ethanol, sesame oil or sesame oil with 2.5%–9.0% ethanol. The results for each species are reported below.
Rats
Male and female Fischer rats were randomly divided into groups of 10 rats each for treatment or control groups. Doses of Δ^9^‐THC and Δ^8^‐THC ranged from 225 to 3600 mg/kg bw and for CME from 625 to 7500 mg/kg bw. Doses for the latter were threefold higher to take into account the approximate 30% cannabinoid content of the extract. The resulting LD_50_ values for the rats observed for 7 days after treatment are shown in Table 3. All test items were significantly more potent in female than in male rats, death consistently occurring between 36 and 72 h after treatment regardless of the test item, dose level or sex of the rats. The lethal potencies of Δ^9^‐THC (90%) and Δ^8^‐THC (99%) dissolved in 2.5% ethanol in sesame oil were of the same order of magnitude. However, the comparison is hampered by the differences in purities of the test items, the remaining 10% of impurities in the Δ^9^‐THC preparation not being defined. The CME was less potent than the two preparations of the THC‐isomers. Mortality in rats apparently was the consequence of CNS effects. Signs of toxicity included severe hypothermia, bradypnoea, rapid weight loss, inactivity, wide stance, ataxia, muscle tremors and prostration. The rats showed a dose‐related weight loss which followed in severity a pattern Δ^9^‐THC > CME > Δ^8^‐THC and which had a maximum (20%) at 48 h post‐treatment. Behavioural changes indicate CNS depression and were reported to increase in duration and number of affected animals with the dose, to be similar for all test items and to persist for 5 days after exposure. According to the authors, histopathologic evaluation of organs from a few rats treated with large doses (3600, 2700 or 5400 mg/kg bw for Δ^9^‐THC, Δ^8^‐THC or CME, respectively) showed that most lesions were only mild or moderate regardless of the test item and that major organs were generally unaffected (Thompson, Rosenkrantz, et al., 1973).
Beagle Dogs
Beagle dogs were treated with single doses of 65.6, 131.3, 262.5, 525 or 3000 mg/kg bw11 of Δ^9^‐THC or Δ^8^‐THC, or 5000 mg/kg bw of CME (vehicle and purity not specified, no indication about inclusion of control animals). One female and one male were treated at each dose level.12 The treatment with Δ^9^‐THC or Δ^8^‐THC up to 3000 mg/kg bw was nonlethal.13 According to the authors, no other histopathologic alterations did occur in the treated animals (only 1 dog, treated with 3000 mg Δ^9^‐THC/kg bw examined). Clinical changes were most prominent in dogs exposed to Δ^9^‐THC, as mydriasis (50% incidence) and salivation (67% incidence) were only induced within 20 and 60 min after Δ^9^‐THC administration but did not occur after treatment with Δ^8^‐THC or CME. Emesis and vocalisation were observed between 1 and 14 h after treatment in 7/12 dogs exposed to Δ^9^‐THC, 2/8 dogs exposed to Δ^8^‐THC and 1/1 dog exposed to CME. Anorexia was seen 18–24 h after treatment only in 4/12 dogs treated with Δ^9^‐THC. One‐third of all treated dogs (no specific indication of test items) exhibited rectal temperatures < 38°C in comparison to a mean control value of 38.3 ± 0.1 (SE). Behavioural changes included drowsiness, ataxia, prostration and anaesthesia and were indicative of depression. The incidences of prostration and tremors were greater in dogs treated with Δ^8^‐THC (no data allowing a quantitative comparison presented), but convulsions were most prevalent after treatment with Δ^9^‐THC. All dogs recovered within 24 h after the treatment despite the severity of the behavioural effects (Thompson, Rosenkrantz, et al., 1973).
Rhesus monkeys
Rhesus monkeys were treated with single doses of 131.3, 262.5, 525, 1050 or 3150 mg/kg bw14 of Δ^9^‐THC or Δ^8^‐THC, or 5000 mg/kg bw of CME (vehicle and purity not specified, no indication about inclusion of control animals). One female and one male were treated at each dose level. No deaths occurred in the treatment groups and clinical observations were reported to be of minor significance since from the treated monkeys only one was hypothermic and none became prostrate. The other clinical signs observed were emesis and anorexia which occurred only in 4/12 monkeys treated with Δ^9^‐THC. For the three test items, the pattern of behavioural changes in the monkeys were similar and generally indicated depression. However, in some of the treated monkeys, a short period of hyperactivity, hyperreactivity to stimuli and aggressiveness was seen. This was followed by a phase of inactivity with lethargy, lack of coordination, imbalance, drowsiness and/or a characteristic crouched posture, the latter found in more than 90% of the treated monkeys. 3/12 monkeys treated with Δ^9^‐THC and sitting in this posture held food in their cheek pouches without chewing for 24–48 h. Animals recovered in general within 2–4 days. Only one monkey, treated with 1050 mg Δ^9^‐THC/kg bw, was examined for histopathologic changes without any lesions being detected (Thompson, Rosenkrantz, et al., 1973).
Studies on endocrine effects
Δ ^ 8 ^ ‐THC in comparison to Δ ^ 9 ^ ‐THC
Cordova et al. (1980) investigated the ovulation blocking potency of Δ^9^‐THC, Δ^8^‐THC and various other natural and synthetic cannabinoids in 3‐month‐old female Wistar‐derived rats as a parameter to compare their effect on the hypothalamic–pituitary–gonadal axis. A stock solution of Δ^9^‐THC and Δ^8^‐THC (20 mg/mL) in ethyl alcohol was prepared and dried to obtain an oily residue which was suspended in a saline solution containing Tween 80 (2.2% (v/v)) and propylene glycol (22.5% (v/v)). These solutions were administered i.p. in increasing doses of 0.0625–10 mg/kg bw for Δ^9^‐THC and of 0.05–25 mg/kg bw for Δ^8^‐THC to female rats at 2 p.m. on the day of pro‐oestrus. The ovulation blocking activity was determined on the morning of oestrus at 09:00 a.m. Animals were killed by cervical dislocation, and the occurrence of ovulation was verified by recovery of tubal ova. Control animals received solvent injections only. Δ^9^‐THC and Δ^8^‐THC prevented ovulation, the dose causing 50% inhibition of ovulation (ED50) being 0.98 mg/kg bw for Δ^9^‐THC and 3.76 mg/kg bw for Δ^8^‐THC, showing a higher potency for Δ^9^‐THC compared to Δ^8^‐THC. Administration of the solvent did not affect ovulation in the control group of pro‐oestrous rats (90% of rats ovulating).
Neurotoxicity studies
Δ ^ 8 ^ ‐THC in comparison to Δ ^ 9 ^ ‐THC
Experimental information for each key study providing dose–response descriptors (e.g. NOAEL, LOAEL, ED_50_) is summarised in Table 4 to facilitate a quick overview of the study design, exposure conditions and main findings.
Locomotor activity and other behavioural effects
A dose‐dependent reduction in motor activity was observed in mice administered Δ^8^‐THC or Δ^9^‐THC via the intraperitoneal (i.p.) route (Brown, 1972; Janoya et al., 2002). In the study by Brown (1972), locomotor activity was measured 15 min after the treatment with increasing doses of Δ^8^‐THC or Δ^9^‐THC as the total number of light beam interruptions by the mouse recorded on a counter. Δ^9^‐THC showed a significant depressant effect at 10 mg/kg bw, while Δ^8^‐THC showed this effect at 32 mg/kg bw. Overall Δ^9^‐THC was more potent than Δ^8^‐THC. The same order of potency in reducing locomotor activity and rearing behaviour was instead observed by Janoya et al. (2002) (Table 4). Additionally, the study by Janoya et al. (2002) investigated the effect of Δ^8^‐THC and Δ^9^‐THC on the head‐twitch response (HTR) and ear‐scratch response (ESR) induced by a selective antagonist of CB1 receptor (SR141716A).15 In this set of experiments, mice were administered i.p. the vehicle or increasing doses of Δ^8^‐THC or Δ^9^‐THC. After 30 min, they were injected i.p. with SR 141716A, and HTR and ESR frequencies were recorded. Δ^9^‐THC was more potent than Δ^8^‐THC in reducing the magnitude of both these behavioural effects.
Administration of Δ^8^‐THC and Δ^9^‐THC (0, 0.5, 2, 10 mg/kg bw, purity not reported) via intravenous injection in the femoral vein of female squirrel monkeys (Saimiri sciureus) (800–900 g) resulted in a range of behavioural changes, including movement in coordination and the emergence of bizarre behaviours such as hair pulling, awkward spinning and head movements (Ho et al., 1972). Sedation and deep sleep followed. Behavioural changes were observed but no attempt was made to quantify the specific effects. The onset of movement incoordination and sedation occurred for both for Δ^9^‐THC and Δ^8^‐THC at 0.5 mg/kg bw, and bizarre behaviour was observed at a dose of 2 mg/kg bw. All effects increased in intensity and occurred earlier with the increasing dose. Δ^9^‐THC was found to be more active than Δ^8^‐THC. Because the data were described narratively by the authors, a NOAEL could not be identified from the study.
Modulation of central excitatory effects
Three studies (Consroe et al., 1973; Consroe & Man, 1973; Izquierdo et al., 1973) assess the acute anticonvulsant properties of Δ^9^‐THC and Δ^8^‐THC using different seizure models in adult rats. Consroe and Man (1973) and Consroe et al. (1973) used female audiogenic seizure‐susceptible rats, administering Δ^9^‐THC or Δ^8^‐THC i.v., measuring effects 30 min later on audiogenic seizures, maximal electroshock seizures (MES) and pentylenetetrazol‐induced seizures. The first two models provided ED_50_ values for both Δ^9^‐THC and Δ^8^‐THC, enabling a comparison of their potencies. Seizure severity was documented using a ranked audiogenic response score (ARS) in the audiogenic seizure test, while the suppression of the hindleg tonic extensor component was measured in the MES test. Both Δ^9^‐THC and Δ^8^‐THC showed a dose‐related anticonvulsant effect in these models with no significant difference in ED_50_ (Table 4), indicating similar potencies. Similarly, Izquierdo et al. observed comparable results after administering Δ^9^‐THC or Δ^8^‐THC (2.5, 5 and 10 mg/kg) via i.p. to rats (160–300 g) in a fornix stimulation seizure model. The CONTAM Panel (EFSA CONTAM Panel, 2015) previously noted Δ^9^‐THC caused convulsions in dogs and rats after acute and repeated exposure. Segal and Asscher (1973) observed that Δ^9^‐THC and Δ^8^‐THC have both excitatory and depressant effects, varying based on context; direct brain administration of Δ^9^‐THC and Δ^8^‐THC produced seizure‐like EEG activity but countered pentylenetetrazole‐induced seizure.
Cannabimimetic effects
Cannabimimetic effects, characterised by catalepsy, analgesia, hypothermia and hypoactivity, are induced by the acute administration of CB1 agonists (Metna‐Laurent et al., 2017). The cannabinoid‐induced tetrad battery tests serve as a model used to assess these effects and determine whether compounds act as agonist of the central type‐1 cannabinoid (CB1) receptor in rodents (Metna‐Laurent et al., 2017). Intraperitoneal exposure of adult male and female C57BL/6J mice to cumulative doses16 of Δ^8^‐THC (6.25–100 mg/kg bw) or Δ^9^‐THC17 (1–20 mg/kg bw) induces typical cannabimimetic effects (Table 4) (Vanegas et al., 2022). Both Δ^8^‐THC and Δ^9^‐THC showed dose‐dependent effects on catalepsy, antinociception, hypothermia, with Δ^9^‐THC being two to six times more potent than Δ^8^‐THC depending on the behaviour (Table 4). Spontaneous locomotor activity inhibition was evaluated only for Δ^8^‐THC at 100 mg/kg bw. Male and female mice were pooled in each experimental group. Pretreatment (30 min) with the CB1 receptor antagonist rimonabant (3 mg/kg bw, i.p.) blocked Δ^8^‐THC (100 mg/kg bw)‐induced catalepsy, antinociception and hypothermia, indicating involvement of CB1 receptor activation. Locomotor activity was not assessed in this set of experiments.
Δ ^ 8 ^ ‐THC
Schwartz et al. (2024) investigated the cannabimimetic effects of Δ^8^‐THC at doses of 10 and 32 mg/kg bw in male and female CD/1 (ICR) mice, aged 5–8 weeks, administered intraperitoneally. At 10 mg/kg bw, Δ^8^‐THC significantly increased cataleptic behaviour and hypothermia in females, but not in males. In a subsequent experiment, both male and female mice were given 32 mg/kg bw of Δ^8^‐THC, which induced antinociception, catalepsy and hypothermia in both sexes similarly. Spontaneous locomotor activity remained unchanged at any dose. These results were in line with those reported by Vanegas et al. (2022). Additionally, the antinociceptive effect of 32 mg/kg bw Δ^8^‐THC was tested against chemotherapy‐induced peripheral neuropathy using 2 mg/kg bw paclitaxel administered intraperitoneally prior to Δ^8^‐THC, but no significant effect was observed.
In a test battery for the testing of anxiolytic or anxiogenic properties of drugs, Jenkins et al. (2023) treated adult male Sprague Dawley rats (7–8 animals/group) by oral doses of Δ^8^‐THC (10 mg/kg bw; purity not indicated), or vehicle (medium‐chain triglycerides oil). Ethyl alcohol was tested as an active control agent. Thirty minutes after the administration, (i) the marble burying test (ii) the three‐chamber social interaction test and (iii) the novelty‐induced hypophagia test were carried out and motor activity was assessed. Δ^8^‐THC (10 mg/kg bw) induced anxiogenic effects in the marble burying test, while in the three‐chamber social interaction test and in the novelty‐induced hypophagia test, Δ^8^‐THC was inactive. An increased activity was only observed after administration of ethanol.
Summary of the comparison between Δ8‐THC and Δ9‐THC in acute toxicity studies/single‐dose animal studies
3.1.2.2.1
As also shown for Δ^9^‐THC, single oral doses of Δ^8^‐THC induce CNS effects and behavioural changes indicative of depression in mice, rats, Beagle dogs and Rhesus monkeys and endocrine effects in one study.
Median oral LD_50_ values in Fischer rats of Δ^9^‐THC (90%) and Δ^8^‐THC (99%) administered in the same solvent amount to 1910 and 1980 mg/kg bw and are considered similar. Female rats were more sensitive to test items than male rats. For both isomers, signs of toxicity in rats were severe hypothermia, bradypnoea, rapid weight loss, inactivity, wide stance, ataxia, muscle tremors and prostration.
Single oral doses of Δ^9^‐THC or Δ^8^‐THC were nonlethal up to a dose of 3000 mg/kg bw in Beagle dogs and up to 9000 mg/kg bw in Rhesus monkeys.
In Beagle dogs, predominant oral toxicity signs included drowsiness, ataxia, prostration, anaesthesia, tremors, mild hypothermia, salivation, emesis and anorexia. Clinical changes were most prominent in dogs exposed to Δ^9^‐THC, as mydriasis and salivation were seen after oral Δ^9^‐THC administration but did not occur after oral treatment with Δ^8^‐THC. Also, emesis and vocalisation occurred with higher frequency in animals orally exposed to Δ^9^‐THC compared to oral exposure with Δ^8^‐THC. The pattern of behavioural changes observed after oral administration differed between the two isomers, incidences of prostration and tremors being greater in dogs treated with Δ^8^‐THC and convulsions being most prevalent after treatment with Δ^9^‐THC.
Toxic signs to oral exposure to Δ^9^‐THC or Δ^8^‐THC in Rhesus monkeys included initial hyperreactivity to stimuli, and in a second‐phase lethargy, drowsiness, characteristic crouched posture and abnormal eating procedures. Emesis and anorexia occurred only in one‐third of the monkeys treated with Δ^9^‐THC and are not reported for monkeys treated with Δ^8^‐THC.
Acute neurotoxicity data have been obtained primarily in adult rodents, with only one oral study in which Δ^8^‐THC was reported to show Δ^9^‐THC‐like effects.
Overall, existing oral acute animal studies show that both Δ^8^‐THC and Δ^9^‐THC exhibit in general effects on the CNS with a tendency to a lower potency of Δ^8^‐THC compared to Δ^9^‐THC. However, the available data after oral administration do not allow a quantitative evaluation of possible differences.
Repeated‐dose toxicity studies
3.1.2.3
General studies
Δ ^ 8 ^ ‐THC in comparison to Δ ^ 9 ^ ‐THC
In a study by Thompson, Mason, et al. (1973), Fischer rats were treated for 119 days with oral doses of 50, 250, 400 or 500 mg/kg bw per day of Δ^9^‐THC (purity: 96%) or Δ^8^‐THC (purity: 99%) or of 150, 750, 1200 or 1500 mg/kg bw per day of a crude marihuana extract (CME, composition: 25%–32% Δ^9^‐THC, 3% cannabidiol, 4% cannabinol and 4% ethanol). Test items were orally administered via intubation as solutions in sesame oil. Control rats received sesame oil. A biphasic pattern of toxicity was observed for all three test items. After a 3‐day depression, tolerance developed and a gradual onset of stimulation was observed after 7 days. The depression was characterised by bradypnoea, hypothermia and mortality, the latter only occurring in the two highest dose groups with higher incidences after administration of Δ^9^‐THC compared to Δ^8^‐THC. The phase of stimulation was manifested as hyperactivity accompanied by irritability, fighting and convulsions. Behavioural changes increased until day 49 and remained constant up to day 119. All treated animals eventually exhibited activity levels three to five times that of control animals independent of the sex, dose or compound. For aggressiveness, an inverse dose‐effect relationship was observed, the earliest onset and maximum incidence occurring in male rats treated with the smallest doses of each test item, while the frequency and onset of convulsions were dose‐related. The severity of fighting followed a pattern of Δ^9^‐THC > Δ^8^‐THC > CME. With respect to convulsions, within each dose group incidences for Δ^8^‐THC were lower than for Δ^9^‐THC and the time of onset of convulsions showed the following pattern: Δ^9^‐THC < CME < Δ^8^‐THC. From the lowest dose groups onwards, all test items induced consistently dose‐dependent decreases in body weights. After 91 days, abdominal fat stores were severely depleted in rats of the highest dose group, effects being more pronounced for Δ^9^‐THC compared to Δ^8^‐THC and female rats being more severely affected than males. For the three test items, the severity of absolute and relative organ weight changes was showing dose‐related decreases for prostate, uterus, ovary and spleen and increases for the adrenal. Referring to known endocrine effects of Δ^9^‐THC reported in literature (see also EFSA CONTAM Panel, 2015), the authors discussed that these changes could be related to the induction of hormone imbalances and may have resulted from a prominent effect of the test items on the pituitary gland. Histopathologic lesions were only observed in bone marrow, spleen, adrenal and testes.18 All changes were mild in severity. The overall incidence of lesions in animals treated with Δ^8^‐THC was lower than in those treated with Δ^9^‐THC or CME. Female rats treated with Δ^8^‐THC exhibited stromal degeneration of the ovaries in all treatment groups, but this effect did not occur in female rats treated with Δ^9^‐THC or CME. Since adverse effects were observed from the lowest dose of 50 mg/kg bw per day onwards, no NOAELs could be defined for Δ^9^‐THC, Δ^8^‐THC or CME from this study.
In an experiment using an animal model of diet restriction (Avraham et al., 2004), a daily dose of 0.001 mg/kg bw of Δ^8^‐THC (purity not indicated) or of Δ^9^‐THC (purity not indicated) or vehicle (Emulphore®19:ethanol: saline, 1:1:18) was administered i.p. to Sabra mice on consecutive days (duration of treatment, number of animals per group and sex not given). The activity, performance and average body weight of animals receiving Δ^8^‐THC, Δ^9^‐THC or vehicle were about the same during the study, but Δ^8^‐THC increased feed consumption slightly more than Δ^9^‐THC (p < 0.05).
ten Ham and van Noordwijk (1973) investigated effects of repeated i.p. administration of Δ^8^‐THC and Δ^9^‐THC solutions (no information on purity of THCs; vehicle: 4% Tween‐80 in 0.90% NaCl) on the aggressiveness of male Swiss‐Webster mice and Chinese hamsters (no information on sex of CH). Groups consisting each of five pairs of hamsters, received either a daily i.p. injection of 50 mg Δ^8^‐THC/kg bw, of 5 mg Δ^9^‐THC/kg bw or of the vehicle for 30 days. Groups formed of five pairs of mice were treated in the same way. The fighting behaviour of the pairs was recorded daily and observations was continued for 7 days post‐treatment. The treated animals were less aggressive than the corresponding controls for the whole treatment period after which degree of aggression in the experimental groups was as high as that in the control groups. The design of the study did not allow a quantitative comparison of the potencies of Δ^8^‐THC and Δ^9^‐THC to reduce fighting activities.
Δ ^ 8 ^ ‐THC
Kulpa et al. (2023) administered for 14‐day preparations of Δ^8^‐THC (0.32, 1, 3.2 or 10 mg/kg bw per day), cannabichromene (3.2, 10, 17, 22, 32 or 100 mg/kg bw per day), cannabinol (1, 3.2, 10, 17, 32 or 100 mg/kg bw per day), tetrahydrocannabivarin (3.2, 10, 17, 22, 32 or 100 mg/kg bw per day) or the vehicle (medium‐chain triglyceride oil) by oral gavage to Sprague Dawley rats (5 animals per sex per group). The authors report that all tested cannabinoids were well tolerated with no clinically relevant changes being observed. No treatment‐related gross abnormalities in examined organs and no biologically significant histopathological alterations were found. Over the exposure period, significant decreases of body weights were seen for males and females of the highest dose group receiving Δ^8^‐THC without feed consumption deviating from the controls. Repeated exposure to Δ^8^‐THC leads to a significant decrease of body temperature in males and females of the high‐dose group. Pain tolerance was significantly improved in male and female rats after repeated dosing with 3.2 or 10 mg Δ^8^‐THC/kg bw per day, since animals had significantly longer reaction times in the tail flick assay compared to the control group. The authors noted that the findings for Δ^8^‐THC mimic effects on pain relief and temperature reduction known for Δ^9^‐THC.
Endocrine toxicity/developmental and reproductive toxicity
Δ ^ 8 ^ ‐THC in comparison to Δ ^ 9 ^ ‐THC
Gupta and Elbracht (1983) investigated the influence of repeated i.p. administration of solubilised Δ^8^‐THC or Δ^9^‐THC (no indication of purity of THCs; vehicle: propylene glycol and 0.90% NaCl in a ratio of 1.2) on the development of pubertal body weight and blood levels of sex hormones in male rats of the Ivanovas strain (Kisslegg, FRG). The animals were allocated to groups and subgroups of 12 animals each and received Δ^8^‐THC or Δ^9^‐THC at a dose of 4 mg/kg bw or vehicle from age day 16 to age day 40 or 87 every other day. At the end of the treatment period until day 40 or 87, the animals were killed with the exception of two subgroups which after exposure until day 40 day to Δ^8^‐THC or Δ^9^‐THC received the vehicle until day 87. In additional groups of 10 animals, which were treated with Δ^8^‐THC or Δ^9^‐THC at a dose of 4 mg/kg bw or vehicle from age day 16 to age day 40 or 87 every other day and observed until 87 days, luteinising hormone‐releasing hormone (LH‐RH) at a dose of 16 μg/kg bw (vehicle: saline) was administrated i.p. on day 87. At 0 and 30 min post injection, luteinising hormone (LH) and follicle‐stimulating hormone (FSH) levels in blood were determined. The controls were untreated animals who received only saline. The treatment of sexually developing male rats from age day 16 to age day 87 resulted in a significant decrease in pubertal growth (p < 0.01), the suppressive effect of Δ^9^‐THC being greater than that of Δ^8^‐THC (by age day 75 significant difference in bw (p < 0.01)). For treatment with both isomers endogenous testosterone (T), dihydrotestosterone (DHT), LH and FSH levels in blood were significantly lower than those in the control animals, with the effects of Δ^9^‐THC being more pronounced than for Δ^8^‐THC.20 For the animals for which treatment was stopped at mid‐puberty (age day 40), an effective ‘catch‐up’ of growth for both isomers was seen, showing no significant difference from the control group by age day 54, although testosterone levels continued to be suppressed but DHT, LH and FSH levels recovered or showed a tendency of recovery. The administration of LH‐RH to the animals treated with Δ^8^‐THC or Δ^9^‐THC until day 87 resulted in significantly (p < 0.001) lower levels of gonadotropins than those in the control animals, the inhibition of gonadotropin production being more pronounced in consequence of Δ^9^‐THC treatment than that of Δ^8^‐THC. When the treatment was withdrawn at age day 40, animals having received Δ^8^‐THC responded to LH‐RH stimulation better than those treated with Δ^9^‐THC. This suggest that the tetrahydrocannabinols block the pituitary gland secretion of LH and FSH and that, for Δ^9^‐THC, this effect is more pronounced and permanent after withdrawal in comparison to Δ^8^‐THC.
Neurotoxicity studies
Δ ^ 8 ^ ‐THC in comparison to Δ ^ 9 ^ ‐THC
Wiley et al. (2024) and Vanegas et al. (2022) investigated how mice could discriminate between Δ^9^‐THC, Δ^8^‐THC and a control vehicle to assess the psychoactive effects of both drugs. Throughout multiple training sessions, adult male and female C7BL/6J mice were administered Δ^9^‐THC (5.6 mg/kg bw) or the vehicle i.p. before being placed in an operant conditioning chamber fitted with two pellet feeders positioned left and right, each with a stimulus light above it. Mice were trained to nose‐poke one feeder when given Δ^9^‐THC and the other when given the vehicle. Each daily training session consisted in two sessions with Δ^9^‐THC followed by two sessions with the vehicle. Mice were considered to have learned the task when they correctly identified the feeder at least 80% of the time over 8–10 sessions. After meeting this criterion, mice were tested 30 min after i.p. administration of increasing doses of Δ^9^‐THC (0.3–10 mg/kg bw) followed by Δ^8^‐THC (1–30 mg/kg bw). When the test involved more than one compound, the second compound or vehicle was administered immediately after the first cannabinoid injection. Both male and female mice showed a dose‐dependent increase in responses on the Δ^9^‐THC‐associated feeder for both Δ^9^‐THC and Δ^8^‐THC, and the authors derived an EC50 (Table 5). Δ^8^‐THC completely replaced Δ^9^‐THC in both sexes; however, it was less potent than Δ^9^‐THC (Table 5). In addition, Δ^8^‐THC was more potent in females than males, while the potency of Δ^9^‐THC was similar between sexes (Table 5).
In a chronic seizure study, caused by implanting bilateral cobalt wires in the frontal cortices, Colasanti et al. (1982) administered 10 mg/kg bw of Δ^8^‐THC or Δ^9^‐THC i.p. to adult male Sprague Dawley rats twice daily from days 7 to 10 post‐implantation. Both Δ^8^‐THC and Δ^9^‐THC decreased the occurrence of seizures on the first and second days of treatment, with tolerance becoming apparent by the fourth day. Additionally, repeated doses of 20 mg/kg bw of both Δ^8^‐THC and Δ^9^‐THC suppressed REM sleep throughout the treatment period. The effects of Δ^8^‐THC and Δ^9^‐THC were found similar.
Δ ^ 8 ^ ‐THC
Adult male and female mice were administered Δ^8^‐THC subcutaneously (s.c.) at a dose of 50 mg/kg body weight twice daily for 6 days and tested for cannabimimetic effects 50 min after injection (Vanegas et al., 2022). By the second day of treatment, tolerance was observed for hypothermia and antinociception, and by the fourth day for catalepsy. Spontaneous locomotor activity was not assessed. The results are based on a combined sample of male (n = 5) and female (n = 5) mice. On the seventh day, the Δ^8^‐THC ‐treated mice received a s.c. injection of the synthetic CB1/CB2 agonist WIN 55,212‐2 (10 mg/kg bw). These mice exhibited cross‐tolerance to WIN 55,212‐221–induced catalepsy, antinociception, hypothermia and decreased locomotor activity. The authors suggest that tolerance is due to the downregulation of the CB1 receptor. In a subsequent set of experiments aimed at assessing physical dependence, mice were injected with Δ^8^‐THC (0, 1, 10, 50 mg/kg bw) s.c. twice daily for 6 days. On the sixth day, 30 min after receiving Δ^8^‐THC or vehicle, mice were administered rimonabant (a selective CB1 receptor antagonist, i.p., 3 mg/kg bw) to induce withdrawal symptoms. Mice displayed somatic signs characteristic of cannabinoid withdrawal, such as increased frequency of head twitches and paw tremors following rimonabant administration, with statistically significant effects observed at 50 and 10 mg/kg bw, respectively.
In a test battery for the testing of anxiolytic or anxiogenic properties of drugs, Jenkins et al. (2023) treated adult male Sprague Dawley rats (7–8 animals/group) by oral doses of Δ^8^‐THC (10 mg/kg bw, purity not indicated) once a day for 21 days. Seven, 14 and 21 days after (i) the marble burying test, (ii) the three‐chamber social interaction test and (iii) the novelty‐induced hypophagia test were carried out and motor activity was assessed. Δ^8^‐THC (10 mg/kg bw per day) displayed anxiogenic effects in the novelty‐induced hypophagia test. The authors note that their data suggest Δ^9^‐THC‐like effects of Δ^8^‐THC.
Summary of the comparison between Δ8‐THC and Δ9‐THC in repeated dose studies
3.1.2.3.1
From repeated dose rodent studies with oral or i.p. administration, there is evidence that Δ^8^‐THC shows Δ^9^‐THC‐like effects.
A subchronic oral study in rats shows that, in the dose interval 50–500 mg/kg bw per day, Δ^8^‐THC and Δ^9^‐THC induce similar toxic effects with a first short phase of CNS depression followed by a continuous phase of hyperactivity. Δ^9^‐THC exhibited a higher toxicological potency in this study compared to Δ^8^‐THC. However, stromal degeneration of the ovaries was only induced by Δ^8^‐THC and not by Δ^9^‐THC. In comparison, the Panel noted that following oral treatment of female rats with Δ^9^‐THC ovarian hypoplasia has been observed in a 13‐week NTP study (NTP, 1996; see Section 3.1.2.1).
A study with repeated i.p. administration of Δ^8^‐THC or Δ^9^‐THC to developing male rats shows that both isomers interfere with male pubertal growth and lead to a decrease of blood levels of sex hormones which may be associated with the disturbance of the pituitary gland function. Effects were more pronounced for Δ^9^‐THC than for Δ^8^‐THC.
In neurotoxicity studies, only one oral study testing the anxiogenic effect of a single dose of Δ^8^‐THC was available. This study does not permit a quantitative assessment of potential differences in potencies due to the lack of adequate dose–response data and a comparison with Δ^9^‐THC. Repeated i.p. administration of Δ^8^‐THC induces tolerance as well as behavioural and somatic signs of physical dependence. Additionally, Δ^8^‐THC produced Δ^9^‐THC‐like discriminative stimulus effect in both males and females, suggesting a qualitatively similar psychoactive outcome. However, Δ^8^‐THC demonstrated greater potency in females compared to males. No sex‐specific difference was observed for Δ^9^‐THC in these experiments. Overall, neurotoxicity data indicate that Δ^9^‐THC is more potent than Δ^8^‐THC and that Δ^8^‐THC exhibits greater potency in females compared to males.
Genotoxicity
3.1.3
Results of standard genotoxicity tests that would permit the evaluation of the potential of Δ^8^‐THC for the induction of gene mutations or structural or numerical chromosomal aberrations are not available.
Research on the potential antineoplastic activity of certain cannabinoids showed that i.p. injection of Δ^8^‐THC (200 mg/kg bw) inhibited the synthesis of DNA, RNA and protein in L1210 mouse leukaemia cells maintained in the mice's intraperitoneal cavity. Additionally, the inhibitory activity of Δ^8^‐THC was more pronounced than that of Δ^9^‐THC (Tucker & Friedman, 1977).
Using the same experimental system, in vivo exposure to Δ^8^‐THC (50–200 mg/kg bw) resulted in a dose‐dependent increase of single and double DNA strand breaks in L1210 leukaemia cells as measured by alkaline and neutral sucrose gradients, respectively. In contrast, only single‐strand breaks were observed following i.p. injection with Δ^9^‐THC (only after exposure to 200 mg/kg bw) (Friedman & Staub, 1978).
QSAR evidence was produced for both substances by endpoint specific and mechanistic QSAR Toolbox profilers to investigate the predicted mode of action and QSAR predictions from genotoxicity models in the OECD QSAR Toolbox version 4.7 (VEGA and Danish QSAR database). In summary (see full results in Appendix A):
- QSAR Toolbox profilers indicate lack of mechanistic and endpoint‐specific alerts for Δ^8^‐THC;
- QSAR predictions with good reliability predict negative Ames test results for Δ^8^‐THC;
- Profiler and QSAR predictions are identical for Δ^8^‐THC and Δ^9^‐THC;
- These results would support a negative mutagenicity prediction for Δ^8^‐THC by read‐across from Δ^9^‐THC.
Overall, standard genotoxicity tests that would allow to assess the potential of Δ^8^‐THC for inducing gene mutations or structural or numerical chromosomal aberrations are not available. Based on read‐across from existing data on Δ9‐THC, for which the available evidence indicates it is not genotoxic in vivo (EFSA CONTAM Panel, 2015), Δ8‐THC is also not considered to be genotoxic in vivo. QSAR analysis supports the read‐across hypothesis between Δ^8^‐THC and Δ^9^‐THC. The analysis only considered QSAR predictions with good reliability. These are available for bacterial mutagenicity (Ames test) and indicate negative results.
Human pharmacological and toxicological data
3.1.4
Summary of human pharmacological and toxicological data of Δ9
‐THC as previously evaluated (EFSA CONTAM Panel, 2015)
3.1.4.1
In 2015, the EFSA CONTAM Panel based its risk assessment on a selection of relevant original papers and pharmaceutical monographs and fact sheets available on clinical trials and case reports on oral exposure of humans to Δ^9^‐THC (e.g. FDA, 2004; Brunton et al., 2006, Martindale, 2014). Focus was put especially on data regarding low doses and threshold doses of health‐relevant effects of pure Δ^9^‐THC either derived by extraction from C. sativa or produced synthetically, considering also that, in the medical field, Δ^9^‐THC is known under the international non‐proprietary name (INN) dronabinol.
Δ^9^‐THC shows a complex pharmacological activity affecting the human CNS and the autonomic nervous system. The main therapeutic uses of Δ^9^‐THC are the inhibition of chemotherapy‐induced nausea and vomiting, mainly in cancer patients, and the stimulation of appetite in the treatment of anorexia associated with weight loss in patients with AIDS. The precise mechanism of the antiemetic action of Δ^9^‐THC is not known, but is probably related to the stimulation of CB_1_ receptors on neurons in and around the vomiting centre. Δ^9^‐THC not only shows reversible effects on appetite, but also on mood, cognition, memory and perception in a dose‐dependent manner (Brunton et al., 2006; FDA, 2004). In clinical studies, also analgesic effects of Δ^9^‐THC have been demonstrated (Noyes et al., 1975; Svendsen et al., 2004).
Among the adverse effects associated with oral therapeutical uses, psychotropic effects, such as euphoria (feeling ‘high’) and dizziness, are most prominent and include effects on cognitive functions and psychomotor skills impairing driving (Chesher et al., 1990; FDA, 2004). In addition, Δ^9^‐THC shows pronounced cardiovascular effects, the most consistent being an increased pulse rate (Hart et al., 2005; Zuurman et al., 2009). In some trials, heart rate slowing has been seen after Δ^9^‐THC ingestion, especially after prolonged exposure (Benowitz & Jones, 1975, 1981; Noyes et al., 1975). Increased blood pressure and orthostatic hypotension have also been found (Benowitz & Jones, 1975, 1981). The digestive system (e.g. abdominal pain) may also be affected.
With chronic use, tachyphylaxis and tolerance develop to some of the cardiovascular and CNS effects. Furthermore, both psychological and physiological dependence have been described following oral Δ^9^‐THC intake (FDA, 2004).
Therapeutic oral dosage in the control of vomiting associated with cancer chemotherapy starts with 0.135 Δ^9^‐THC mg/kg bw given 1–3 h before the first dose of the antineoplastic drug with subsequent dosing every 2–4 h after chemotherapy to a maximum of four to six doses daily. The dose may be increased to a maximum dose of 0.405 mg/kg bw. Most patients respond to 5 mg/person three or four times daily (Brunton et al., 2006; FDA, 2004; Martindale, 2014).
Usual oral dosage for appetite stimulation in patients with AIDS is 2.5 mg Δ^9^‐THC, taken twice daily, before lunch and supper. At these doses, adverse CNS symptoms (feeling ‘high’, dizziness, confusion, somnolence) may occur with a considerable interindividual variability, but usually resolve in 1–3 days with continued dosage (FDA, 2004). In cases where the unwanted CNS symptoms are persistent, a reduction to a single 2.5 mg dose/day given before supper is recommended. If symptoms continue to be a problem at a single dose of 2.5 mg Δ^9^‐THC/day, taking the single dose in the evening or at bedtime is recommended to reduce the severity of adverse effects. After oral administration, Δ^9^‐THC has an onset of action after about half an hour to 1 h and the peak effect occurs after 2–4 h. The psychoactive effects last for 4–6 h, but the appetite stimulating effects can persist for 24 h or longer after ingestion (FDA, 2004).
From a clinical single‐dose study in healthy volunteers with oral administration, the EFSA CONTAM Panel identified 2.5 mg Δ^9^‐THC/day per person as the lowest observed adverse effect dose. At this dose, moderate effects occurred (increased sedation, altered scale scores in the Profile of Mood States (POMS), slightly impaired working memory performance, reduced diastolic blood pressure) (Ballard & de Wit, 2011). In clinical repeated dose studies with durations of 5 weeks (Struwe et al., 1993), 6 weeks (Beal et al., 1995) or 12 months (Beal et al., 1997), the efficacy and safety of orally administered Δ^9^‐THC in the treatment of appetite loss or anorexia related to AIDS was investigated. Adverse events affecting the CNS, such as euphoria, mood altering effects, dizziness, thinking abnormalities, somnolence and sedation, and tachycardia were observed at doses of 2.5 and 5 mg Δ^9^‐THC/day.
Therefore, also in agreement with fact sheets for medical uses (FDA, 2004; Haenseler, 2014), 2.5 mg Δ^9^‐THC/person per day was regarded as a lowest observed adverse effect level (LOAEL) for oral exposure.
Case reports on intoxications with Δ8
‐THC
3.1.4.2
In recent years, a number of poisonings have been caused by the consumption of unregulated Δ^8^‐THC products, which are available without warning labels online or over‐the‐counter in certain countries (Babalonis et al., 2021; Burgess et al., 2024; Simon et al., 2023) and which are reported to contain potentially also up to 30% (related to the final product) of isomeric by‐products and degradants of Δ^8^‐THC (Burgess et al., 2024). These products include food‐like products such as cookies and gummies which resemble popular sweets and also vapouriser cartridges (Burgess et al., 2024; Simon et al., 2023). Cases associated with intake of these Δ^8^‐THC products have been compiled and evaluated referring to data reported to the US Drug Administration Adverse Event Reporting System (FAERS) (Leas et al., 2023; Simon et al., 2023) and to America's Poison Centres (Burgess et al., 2024).
For the period from 1 January 2011 to 30 June 2021, Simon et al. (2023) report 183 intoxication cases listing Δ^8^‐THC as a suspect drug in the FAERS database. Among them, there were 22 cases of death, and in addition, 109 cases classified as serious. Frequency of adverse events was (a case could experience more than one adverse event): dyspnoea 18%, respiratory disorders 9%, seizure 9%, cough 8%, chest pain 8%, vomiting 8%, nausea 8%, pyrexia 7%, feeling abnormal 7%, dizziness 7%, diarrhoea 5%, anxiety 5%, confusional state 5%, pneumonia 4%, fatigue 4%, oropharyngeal pain 4%, increased heart rate 4%, myalgia 4%, tremor 4%, malaise 4%. According to the analysis of Simon et al. (2023), the types of adverse event reported in the Δ^8^‐THC cases in the FAERS data had a different profile compared to those reported in the Δ^9^‐THC cases. They found that more respiratory‐related adverse events were reported with Δ^8^‐THC than for any other cannabis or hemp product during the observation period (% ages of cases with inhalation or oral exposure, respectively, not given).
Data from the American National Poison Data System (NPDS) were analysed by Burgess et al. (2024). Δ^8^‐THC, Δ^10^‐tetrahydrocannabinol and tetrahydrocannabinol‐O acetate were involved in 5022 intoxication cases, mainly ingestions (94.2% of cases) as the primary substance reported to United States poison centres from 1 January 2021 to 31 December 2022. 98.1% of these cases were associated with Δ^8^‐THC, followed by tetrahydrocannabinol‐O acetate (1.1%) and Δ^10^‐tetrahydrocannabinol (0.8%). The reasons for exposure in these cases were most commonly categorised as ‘unintentional‐general’ (40.2%) and ‘abuse’ (33.1%). Frequency of reported clinical effects related to single‐substance exposures with Δ^8^‐THC were (a case could experience more than one clinical effect) CNS depression (mild) 25.0%, tachycardia 23.2%, agitation 15.8%, other neurological 14.3%, vomiting 13.9%, CNS depression (moderate) 10.9%, nausea 10.4%, dizziness/vertigo 8.1%, confusion 7.6%, hypertension 4.5%, hallucinations/delusions 4.1%, tremor 4.0%. When interpreting the data, the authors address the limitation that the NPDS coding would not have captured exposures to more than one cannabinoid from a single product caused by variabilities in manufacturing processes of products. The authors indicate that vaping products accounted for 3.1% of the cases but cannot exclude miscategorisation of the exposure route in some cases.
The CONTAM Panel noted that the studies by Simon et al. (2023) and Burgess et al. (2024) did not analyse the doses of exposure and did also cover products for inhalation. Therefore, their results can only be transferred with restrictions to Δ^8^‐THC products in the food sector or other products for oral consumption.
Publications on cases of oral intoxications in which intake of Δ^8^‐THC occurred in combination with other cannabinoids or for which information on the exposure dose of Δ^8^‐THC is insufficient (Jo et al., 2021; Reid & Banerji, 2021; Miller et al., 2023; Denton et al., 2024; Raghunathan et al., 2024) are not further considered here.
Acute intoxications
Yourish et al. (2021) describe the cases of a 3‐year‐old boy and a 5‐year‐old girl from the same household who were presented to the emergency department (University of Pittsburgh Medical Center) as they were unresponsive after having emptied two previously unopened bags of Δ^8^‐THC gummies (each bag containing 450 mg of Δ^8^‐THC in total). The body weights and the individually ingested doses of Δ^8^‐THC were not reported. The physical examination showed that they reacted only minimally to strong physical stimuli with sluggishly reacting and mydriatic pupils. Comprehensive urine drug screens were performed and positive for THC (not specified if for Δ^8^‐THC or Δ^9^‐THC) and caffeine metabolites. Both patients were admitted to the paediatric intensive care unit for monitoring. The girl was intermittently moderately bradypnoeic and required a high‐flow nasogastric tube for a total of 14 h after admission for the treatment of hypoxia. The mental status of both patients gradually improved and they were discharged on hospital day 3.
Akpunonu et al. (2021) report on a case of a 2‐year‐old girl (15.3 kg bw) who had ingested approximately nine gummies containing in total 225 mg of Δ^8^‐THC (approximately 15 mg Δ^8^‐THC/kg bw). The patient arrived with minimal responsiveness and required intubation in the paediatric intensive care unit of the University of Kentucky due to concerns of airway compromise and encephalopathy. A comprehensive drug analysis confirmed the presence of Δ^8^‐THC in the gummies and the plasma of the child. The girl was extubated after 10 h, and after additional 24 h, the mental alterations had resolved.
Bradley et al. (2023) describe the presentation of two sisters, 2‐ and 4‐year‐old, to an emergency department in a South‐eastern state of the USA following the ingestion of candies containing in total 500 mg or 350 mg Δ^8^‐THC, respectively (corresponding to 38 mg Δ^8^‐THC/kg bw or 16 mg Δ^8^‐THC/kg bw, respectively). Both girls developed periods of bradypnoea with continued intermittent periods of agitation. The analysis of urine samples were positive for THC (not specified if for Δ^8^‐THC or Δ^9^‐THC). Medical intervention included for both patients noninvasive positive pressure ventilation via high flow nasal cannula and intubation for the 2‐year‐old patient due to the declining mental status for airway protection. Both were discharged approximately 45 h after ingestion.
Gibbons and Morris (2024) report on a series of six intoxication cases due to consumption of Δ^8^‐THC containing edible products or vapes among which only for one case the exposure dose was given: A 5‐year‐old girl (bw not indicated) who had consumed a total of approximately 324 mg Δ^8^‐THC contained in 12 gummies was presented to the Emergency Department with dizziness, abdominal pain, pallor, lethargy and unresponsiveness. Her urine was positively screened for THC. Her score at the Glasgow Coma Scale was 4 and her oxygen level briefly desaturated to 80%. After treatment with nasal cannula oxygen, she recovered.
Masilamani et al. (2024) describe the case of a 7‐year‐old boy (25 kg bw) presented to an emergency department. 3–4 h after accidental ingestion of five Δ^8^‐THC gummies (total intake of 75 mg Δ^8^‐THC corresponding to 3 mg Δ^8^‐THC/kg bw) he had become lethargic, however was vitally stable and well appearing. The patient had a history of Attention‐Deficit and Hyperactivity Disorder (ADHD) for which he was treated with guanfacine 1 mg daily. About 7 h after initial ingestion, he experienced a > 15‐s episode of asystole and apnoea requiring sternal rub to awaken, followed by bradycardia (60 beats per minute range). His urine drug screen 24 h after ingestion was positive for THC and negative for other illicit substances. He was treated successfully with 0.1 mg glycopyrrolate and was discharged home in stable condition after an uneventful 24‐h (post‐ingestion) observation. The CONTAM Panel noted that the observed cardiac dysrhythmia could also be associated with the therapeutical intake of guanfacine. Also, an additive or potentiating interaction of Δ^8^‐THC and guanfacine may be possible. Due to these uncertainties, this anecdotal report is not considered further in the current assessment.
Vaphiades (2024) report on a case of a 26‐year‐old man who developed a persisting ‘visual snow syndrome’ (duration: ‘for the last year’; symptoms: visual snow, palinopsia, photopsias) starting on the morning following the consumption of a little less than half of a ‘Δ^8^ gummy’. The author estimated an intake of 4 mg Δ^8^‐THC. However, a urine drug screen was not performed. The patient had no history of tinnitus or migraine headaches and had not consumed other substances. In view of an unclear causal relationship between the single Δ^8^‐THC exposure and the long‐term occurrence of symptoms, this anecdotal report is not considered further in the current assessment.
In summary, intoxications of children by oral Δ^8^‐THC intake doses of approximately 15–38 mg/kg bw due to accidental ingestion of gums lead to mental unresponsiveness and bradypnoea which resolved after emergency treatment.
Clinical studies
3.1.4.3
Δ ^ 8 ^ ‐THC
Abrahamov et al. (1995) investigated efficacy and adverse effects of Δ^8^‐THC (purity: 98%) given as an antiemetic drug to eight children, aged 3–13 years suffering from various haematologic cancers (e.g. Hodgkin's disease, Burkitt's lymphoma, Wilm's tumour) and treated with different antineoplastic drugs for up to 8 months. The children received Δ^8^‐THC only during days when emetogenic drugs were given. Δ^8^‐THC was orally administered in single doses (18 mg/m^2^ in corn or olive oil, corresponding to 0.72 mg/kg bw),22 starting the treatment 2 h before the antineoplastic drug was given and continuing the treatment every 6 h for 24 h (four single doses per day). Δ^8^‐THC was administered to each patient following this time schedule, whenever cycles of antineoplastic therapy were required. The total number of resulting treatment cycles with Δ^8^‐THC was 480 for all children. Vomiting was completely prevented by the treatment with Δ^8^‐THC. For six of the eight children, no side effects were reported, while the remaining two children showed slight irritability, which was associated with euphoria in one case. No anxiety or hallucinogenic effects were noted.
De Souza et al. (1974) investigated how increasing doses of Δ^8^‐THC (purity not reported) affected human tonal preferences, based on the observation that cannabis could alter auditory perception, making sounds, especially music, appear more distinct and enjoyable. Twenty‐five male graduate and undergraduate students, all in good mental and physical health and with normal hearing, were divided into five groups balanced for age, weight and previous experience with marijuana. Each group received a different treatment: placebo, 5, 10, 20 or 40 mg of Δ^8^‐THC administered orally dissolved in 1 mL of ethanol added to 200 mL of orange juice. The experimental procedure consisted of several steps. Before taking the assigned dose of placebo or Δ^8^‐THC, the participants' pulse rate was measured and they performed a time estimation task. In addition, participants were asked to indicate their preference for pairs of tones over a range of frequencies and to express their preference. A follow‐up measurement of pulse rate and a second tonal preference session were conducted 60 min after drug or placebo administration. Δ^8^‐THC (at 10,20 and 40 mg/person) dose‐dependently increased pulse rate and impaired participants' ability to accurately estimate time.
Δ ^ 8 ^ ‐THC in comparison to Δ ^ 9 ^ ‐THC
Hollister and Gillespie (1973) compared the effects of single doses of Δ^8^‐THC (20 and 40 mg; purity not indicated) and of Δ^9^‐THC (20 mg; purity not indicated) each orally administered to six men (age: 20–30 years old) incorporated in cookies in three trials conducted in weekly intervals. Clinical effects were judged by (i) narrative protocols; (ii) records of pulse rate, blood pressure and conjunctival colour; (iii) global rating of the intensity of symptoms using a scale of 0–10; (iv) completion of a self‐rating mood scale; and (v) completion of two repetitive psychometric measures. The spectrum of the resulting clinical effects was qualitatively similar for both isomers, but the lower dose of Δ^8^‐THC produced the least effects, having a slower onset and a shorter duration compared to the other treatments. Early effects included dizziness, dryness of mucous membranes, paraesthesias, increased body awareness, incoordination, tinnitus, muscle tension or tremor and sleepiness. Among the perceptual effects reported were blurring vision, enhancement of colours, vibrations, time distortion and decreased discrimination of hearing. Psychic effects included euphoria, tranquillity, difficulties in thinking, speaking or remembering. Under the conditions of the test (the subjects were mostly recumbent), the mean maximal increase of pulse rates for 20 mg Δ^8^‐THC, 40 mg Δ^8^‐THC and 20 mg Δ^9^‐THC were 7, 12 and 10 beats per minute, respectively. Reddening of conjunctivas was uniformly observed after treatment with 40 mg Δ^8^‐THC or 20 mg Δ^9^‐THC but was less severe and once absent after the administration of 20 mg Δ^8^‐THC. In the global rating, in which the intensity of symptoms using a scale of 0–10 was described, the dose of 20 mg Δ^8^‐THC produced the lowest mean score of 2.2, compared to a mean score of 3.5 for the same dose of Δ^9^‐THC and a mean score of 6.3 for 40 mg Δ^8^‐THC. The high dose of Δ^8^‐THC was always found to cause more symptoms than the other two treatments. At the same dose, Δ^9^‐THC was considered more potent than Δ^8^‐THC in five of six occasions and equivalent to it in the other. Comparing the potencies of Δ^8^‐THC to Δ^9^‐THC, the authors considered the ratio to be approximately 2:3.
Gong Jr. et al. (1984) in a randomised, double‐blind crossover study design, habitual (smoking more than 2 years) marijuana smokers (males, 21–32 years old, no indication of ethnicity) were administered Δ^9^‐THC, Δ^8^‐THC, cannabinol (CBN) or cannabidiol (CBD) orally according to different regimens. The purity of the compounds and the ‘matrix’ used to administer them are not specified. Eighteen subjects received Δ^9^‐THC (20 mg) and at least two doses of different cannabinoids (Δ^8^‐THC 50, 75 mg; CBN 100, 600, 1200 mg; CBD 100, 600, 1200 mg) separated by a 48‐h washout period. Subjects were monitored for systolic and diastolic blood pressure, heart and respiratory rate, airway conductance (SGaw = 1/airway resistance/thoracic gas volume at functional residual capacity) and psychotropic symptoms (rated on a scale of 0–7 = maximum ‘high’ ever experienced). Measurements were taken before the scheduled drug intake and at hourly intervals for up to 6 h. SGaw, heart rate (HR) and psychotropic symptoms are the only endpoints for which results are reported. Δ^9^‐THC (20 mg) significantly increased both SGaw and heart rate (HR) compared to placebo. The effect was time‐dependent and maximal at 3 and 4 h after dosing, respectively. Δ^8^‐THC induced an increase of the same order for both SGaw and HR, but at higher doses (50, 75 mg) than Δ^9^‐THC. SGaw is significantly higher at 75 mg than at 50 mg of Δ^8^‐THC only 1 h after administration. The maximum effect is achieved at 5 h. The HR increase is similar for both doses up to the 6 h measurement. Psychotropic symptoms (‘high’) were slightly higher than 4 for Δ^9^‐THC (20 mg, n = 18) and 3 and 2 for 50 and 75 mg Δ^8^‐THC, respectively.
Zamarripa et al. (2025) conducted a double‐blind, crossover study to compare the acute effects of single oral doses of placebo (0 mg), Δ^8^‐THC (10, 20 and 40 mg; purity > 99%) and Δ^9^‐THC (20 mg; purity > 99%) in 19 healthy adults (aged 18–45 years) who had no exposure to cannabinoids, alcohol and other drugs of abuse within the previous 30 days at screening and before each session. Participants consumed brownies containing the cannabinoids or placebo in five randomised outpatient sessions at least 1 week apart. The study assessed the pharmacokinetics (C max, T max, AUC) of the parent compounds and the most representative metabolites (see Section 3.1.1.4). Volunteers were asked to rate the overall severity (0: not at all, 100: extremely) of subjective drug effects and were assessed for cognitive and psychomotor performance, as well as heart rate, systolic and diastolic blood pressure over an 8‐h period.
Subjective effects (e.g. positive and negative feelings) were assessed through questionnaires.
Cognitive and psychomotor performance were assessed objectively using computerised tasks following a training period. Participants were required to replicate the shape of presented patterns (Digit Symbol Substitution Task – DSST), track a stimulus with a mouse cursor while monitoring a target digit (Divided Attention Task – DAT), select the sum of two numbers most recently displayed on a screen (Paced Auditory Serial Addition Task – PASAT) and perform tasks measuring reaction time, decision‐making, hand–eye coordination and time estimation (Driving Under Influence of Drugs – DRUID). Detailed information on subjective drug effects, cognitive and psychomotor performances and measurement methods are provided in Table B.1, Appendix B.
Δ^8^‐THC produced dose‐dependent effects in several subjective, cognitive and psychomotor domains and on heart rate. DSST and heart rate were significantly affected by Δ^8^‐THC at 20 mg and 40 mg or Δ^9^‐THC at 20 mg between 1 and 6–8 h after dosing and DRUID between 2 and 5 h. According to the authors, the high dose of 40 mg Δ^8^‐THC produced effects of the same magnitude as those of 20 mg Δ^9^‐THC at all time points for all effects observed. However, further statistical analysis by the Panel demonstrated that effects of same magnitude are produced at a dose of 20 mg (see Section 3.1.7). No significant differences were observed between 10 mg Δ^8^‐THC and placebo.
Mode of action
3.1.5
Summary of the mode of action of Δ9
‐THC as previously evaluated (EFSA CONTAM Panel, 2015)
3.1.5.1
In the previous opinion on Δ^9^ THC (EFSA CONTAM Panel, 2015), the CONTAM Panel concluded that the major biological effects of Δ^9^‐THC are mediated by binding to specific G‐protein‐coupled receptors (cannabinoid receptors, CB1 and CB2) which have been identified in all mammalian species tested.
The CB1 are distributed mainly in the brain (basal ganglia, substantia nigra, hippocampus and cerebellum, but not in the brainstem), in some components of the autonomic nervous system (heart, gastrointestinal system), spinal cord, heart (sympathetic nerve terminals of superior cervical ganglion), immune system and reproductive organs, while CB2 are mainly distributed in the lymphoid organs and immune system.23 CB1 and CB2 receptors are also both expressed in human placenta. Δ^9^‐THC may also affect the hypothalamic–pituitary–gonadal axis mainly via the interaction with CB1 receptors found in the hypothalamus, which directly or indirectly modulate anterior pituitary function, resulting in a decreased synthesis of the reproductive hormones, prolactin and growth hormone in exposed individuals.
The Panel noted that Δ^9^ THC could also affect the regulation of histone proteins and DNA methylation in specific neuronal subtypes. In addition, Δ^9^‐THC affects the neurotransmitter systems in experimental models with a dose‐dependent manner where an increase of serotonin (5HT), noradrenaline (NE) and dopamine (DA) was observed.
Available evidence on modes of action for Δ8
‐THC
3.1.5.2
Receptor binding assays
Several studies indicate that the major biological effects of Δ^8^‐THC are mediated by binding to specific G‐protein‐coupled receptors (cannabinoid receptors, CB1 and CB2) similar to Δ^9^‐THC.
Govaerts et al. (2004) assessed Δ^8^‐THC‐binding affinity in CHO cells transfected by human cannabinoid receptors CB1 and CB2 in comparison to Δ^9^‐THC. The authors found that the Δ^8^‐THC/Δ^9^‐THC ratios of K _ i _ values were 7.7 for CB1 and 1.35 for CB2.
In HEK293 cells transfected with the human CB1 and CB2 cannabinoid receptor, Husni et al. (2014) reported a Δ^8^‐THC/Δ^9^‐THC ratios of Ki values of 4.3 and 0.23 for CB1 and CB2, respectively. In a comparable model, Wiley et al. (2024) determined that the affinities (Ki) of Δ^8^‐THC and Δ^9^‐THC for CB1 are 36 (95% CI: 30–44) and 20 nM (95% CI: 14–30), respectively, and for CB2, they are 50 (95% CI: 33–77) and 52 nM (95% CI: 36–77), respectively.
From two separate studies with HEK293 cells transfected with the human CB2 (Huffman et al., 1999; Showalter et al., 1996), the calculated ratio of Δ^8^‐THC/Δ^9^‐THC of Ki was 1.35.
There are no identified studies conducted on human cells or cells transfected with human cannabinoid receptors that monitor the receptor binding assays of THC metabolites. Watanabe et al. (1983) showed that Δ^8^‐THC and its metabolites, 11‐OH‐Δ^8^‐THC and 11‐oxo‐Δ^8^‐THC, had a hypothermic effect in mice after IV exposure. This pharmacological effect is paralleled to the binding of CB receptor. Yamamoto et al. (1998) used cannabinoid receptor site from bovine cortex to study the binding of Δ^8^‐THC and its metabolites. The authors found that the potency to compete the specific binding of the radioligand (CP‐55, 940) to the cannabis receptor was in the following order: 11‐OH‐Δ^8^‐THC > 11‐oxo‐Δ^8^‐THC > Δ^8^‐THC.
Compton et al. (1993) used cortex tissue from rat to assess the binding affinity of CB1 receptor with Δ^8^‐THC, Δ^9^‐THC and their respective 11‐OH metabolites. The authors found that the 11‐OH‐Δ^8^‐THC metabolite had a higher affinity than the parent Δ^8^‐THC: the measured binding affinities was 54.9 and 126 nm for 11‐OH‐Δ^8^‐THC and Δ^8^‐THC, respectively. For 11‐OH‐Δ^9^‐THC and Δ^9^‐THC, the Ki were 38.4 and 40.7 nM, respectively. Tagen and Klumpers (2022) compared the human and rodent studies which measured the binding of both Δ^8^‐THC and Δ^9^‐THC for CB1 receptor, in rodent and human. The authors found that the mean ratio Ki (Δ^8^‐THC/Δ^9^‐THC) values were 6.0, 3.3 and 1.04 for human, rat and mouse receptor, respectively. The authors suggested that Δ^8^‐THC could bind to the CB1 receptor with less affinity than Δ^9^‐THC in human (Govaerts et al., 2004; Husni et al., 2014) and rat (Compton et al., 1993; Hirst et al., 1996; Martin et al., 1981) receptors but could be equipotent in mouse (Compton et al., 1991; Govaerts et al., 2004). Such a comparison was not possible for CB2 receptor due to lack of data in rodent.
In summary, Govaerts et al. (2004), Husni et al. (2014) and Wiley et al. (2024) measured the affinity (Ki) of Δ^8^‐THC and Δ^9^‐THC on human CB receptors using in vitro bioassays and concluded that Δ^8^‐THC had a lower affinity for CB1 than Δ^9^‐THC and about the same affinity for CB2 or lower (Husni et al., 2014). Since these experiments (Govaerts et al., 2004; Husni et al., 2014) used different cell lines and different radio ligands, this difference in results could be explained by different experimental conditions.
For CB1, Tagen and Klumpers (2022) indicated that Δ^8^‐THC binds to the CB1 receptor with less affinity than Δ^9^‐THC in human and rat receptors but were equipotent in mouse.
Measure of intracellular signalling
Several authors performed in vitro experiments on the effect on intracellular signalling pathways after Δ^8^‐THC and Δ^9^‐THC binding to the CB1/CB2 receptor. A table summarising the studies measuring the intracellular signalling in human cell lines and/or mammalian cells transfected with human receptors is presented below (Table 6).
In a similar cell system used for ligand binding, the amount of G‐protein‐coupled receptor activity was measured (e.g. GTPγS functional assay). The GTPγS functional assay measures the ability of Δ^8^‐THC and Δ^9^‐THC to activate the G protein‐coupled receptors. Husni et al. (2014) reported an EC50 of 5820 nM for Δ^8^‐THC and 269 nM for Δ^9^‐THC in the same system (CB1 transfected HEK 293 cell). It appeared that Δ^8^‐THC was 22‐fold less potent than Δ^9^‐THC. With the CB2 receptor system, the EC50 were similar (524 nM and 327 nM for Δ^8^‐THC and Δ^9^‐THC, respectively).
By using another method for measuring activity (forskolin assay to stimulate cyclic AMP production), Gerard et al. (1991) found EC50 values of 82 nM and 13 nM for Δ^8^‐THC and Δ^9^‐THC, respectively, in CHO cells transfected with human CB1. It appeared that Δ^8^‐THC was six times less potent than Δ^9^‐THC.
Using CHO transfected cell with human CB2 receptor, Govaerts et al. (2004) found that Δ^8^‐THC and Δ^9^‐THC act as inverse agonists.
In CHO cell transfected with CB1 rat receptor, Matsuda et al. (1990) reported EC50 values of 27.4 nM and 13.5 nM for Δ^8^‐THC and Δ^9^‐THC, respectively, in a forskolin assay measuring G‐protein‐coupled receptor activity. The corresponding relative potency was 2.
In neuroblastoma mice cell, Howlett (1987a, 1987b) (as cited by Tagen and Klumpers (2022)) measured the inhibition of adenylate cyclase by Δ^8^‐THC and Δ^9^‐THC. With a Ki of 430 and 530 nM for G‐protein‐coupled receptor, respectively, the authors concluded that both isomers had equipotent effect.
Howlett (1987a) showed that 11‐OH‐Δ^8^‐THC and 11‐OH‐Δ^9^‐THC inhibited adenylate cyclase with a greater potency (twofold) than the parent compounds.
In transfected COS‐7 cells with human CB1 and CB2, Rhee et al. (1997) reported EC50 (adenylate cyclase inhibition for CB1) values of 39.9 nM and 11 nM for 11‐OH‐Δ^8^‐THC and Δ^9^‐THC, respectively, so a difference of a factor of 3.6.
Neurotransmitters synthesis and turnover
Alterations in the levels, synthesis and turnover of different neurotransmitters have been observed shortly after acute exposure to Δ^8^‐THC and Δ^9^‐THC via i.p. or i.v. administration in rodents. Both Δ^8^‐THC and Δ^9^‐THC (via i.p) increased acetylcholine (Ach) levels in the cortex of male ICR mice at doses of 10 mg/kg bw for Δ^8^‐THC and 30 mg/kg bw for Δ^9^‐THC, as well as in the hippocampus at 30 mg/kg bw for both compounds (Tripathi et al., 1987). They also decreased Ach turnover in the hippocampus at 30 mg/kg bw (Tripathi et al., 1987). A reduction in Ach total brain levels was observed in male rats following a 1‐h treatment with Δ^9^‐THC and Δ^8^‐THC administered i.v. at 5 mg/kg bw (Askew et al., 1974). Δ^8^‐THC and Δ^9^‐THC also increased, with an equipotent effect, the total brain noradrenaline (NA) and dopamine (DA) biosynthesis at 30 mg/kg bw after 2 h from i.p. administration in rats (Maitre et al., 1974). Following i.v. administration, NA was decreased in the total brain of mice, with Δ^9^‐THC exhibiting greater potency than Δ^8^‐THC (Ho et al., 1972). Conversely, Δ^8^‐THC demonstrated greater potency and efficacy than Δ^9^‐THC in increasing the levels of serotonin (5‐HT) (Ho et al., 1972). Neither NA nor 5‐HT levels in the total brain of squirrel monkeys were affected by Δ^8^‐THC; however, Δ^9^‐THC resulted in a reduction of both following a single intravenous administration (Ho et al., 1972). CB1 receptors regulate the release of neurotransmitters (Katona & Freund, 2012; Kano et al., 2009), which can indirectly affect their synthesis rate and turnover.
Immune effects
The previous opinion reported that Δ^9^‐THC could affect the immune system, where CB2 is expressed to a greater extent than CB1 (EFSA CONTAM Panel, 2015; Karmaus et al., 2013; Srivastava et al., 1998).
Abdel‐Kader et al. (2024) reviewed the studies on the in vivo effects of Δ^8^‐THC. The main studies are briefly described below.
Loveless et al. (1981) administered to BALB/c mice with 60 mg/kg Δ^8^‐THC via i.p route. Mice were treated 2 days before i.p. with an immunising dose of sheep erythrocytes. The authors observed a significant inhibition of direct haemolytic plaque‐forming cells in the spleen with an inhibition peak on day 4.
Wirguin et al. (1994) orally (gavage) administered to male Hebrew University (Sabra) strain and on female Lewis rats with 40 mg/kg Δ^8^‐THC during 21 days. The rats were sensitised with 50 mg of autologous spinal cord emulsified in an equal volume of complete Freund's adjuvant (Difco) containing 3 mg/mL of mycobacterium tuberculosis in order to induce an autoimmune encephalomyelitis. The authors found that Δ^8^‐THC was able to suppress the autoimmune encephalomyelitis and attributed to its influence on the secretion of corticosterone.
Coffey et al. (1996) studied in vitro the effect of different concentrations of cannabinoids on nitric oxide (NO) production in mouse macrophages, stimulated by bacterial endotoxin lipopolysaccharide (LPS). The authors found a significant reduction of NO production and reported a decreasing order of potency in the effectiveness of various THC analogues (Δ^8^‐THC > Δ^9^‐THC > cannabidiol > or = 11‐OH‐THC > cannabinol).
Chen and Buck (2000) showed, in an in vitro study, that submicromolar concentrations of Δ^8^‐THC and Δ^9^‐THC were able to prevent serum‐deprived cell death in B lymphoblastoid cells and fibroblasts. The authors measured the oxidative stress in cells serum free and found that Δ^8^‐THC and Δ^9^‐THC prevented serum‐deprived cell death by antioxidation.
In summary, studies showed that the mechanisms of Δ^8^‐THC on immune system are complex and may include NO reduction and immunosuppressive effects.
Cardiovascular effects
The previous opinion (EFSA CONTAM Panel, 2015) mentioned that Δ^9^‐THC had effects on heart rate in humans mediated via the activation of CB1 receptors (EFSA CONTAM Panel, 2015; Klumpers et al., 2012).
Also, Smiley et al. (1976) observed a direct effect on heart, consisting of arrhythmia and reduced contractility on perfused rat hearts with Δ^8^‐THC.
Genetic polymorphisms and age‐related expression of cannabinoid receptors
CB1 and CB2 receptors are encoded by the cannabinoid receptor genes CNR1 and CNR2, located on the human chromosome 6 and 1, respectively.
For the CB1 receptor, De Fonseca et al. (2005) described a high degree of conservatism (> 97%) of the amino acid sequences between humans, mice and rats. Several studies have shown that genetic variation of the CNR1 gene is associated with variations in the structure and function of the resultant receptor, leading to alterations in CB1 signalling and the effects of cannabis including substance dependence and mental disorders (schizophrenia, attention deficit hyperactivity disorder, posttraumatic stress disorder (PTSD), depression and anxiety) (EFSA CONTAM Panel, 2015; Ferretjans et al., 2022).
For the CB2 receptor, the genetic variations of the CNR2 gene and their effects have been much less well characterised. This gene has been investigated for its role in osteoporosis, inflammatory responses, leukaemia and certain forms of cancer (Foyzun et al., 2024).
As detected by autoradiographic techniques, a significant expression of functional CB1 receptors is already present in human brain at an early stage of gestation (19 weeks); with their density increasing until adulthood is reached (Mato et al., 2003). Studies performed in rats indicate that the number of CB1 receptor binding sites (autoradiography) tended to decrease in aged (36 months) versus young (6 months) individuals, although this downregulation was not uniform in all the examined brain areas. However, functional studies did not disclose significant age‐related differences in the response, suggesting a compensatory increase in receptor function in aged rats (Ginsburg & Hensler, 2022).
Summary of the comparison between the mode of action of Δ8
‐THC and Δ9 ‐THC
3.1.5.3
The main mode of action of Δ^8^‐THC and Δ^9^‐THC is similar via their interaction with cannabinoid receptors. The differences in CB1 and CB2 receptor affinity could contribute to the difference in potency observed between Δ^9^‐THC and Δ^8^‐THC. It should be noted that the assays with the human CB receptors were performed with transfected cells (CHO and HEK) under different conditions leading to some discrepancies between the studies.
Both Δ^8^‐THC and Δ^9^‐THC influence neurotransmitter levels, synthesis and turnover in the brain, with varying potencies.
There are no studies concerning Δ^8^‐THC activity towards non‐cannabinoid receptors.
In summary, in vitro available evidence on modes of action obtained in binding studies with human receptors showed that Δ^8^‐THC has less affinity for CB1 than Δ^9^‐THC and roughly the same affinity for CB2. CB1 is mainly found in the brain whereas CB2 is distributed in lymphoid organs and the immune system.
Consideration of critical effects and dose response assessment
3.1.6
The observed cognitive and psychomotor effects, as well as the increase of heart rate, investigated in clinical studies in humans, are considered the critical effects, as explained below. The effects of Δ^8^‐THC are mediated by its activity as agonist for CB1 and CB2 receptors, both at CNS level and autonomic nervous system level, similar to Δ^9^‐THC.
A dose‐dependent alteration of cognitive and psychomotor effects and an increase of heart rate was observed over an 8‐h period in the acute clinical study by Zamarripa et al. (2025) in healthy adults exposed to 10, 20 and 40 mg Δ^8^‐THC (Section 3.1.4.3).
Case reports showed intoxications of children by oral Δ^8^‐THC intake doses of approximately 15–38 mg/kg bw due to accidental ingestion of gums. Symptoms were mental unresponsiveness and bradypnoea which resolved after emergency treatment. However, these reports on adverse effects associated with single high oral doses are not considered suitable as a basis for dose–response analyses and do not inform on low dose effects.
The effects observed in animal studies support the identification of CNS effects as critical. Oral acute animal studies showed that Δ^8^‐THC, similar to Δ^9^‐THC, exhibit, in general, effects on the CNS including e.g. behavioural effects (e.g. inhibition of locomotor activity) and manifestation in altered levels, synthesis and turnover of neurotransmitters. Neurobehavioural effects, such as anxiety, hyperactivity and somatic signs of physical dependence, are also observed in repeated dose animal studies. The available data after oral administration in experimental animals do not allow a quantitative evaluation of possible differences. Repeated‐dose studies in animals showed that Δ^9^‐THC and Δ^8^‐THC exhibited a similar qualitative pattern of CNS effects, with a lower potency of Δ^8^‐THC compared to Δ^9^‐THC. Dose–response comparisons from neurotoxicity studies after i.p. or i.v. exposure suggest that Δ^8^‐THC is equally or less potent compared to Δ^9^‐THC, depending on the measured endpoint (see Section 3.1.2.2).
Other adverse effects were also observed in an oral repeated dose animal study (Thompson, Mason, et al. (1973)). Stromal degeneration of the ovaries was only induced by Δ^8^‐THC and not by Δ^9^‐THC. However, the Panel noted that following oral treatment of female rats with Δ^9^‐THC ovarian hypoplasia has been observed in a 13‐week NTP study (NTP, 1996). In addition, a study with repeated i.p. administration of Δ^8^‐THC or Δ^9^‐THC to developing male rats showed that both isomers interfere with male pubertal growth and lead to a decrease of blood levels of sex hormones which may be associated with the disturbance of the pituitary gland function. Effects were more pronounced for Δ^9^‐THC than for Δ^8^‐THC (Gupta and Elbracht (1983)). To what extent these effects may be critical needs to be further investigated.
Calculation of a relative potency factor
3.1.7
The Panel considered that the data provided by Zamarripa et al. (2025) can be used to inform on the relative potency of Δ^9^‐THC compared to Δ^8^‐THC. From this study, the CONTAM Panel compared the measured effects of Δ^9^‐THC and Δ^8^‐THC in healthy adults exposed during 8 h at the dose of 20 mg in order to establish a relative potency factor. This comparison was performed by longitudinal analysis using mixed effect models (see Appendix C) for effects in the Digit Symbol Substitution Task (DSST), the Divided Attention Task (DAT), the Paced Auditory Serial Addition Task (PASAT) and the DRiving Under the Influence of Drugs (DRUID)® tasks. The analysis accounts for the correlation between measurements taken at different time points for each individual. Also, the models include random intercept, which assumed that each participant's response started at different values of the response scale, and random time slope, which accounted for differences in individual behaviour across time.
The results are presented in Table 7. The maximum relative potency (expressed as the ratio of the maximum difference in the measured effects in DAT, DRUID, DSST, PASAT and heart rate) is regarded as the most relevant single value across the time points and it occurred at 2.5 h for the heart rate and at 4 h for the cognitive effects. As summarised in Table 7, the point estimate of the relative potency is within the range of 1.0–1.4. Considering the confidence intervals, the relative potency may range between 0.97 and 1.63. Based on this range, the CONTAM Panel considered Δ^8^‐THC equal or slightly less potent than Δ^9^‐THC in humans. Therefore, using a conservative approach, the Panel estimated a relative potency factor of one for Δ^8^‐THC.
This conclusion is supported by the results of limited in vivo oral acute toxicity studies in animals (Section 3.1.2.2) and clinical studies in humans (Section 3.1.4.3) in which Δ^8^‐THC appears to be less potent or at best equipotent with respect to Δ^9^‐THC.
Derivation of a group HBGV for Δ8‐THC and Δ9‐THC
3.1.8
In this Opinion, no new evaluation of Δ^9^‐THC was performed. The ARfD 1 μg Δ^9^‐THC/kg bw set by CONTAM Panel on Δ^9^‐THC is still valid (EFSA CONTAM Panel, 2015). Given the similarity in the effects and mode of action between Δ^9^‐THC and Δ^8^‐THC, the ARfD derived for Δ^9^‐THC can be considered applicable as a group ARfD for both compounds.
Occurrence data in food
3.2
Occurrence data in food submitted to EFSA
3.2.1
Data cleaning and analysis
3.2.1.1
The initial data set, extracted from the EFSA Scientific Data Warehouse (see Annex F for the raw data), included 1914 analytical results on Δ^8^‐THC in food reported by seven European countries. All analytical results were submitted between 2014 and 2024.
A first data cleaning on Δ^8^‐THC results was performed. Data providers were contacted to clarify inconsistencies identified during the data check. However, the occurrence data submitted to EFSA were not systematically checked for possible duplications with the data reported in the literature (see Section 3.2.2). This might have resulted in a partial overlap between the data reported in the scientific literature and the data reported to EFSA and used in the current exposure assessment. The occurrence data were carefully evaluated, and a list of validation steps was applied as indicated below.
The following modifications were made to the initial data set based on the feedback received and/or expert judgement:
-
Certain analytical results (n = 85) on Δ^8^‐THC were confirmed as duplicates of transmission by data providers and were therefore excluded.
-
Food category:
-
○FoodEx2 base terms were reclassified after accurate checks, decisions were based on information contained in different open text variables and/or on clarification given by data providers (n of samples = 379); in specific cases, the addition of CBD or other cannabinoids extracts was indicated by data providers or emerged from open text variables; in this case, this information was extrapolated in a dedicated variable called ‘form’.
-
○Samples erroneously coded as food (e.g. Hemp oil samples confirmed after clarification request to belong to FoodEx2 category ‘Hempoil, feed’) were excluded (n = 19).
-
○Some analytical results on Δ^8^‐THC (n = 17) were excluded because of misreporting in the reported value.
-
Special attention was given to analytical methods used for Δ^8^‐THC measurements. Data providers were asked to systematically provide information on the analytical method used for Δ^8^‐THC especially when positive samples were reported, and information was not sufficiently specified. Consequently, the following modification were made:
-
○After confirmation by data provider, some analytical results (n = 103) based on an analytical method not considered specific for Δ^8^‐THC were excluded.
-
○Upon clarification request, further information on analytical method was provided, and for 61 samples, the analytical method was reclassified as LC‐MS (e.g. for results for which analytical method was initially declared as ‘not possible to classify’).
-
○ n = 13 results were reclassified for inconsistencies in the numerical field result value, result LOQ and type of result after clarification by data providers.
-
○Analytical results based on HPLC‐UV and HPLC‐DAD methods, for which the reliability could not be confirmed by the data providers (n = 19) were excluded.
This first data cleaning resulted in a data set of 1671 samples/analytical results on Δ^8^‐THC produced with different methods.
To gain additional insights concerning the origin of Δ^8^‐THC (see Section 3.2.3.2), co‐occurrence data were extracted for the other cannabinoids CBD (1086 results) and Δ^9^‐THC (1145 results). These additional results pertained to the very same samples analysed for Δ^8^‐THC, but for co‐occurrence data, the Panel focused on a subset of samples analysed with the more reliable LC‐MS‐based methods. The rationale for the exclusion of GC results for these particular subset is that some GC methods may create artefacts, either by thermal decarboxylation of THCA to THC (leading to an overestimation of THC concentrations) or by conversion of CBD to THC (leading to an underestimation of CBD and an overestimation of Δ^8^ and/or Δ^9^‐THC).
A second data cleaning was then undertaken on the entire set of 3902 results as follows:
- When measurements were reported as quantified while the measured value was below or equal to LOQ, these measurements were recoded to be below the LOQ (n = 14). Similarly, when measurements were reported as being below LOQ while the measured concentration was higher than the LOQ, these were recoded to quantified (n = 2).
- For 225 analytical results, it was not specified whether the results were on whole weight basis, such results were reclassified as whole weight after clarification.
After data cleaning, all analytical results were expressed on whole weight basis; thus, no conversion had to be applied.
For most of the data, it was not reported if results were corrected for recovery. When considering samples where Δ^8^‐THC was quantified (113 samples), information of correction for recovery was missing in 26 cases. For the rest of the results quantified for Δ^8^‐THC: 72 were not corrected for recovery (but recovery was not reported) and 15 samples were recovery‐corrected (recovery ranging from 49 up to 137%). It is assumed that the respective EURL guidance and performance criteria as laid down in the respective regulations (e.g. Commission Implementing Regulation (EU) 2023/278324) regarding recoveries were taken into account by official control labs of Member states that submitted the data. The overall measurement uncertainty (including recovery) should be taken into consideration of the analytical results.
An overview of reported LOQs and LODs is presented in Table D1 of Annex D.
Data collection summary
3.2.1.2
Based on the data cleaning, the final data set comprised of 3902 analytical results (on 1671 samples).
Approximately 96% of the samples were collected within official National and EU programmes, 2% from monitoring and 1.8% from a combination of several programmes/others.
In the final data set, about 2% of the samples were reported as ‘Objective sampling’, 65% as ‘Selective sampling’ and 27% of the samples were reported as suspect samples. The remaining were reported as ‘Convenient sampling’ or not specified (EFSA, 2013).
It was decided to retain all samples regardless of the sampling strategy including suspect samples, because of the high number of samples reported as suspect and the similar percentage of left censored data in all types of samples. A total of 458 suspect samples were considered (with 458 results for Δ^8^‐THC, 324 for Δ^9^‐THC and 275 for CBD). Descriptive statistics of suspect samples are presented in Table D2 Annex D at level 1 of the FoodEx2 classification. Briefly, suspect samples were reported for 12 food categories. Overall, however, the suspect samples were mostly left censored for Δ^8^‐THC. The largest number of suspect samples were within category ‘Products for non‐standard diets, food imitates and food supplements’ (n = 238, of which 97% left‐censored); in this category, the reported maximum levels of Δ^8^‐THC was 108,000 (LB=UB) μg/kg in a sample reported as ‘other common supplements’. The second highest sample in this category was a sample of ‘Food supplements and similar preparations’ containing CBD/Cannabinoids extracts and a content of 94,704 μg Δ^8^‐THC/kg. Within ‘Coffee, cocoa, tea and infusions’ food category, 90 samples were reported as suspect (of which many in category ‘Hemp infusion leaves’); however, 99% of them were left censored. A total of 51 samples were reported as suspect within category ‘Sugar and similar, confectionery and water‐based sweet desserts’ (94% left‐censored) – essentially only three samples in this category were not left‐censored for Δ^8^‐THC namely: ‘Hard candies’, ‘Milk chocolate’ and ‘Chocolate/cocoa‐based products’. Some of them were reported to be enriched with CBD/Cannabinoids extracts. Seventeen suspect samples were reported for category ‘Grains and grain‐based products’ (76% left‐censored). In this category, only four biscuit samples were found to be positive for Δ^8^‐THC, all of them were declared to be enriched with CBD/cannabinoids extracts or had a high content of CBD. Twenty‐three samples were reported in category ‘Animal and vegetable fats and oils and primary derivatives thereof’ (96% left‐censored, with a max content of 388,000 μg Δ^8^‐THC/kg reported in a sample of seed oil declared to be enriched with CBD/cannabinoids extracts).
All food samples were sampled from the EU market and originated from EU countries. As shown in Figure 4, results available in the final data set were obtained from samples collected in six European countries, most of them in Germany (73%) and Czechia (12%). It is noted samples obtained from Hungary (n = 15) did not comply with the criteria during the data cleaning (see Section 3.2.1.1) and were therefore disregarded from the assessment.
Distribution of samples analysed for Δ8‐THC reported across different European countries (country of sampling; final cleaned data set).
The number of samples per year is presented in Figure 5.
Distribution of samples analysed for Δ8‐THC by sampling year (final cleaned data set).
Analytical methods used for the data collection
3.2.1.3
Focusing on Δ^8^‐THC, most results were obtained by LC‐MS‐based methods (70%, n = 1168). Some were obtained by GC‐MS‐based methods (25%, n = 419). Five per cent of the results (n = 84) were obtained using other methods or no information on analytical methods was provided. Details on the number of results (Δ^8^‐THC only) per analytical method is provided in Figure 6.
Number of reported samples for Δ8‐THC by analytical method (after data cleaning) – Purple bars represent LC‐MS‐based methods; Yellow bars represent GC‐MS‐based methods; Blue bars represent other methods.
Method performance in terms of detection and quantification limits showed wide variation which may be explained by different factors. Data reporting goes back to 2016. At that time, the analysis of cannabinoids in food was not yet well established. Usually, LOD/LOQ decrease over time with technical progress of instruments as well as the proficiency of the laboratories carrying out the analysis. In addition, cannabinoids are either present as plant constituents with levels of Δ^9^‐THC up to 0.3% in fibre hemp (as is the case for hemp leaves for infusion) or as contaminants (e.g. on hemp seeds and derived products) at much lower levels. Depending on the purpose, the LOQ will be different. It can also be assumed, especially for the less recent data, that in some instances the Union method as laid down in Annex 1 of the Commission Delegated Regulation (EU) 2022/126 was used which was designed to verify the 0.3% criterion for the eligibility of hemp varieties for agricultural subsidies. This method determines THC as the sum of Δ^9^‐THC, the respective acid (THCA) and probably also Δ^8^‐THC due to co‐elution. It is not therefore tailored to determine Δ^8^‐THC individually.
An overview of LODs and LOQs, considering the different method types, food categories (at FoodEx2 Level 1) is presented in Annex D1 for the three analytes. For Δ^8^‐THC, the median LOQ ranged from 2 μg/kg (in ‘Milk and dairy products’ and ‘Water and water‐based beverages’) up to 500 μg/kg in ‘Products for non‐standard diets, food imitates and food supplements’ considering LC‐MS‐based data. When considering data produced with GC‐MS methods, the median LOQ varied from 5 up to 1000 μg/kg for Δ^8^‐THC. For other methods, median LOQ varied from 20 up to 10,000 μg/kg for Δ^8^‐THC across food categories.
Occurrence of Δ8
‐THC and other cannabinoids
3.2.1.4
Considering Δ^8^‐THC, proportions of non‐detected, non‐quantified and quantified analytical results as well as the number of analytical results by food category (FoodEx2 Level 1) are presented in Figure 7. The majority of samples were left‐censored for Δ^8^‐THC. A total of 18 food categories were represented. The most represented food group was ‘Products for non‐standard diets, food imitates and food supplements’ with 487 samples reported (including ‘Food supplements and similar preparations’ and ‘ Herbal formulations and plant extracts’); it was followed by ‘Animal and vegetable fats and oils and primary derivatives there of’ with 347 samples, most of them on hemp seed oil. This was followed by ‘Coffee, cocoa, tea and infusions*’* with 210 samples (of which 115 for Hemp infusion leaves/Common hemp infusion leaves) and ‘Legumes, nuts, oilseeds and spices’ with 167 samples (of which 158 for hemp seeds). Excluding food categories with less than five samples reported, the highest percentage of quantified data for Δ^8^‐THC was found in ‘Sugar and similar, confectionary and water based sweet desserts’ (22%) followed by ‘Water and water based beverages’ (15%) and ‘Products for non‐standard diets, food imitates and food supplements’ (9%). Tables containing the same information and data for CBD and Δ^9^‐THC are available in Annex D3 and D4.
Percentage of analytical results below LOD, below LOQ and quantified values in the final data set across the different food categories (FoodEx2 Level 1) for Δ8‐THC. The sum of percentages for non‐detected, non‐quantified and quantified values is not always 100% due to rounding.
The data set also included analytical results for Δ^9^‐THC and CBD for samples for which Δ^8^‐THC was reported based on LC‐MS‐based methods. The proportion of quantified data across other analytes was higher than for Δ^8^‐THC, and especially 59% for Δ^9^‐THC and 77% for CBD. Proportions of non‐detected, non‐quantified and quantified analytical results by analyte regardless the food category are presented in Figure 8.
Proportion of non‐detected, non‐quantified and quantified analytical results for CBD, Δ9‐THC and Δ8‐THC different cannabinoids considered in this opinion. The sum of percentages for non‐detected, non‐quantified and quantified values is not always 100% due to rounding.
An overview of the number of analytical results, the proportion of left‐censored data and the median (P50), the 75th (P75) and the 95th percentile (P95) concentration values at FoodEx2 Level 1 for LB‐UB is presented in Table 1 for Δ^8^‐THC. For CBD and Δ^9^‐THC, data are reported in Tables D5 and D6 of Annex D for different foods (Level 1 of FoodEx2).
The occurrence data on Δ^8^‐THC covered 18 FoodEx2 (Level 1) food categories; however only for 11 food categories, five or more results were reported (and for those, statistics is reported in Table 11). For all those categories, the median as well as the 75th percentile was generally 0 μg/kg at the lower bound (Table 11), because of the high percentage of left‐censored data. At the 95th percentile, the highest value was reported for ‘Sugar and similar, confectionery and water‐based sweet desserts’ and especially 39,100 μg/kg (LB=UB), followed by ‘Products for non‐standard diets, food imitates and food supplements’ with a P95 of 24,000–75,000 μg/kg (LB–UB) and by grains and grain‐based products [P95 = 350–1000 μg/kg (LB–UB)].
Figure 9 represents a jitter plot of the individual reported values for Δ^8^‐THC per food category at the LB. For the majority of positive samples in all food categories, the content of Δ^8^‐THC was low. Single higher values were found in the categories ‘Animal and vegetable fats and oils and primary derivatives thereof’, ‘Coffee, cocoa, tea and infusions’, ‘Fruit and vegetable juices and nectars’ and ‘Grains and grain based product’. Several higher values were reported in the categories ‘Sugar and similar, confectionery and water‐based sweet desserts’ and ‘Products for non‐standard diets, food imitates and food supplements’. In the last two categories, a broad variation of the content of Δ^8^‐THC is visible, when looking at individual values.
Jitter plot showing the individual (black circles) and average (red diamond) occurrence levels of Δ8‐THC at the lower bound for different FoodEx2 Food Categories (Level 1) at the UB.
Possible explanations for the higher levels in some categories are the addition of hemp extracts (with inherently higher concentrations of cannabinoids), e.g. ‘CBD oils’, the contamination with or deliberate addition of semi‐synthetic Δ^8^‐THC to the food or the extract and the formation of Δ^8^‐THC from other cannabinoids during food or extract processing and storage conditions. A detailed discussion per food category is given below.
Considering the lowest Foodex2 level (Level 7), high proportion of quantified data were found in ‘Food supplements and similar preparations’ (62%), ‘Herbal formulations and plant extracts’ (23%) and in ‘jelly candies’ (77%)/‘gum drops’ (29%). These latter products are known to be used as carrier for psychotropic substances, e.g. the semi‐synthetic cannabinoid HHC and it is possible that, in these cases, semi‐synthetic Δ^8^‐THC was added. The same could be the case for ‘biscuits’ (13%) and possibly also for ‘crackers and breadsticks’ (57%). Elevated proportion of quantified data are also found in soft drinks (37%), functional drinks (16%), cola‐type drinks (14%) and energy drinks (7%). In contrast to Δ^8^‐THC, the quantified data for Δ^9^‐THC were considerably higher. This is not surprising since hemp‐based products were in the focus of the sampling. Hemp seed oil, for example, had positive findings for 91% of the samples, hemp seeds 78% and hemp infusion leaves 83%. Other categories had lower incidence rates (e.g. different drinks around 20%), but this could also be caused by the fact that no or only small amounts of hemp had been added.
For Δ^8^‐THC, the category ‘Products for non‐standard diets, food imitates and food supplements’ exhibits the highest number of samples with high concentrations. These samples are falling in the subcategories ‘Herbal formulations and plant extracts’ and ‘Other common supplements’/’ Food supplements and similar preparations'. The category ‘Sugar and similar, confectionery and water‐based sweet desserts' contains less samples but among them the highest concentration of Δ^8^‐THC of all samples in the EFSA database. This concerns the Food level 7 categories (Foodex2 level 7) ‘Jelly candies', ‘Honey’ and ‘Syrups'. In ‘jelly candies' (and gum drops), the highest number of positive samples with high concentration of Δ^8^‐THC was found.^8^
Focusing on Food Categories ‘Hemp seed oil’, ‘Hemp infusion leaves’ and ‘Hemp seeds’ (FoodEx2 Level 5, Table 12 and Figure 10), the vast majority of samples were left censored for Δ^8^‐THC with the 95th percentile occurrence at the LB at 0 for the three types of hemp matrices here considered. For category ‘Hemp infusion leaves’, only five positive samples were reported with levels of Δ^8^‐THC up to 34,600 μg/kg. Higher levels were found in leaves as compared to seeds. This can be expected because in leaves THC is a natural occurring constituent. The levels in permitted hemp varieties in the EU may go up to 0.3% total THC. In contrast in seeds, which are naturally free of THC, the measured THC is a contamination stemming from the contact of the seeds with the THC containing trichoma of the seed covering leaves or other plant parts during harvesting. Figure 5 represents a jitter plot of the individual reported values for Δ^8^‐THC for these three Food categories at the LB.
Hemp leaves, hemp seeds and derived products (including hemp seed oil) can be considered as the least processed hemp food products, unless there are indications in individual samples (e.g. a high ratio of Δ^8^‐THC to Δ^9^‐THC) that the contained Δ^8^‐THC is of non‐natural origin.
Jitter plot showing the individual (black circles) and average (red diamond) occurrence levels of Δ8‐THC at the lower bound for (Level 5) for ‘Hemp infusion leaves’, ‘Hemp seed oil’ and ‘Hemp seeds’.
Other occurrence data of Δ8
‐THC in hemp food products from the literature
3.2.2
This opinion focusses on the occurrence of Δ^8^‐THC in food. Data on the occurrence of semi‐synthetic Δ^8^‐THC added to cannabis, fibre hemp or other plant materials, vapes/e‐liquids as well as to food (e.g. jelly candies, cookies) as a drug is not considered here. Nevertheless, some studies that report THC in primary hemp products (leaves, inflorescences) for non‐food use (industrial/fibre, medical and recreational applications) are included here to shed light on the occurrence of Δ^8^‐THC and ratios with Δ^9^‐THC.
Studies on the occurrence of cannabinoids in food usually either focus on Δ^9^‐THC only, a small set of major cannabinoids (besides Δ^9^‐THC also THCA, CBD, CBDA, CBN) or a broader scope of 15–20 cannabinoids (then often including Δ^8^‐THC), but not on Δ^8^‐THC only.
Benes et al. (2024) investigated inflorescences of both drug and fibre hemp including the varieties Santhica and Finola that potentially may be used for hemp tea. Δ^8^‐THC was detected in none of the samples. Maly et al. (2024) investigated plant material from three cannabis varieties (one medical grade, two fibre grade) and detected Δ^8^‐THC in none of them. Gul et al. (2015) investigated plant material from three different cultivars (drug type, intermediate type and fibre type) and detected Δ^8^‐THC in none of them. However, in 10 samples from drug seizures, they detected Δ^8^‐THC in eight samples, at levels ranging from < LOQ (235 mg/kg or 0.0235%) to 0.49%. Triesch et al. (2023) found no Δ^8^‐THC in 23 hemp teas (consisting of hemp leaves or leaves and flowers). Di Marco Pisciottano et al. (2021) investigated a very diverse set of samples (hemp seed flour, pasta, bakery products, beverages, coffee, infusion mix, honey) containing either hemp seed flour or hemp leaves and inflorescences. While Δ^9^‐THC was detected in most samples, Δ^8^‐THC was only detected in some of the samples positive for Δ^9^‐THC, with no obvious pattern or explanation. Levels of Δ^8^‐THC ranged from 0.02 to 10 mg/kg. In a study by Citti et al. (2019), Δ^8^‐THC was not detected in any of the 10 hemp seed oil samples. The same holds for a study by Lindekamp et al. (2024) in which 30 hemp seed oil samples were analysed. Thiebot et al. (2024) investigated the levels of cannabinoids in homemade cannabis edibles as well as in the ingredients. They did not detect any Δ^8^‐THC in cake samples and the herbs or resins used for their preparation, despite high to very high levels of Δ^9^‐THC in these materials (up to 22% in the resins). A broad range of hemp‐derived products, including drinks, water‐soluble oils, topicals, gummies, hard candy, coffee, snacks, and pet treats, were analysed by Meyer et al. (2024) with no detection of Δ^8^‐THC although CBD was present in all and Δ^9^‐THC in one‐third of the samples..
In conclusion, in the majority of studies, no Δ^8^‐THC was detected in hemp food samples despite the presence of Δ^9^‐THC and other natural cannabinoid. The same holds for hemp plant material used for non‐food purposes. Only in very few publications, the presence of Δ^8^‐THC in food is reported.
The situation is of course different for products to which semi‐synthetic Δ^8^‐THC was intentionally added to achieve a drug effect. As mentioned above, these products are not in the scope of this opinion, but the observed values can help to contextualise some of the higher values in the EFSA database. The highest concentration from the EFSA data (675 mg/kg = 0.0675%) is below the concentrations found in Δ^8^‐THC food products marketed with purpose as drug use. Kaczor et al. (2024) analysed Δ^8^‐THC products (e.g. gummies, chocolate) that were bought in US retail stores. The measured concentrations of Δ^8^‐THC in these samples were in the range of ca. 0.2%–1%. Huang et al. (2024) found concentrations of 0.65% and 3% in two gummy samples that were purchased online in the Netherlands.
Co‐occurrence of Δ8
‐THC and other cannabinoids in food
3.2.3
Ratio Δ8
‐THC to Δ9 ‐THC
3.2.3.1
The terms of reference request that the opinion addresses the occurrence of Δ^8^‐THC and the co‐occurrence with Δ^9^‐THC in hemp and hemp‐derived products. A subset of samples for which concentrations of both Δ^8^‐THC and Δ^9^‐THC were reported and measured by LC‐MS‐based methods were here considered in order to evaluate more accurately the co‐occurrence. Overall, considering Foodex2 level 7 classification, the rate of quantified data for Δ^9^‐THC was considerably higher than those of Δ^8^‐THC. This is not surprising since hemp‐based products were in the focus of the sampling.
The ratio of Δ^8^‐THC to Δ^9^‐THC (Δ^8^/Δ^9^ Ratio) was calculated only for samples for which both substances were not‐left censored (n = 96 samples). In these samples, the Δ^8^/Δ^9^ ratio ranged from 0.009 up to 17.7, with an average of 1.37 and a standard deviation of 2.28. Figure 11 shows the ratio for categories where five or more samples were present, the ratio is displayed as individual values (black circles) and mean (red diamond). Although different types of food were represented, the number of samples per food category was quite low, when considering Level 1 of the FoodEx2 classification. Jelly candies, Gum drops were mostly reported for category ‘Sugar and similar, confectionery and water‐based sweet desserts’. Within the category, ‘Water and water‐based beverages’ different types of ‘Energy drinks’, ‘Functional drinks’ and soft‐drinks were reported. Figure 5 shows the ratio for categories where five or more samples were present, the ratio is displayed as individual values (black circles) and mean (red diamond). The only type of sample reported for category ‘Coffee, cocoa, tea and infusions’ was in this case ‘Hemp infusion leaves’. For ‘Grains and grain‐based products’, the ratio was quite broad, and a biscuit sample presented a ratio close to 18. This sample had a content of Δ^8^‐THC of 2.3 mg/kg and was left‐censored for CBD. The larger number of samples were present in category ’Products for non‐standard diets, food imitates and food supplements' (n = 38), where different types of ‘Food supplements and similar preparations’ and ‘Herbal formulations and plant extracts' were reported. The Δ^8^/Δ^9^ ratio was quite variable. Some samples were declared to be enriched with CBD oil or contained CBD in high amount.
Jitter plot showing the concentration ratio of Δ8‐THC to Δ9‐THC for individual samples (black circles) for different FoodEx2 Food Categories (Level 1) and their average (red diamond) – graph only refers to categories where five or more samples were reported. The dashed line marks the threshold ratio of 1, i.e. when concentration ratio of Δ8‐THC equals Δ9‐THC.
In literature, the ‘natural’ occurrence of Δ^8^‐THC is explained by isomerisation (induced by aging, and heat and light exposure of the material; see chapter 1.3.3) from Δ^9^‐THC. If Δ^8^‐THC is present at all, the Δ^8^/Δ^9^ ratio in hemp plant material (including cannabis for medical/drug use) is usually below 0.1, going up to 1 for some aged hashish samples (Lerner & Zeffert, 1968). The evaluation of the data from the EFSA database revealed that almost half of the samples positive for Δ^8^‐THC had ratios above 1, going even up to 18. This indicates that, in these samples, the measured Δ^8^‐THC does not stem from isomerisation of naturally present Δ^9^‐THC, but rather from other processes or sources. In some samples, Δ^8^‐THC is detected without the presence of any Δ^9^‐THC, which also points to the deliberate addition of Δ^8^‐THC. It is also worth noting that many of the samples with relatively high Δ^8^/Δ^9^ ratios are products classified as food supplements which includes hemp extracts (e.g. ‘CBD oils’). In these extracts, certain cannabinoids could be enriched by fractionation of the extracts, or usually high levels of CBD in CBD oils could result in the unintentional formation of Δ^8^‐THC from CBD under conditions that favour the cyclisation of CBD (e.g. acidic conditions). Even if only a minor percentage of CBD would be transformed, this would lead to measurable amounts of Δ^8^‐THC due to the high concentrations of CBD. Furthermore, high ratios were also observed in matrices such as jelly candies that are known to be used as carriers for psychoactive substances that are not (yet) regulated, for example, some semisynthetic cannabinoids. Considering the samples from the EFSA database that do contain both Δ^8^‐THC and Δ^9^‐THC, the ratios are strongly variable even when excluding samples with ratios above 1 that could be attributed to non‐natural sources.
Ratios of Δ8
‐THC, Δ9 ‐THC and CBD
3.2.3.2
The ratios of these three cannabinoids were assessed to possibly gain additional insights concerning (i) the hemp variety that had been used for the production of the respective food samples (from the ratio of Δ^9^‐THC to CBD), (ii) a possible formation of Δ^8^‐THC from either CBD or Δ^9^‐THC, (iii) the correlation with certain food types. The statistical evaluation of the correlations revealed that the Δ^8^‐THC, Δ^9^‐THC and CBD contents do depend on the food category and follow certain ratios, but given the inconsistency in the pattern of results, no clear conclusion can be drawn across all food categories. The interpretation is difficult because even for mono‐ingredient food samples (e.g. hemp leaves, hemp seeds) the batch may be composed of material from different cultivars with different ratios of the individual cannabinoids. This situation is even more pronounced for composite foods. Hemp extracts may contain the natural spectrum of cannabinoids, but they may also be fractionated to enrich specific cannabinoids. Finally, if such extracts are added to foods that do contain cannabinoids also naturally, the ratios are largely skewed.
Summary
3.2.3.3
The vast majority of food and hemp plant material samples described in literature containing Δ^9^‐THC did not contain any Δ^8^‐THC. It has thus to be considered that Δ^8^‐THC is not ubiquitously present in natural hemp products (unlike other major and minor cannabinoids). More positive samples than could be expected from literature findings were reported in the EFSA database; however, the majority of samples were left censored in particular for hemp seed oil, hemp infusion leaves and hemp seeds. There are various possible explanations for this observation.
- The samples in the database are not representative. Many samples are from selective or suspect sampling; in some cases, it could be shown that the samples were labelled in a way that suggest they were offered in specialised shops for cannabis consumer with an intended drug effect. Some of the samples that were analysed were not legally on the market. Either these were hemp extracts marketed as ‘CBD oils’ or similar, had such extracts added to food, these products would need an approval as novel foods. There could be an enrichment of natural Δ^8^‐THC in the extracts, or semisynthetic Δ^8^‐THC could be present.
- Analytical pitfalls could have led to artefacts in the determination of Δ^8^‐THC, especially in the older data.
- Food processing and storage conditions may have led to the formation of Δ^8^‐THC from other cannabinoids.
- Regarding the presence of Δ^8^‐THC in animal derived products (meat, milk, eggs, etc.), the occurrence database is very limited, and in the samples available, Δ^8^‐THC was not detected. Overall, no conclusion can be drawn on the potential transfer from feed to animal products, also due to the lack of information whether the animals were fed hemp silage or not.
Uncertainty analysis
3.3
Uncertainty assessment objectives
3.3.1
The aim of the uncertainty analysis is to identify and quantify the specific uncertainties in the derivation of a HBGV for Δ^8^‐THC and combine them to assess the overall certainty of the main conclusions, as recommended in EFSA's guidance on uncertainty analysis (EFSA Scientific Committee, 2018). Due to the specific nature of this mandate, the uncertainty analysis was conducted quantitatively only for the hazard assessment. The analysis focused on ensuring that the selected relative potency factor is protective.
Regarding the occurrence and co‐occurrence data on Δ^8^‐THC, the uncertainty analysis was limited to the qualitative identification of the uncertainties since no exposure assessment was needed for this mandate.
Uncertainty in hazard characterisation
3.3.2
Sources of uncertainty impacting the final conclusion
3.3.2.1
In a first step, sources of uncertainties related to the Δ^8^‐THC hazard identification and characterisation and to the occurrence data and co‐occurrence data for Δ^8^‐THC and Δ^9^‐THC were listed and discussed (Appendix D). The uncertainty analysis focuses on uncertainties, which are specific to the current assessment. Uncertainties related to the risk assessment of Δ^9^‐THC were considered as standard and have been discussed elsewhere (EFSA CONTAM Panel, 2015). Among the specific uncertainties, those with the most impact on the outcome of the hazard identification were considered.
These main sources of uncertainty were further discussed individually.
- Data from only one human clinical study were appropriate for the hazard characterisation of Δ^8^‐THC compared to Δ^9^‐THC
Considering that data from only one human clinical study were available for the derivation of the potency factor, the uncertainty analysis of the hazard characterisation focused on the quantification of the uncertainties of this study. The main sources of uncertainties in the Zamarripa et al. (2025) studies were:
- The low number of individuals;
- The calculation of the RPF based on only one dose;
- The length of the wash out period.
In a clinical trial with relative low number of participants and limited number of doses, statistical differences may not be detected and the confidence interval may be very wide. Despite the relatively low number of participants in this study and the comparison at only one dose, the well‐controlled within‐subject crossover design and the statistical analysis which determined differences in potency of Δ^8^‐THC relative to Δ^9^‐THC within narrow confidence intervals that ranged from 0.97 to 1.63 (see Table 7) reduced the uncertainty.
To confirm the absence of THCs before the dose administration, participants’ blood tests were performed.
In addition, the outcome of oral acute toxicity studies in animals and the similarity in the metabolic pathway provided supportive evidence to the equal potency.
- No studies are available with appropriate design to assess other effects relevant for the hazard characterisation.
Some repeated dose studies with Δ^8^‐THC and/or Δ^9^‐THC in animals indicate reproductive effects and endocrine activity. The studies related to Δ^8^‐THC are limited and not suitable for comparative dose response analysis between Δ^8^‐THC and Δ^9^‐THC and derivation of potency factors.
Uncertainties in occurrence of Δ8
‐THC and co‐occurrence data of Δ8 ‐THC and Δ9 ‐THC
3.3.3
The major uncertainties expected in the occurrence and co‐occurrence data are the following:
- Analytical methods applied to measure plant toxins (i.a. cannabinoids) in food and feed should meet the performance criteria laid down in Commission implementing regulation (EU) 2023/2783 ^24^ . In terms of precision, a maximum relative standard deviation under reproducibility conditions (RSDR) of 25% must be achieved, relating to an expended measurement uncertainty of 50%. However, in older data, or data from less experienced laboratories, the measurement uncertainty might be higher.
- Analytical artefacts (see Section 3.2.3.3) may have led to an under‐ or overestimation of the content of Δ^8^‐THC in the samples. The extent of these effects cannot be quantified.
- Reported LOQs ranged from 2 to 10,000 μg/kg, depending on the analytical method and food category. While the higher LOQ values are most likely related to older samples when the analysis of cannabinoids in food was not yet well established, these high LOQs may have an important impact on the UB estimates for some food categories.
- Despite data underwent thorough validation and cleaning, there is still a possibility of undetected reporting errors.
- While 25 samples explicitly reported the addition of CBN/CBD extracts, it cannot be excluded that such extracts were also added to other food samples.
- The high percentage of left‐censored data combined with some relatively high LOQs has resulted in a large difference between LB and UB estimates for some food categories. While this is of minor relevance for categories where occurrence of Δ^8^‐THC is not expected, such large differences were also observed in some main categories, i.e. hemp seed oils and food supplements.
Further details on the uncertainties evaluated for the occurrence data can be found in Table D.1. in Appendix D.
Uncertainty quantification
3.3.4
Two uncertainties impacting the final conclusions were identified (See Section 3.3.2.1 and Appendix D).
The key source of uncertainty considered sufficient to influence the overall analysis was that the conclusion on the relative potency factor was primarily based on a single study. The quantitative analysis of data from this study provided statistical differences with narrow confidence intervals for the estimated relative potency between Δ^9^‐THC and Δ^8^‐THC, i.e. across measured effects (DAT, DRUID, DSST, PASAT and heart rate) with the 5th and 95th confidence limits ranging from 0.97 to 1.63. Based on this analysis, it is thus very likely (90%–95%) that the relative potency of Δ^9^‐THC compared to Δ^8^‐THC is in the range of 1–1.6. As a result, the approach of using a RPF of 1 for Δ^8^‐THC is regarded to be conservative, but not overly conservative.
Due to lack of appropriate studies to assess other effects relevant for the hazard characterisation such as endocrine effects, quantification of this second major uncertainty is not possible. The uncertainty needs to be addressed taking into consideration an updated assessment of Δ^9^‐THC.
CONCLUSIONS
4
General
- Δ^8^‐THC is naturally formed by isomerisation from the thermodynamically less stable Δ^9^‐THC. In the hemp plant, Δ^9^‐THC is formed by a biosynthetic pathway leading to Δ^9^‐tetrahydrocannabinolic acid (Δ^9^‐THCA), which subsequently undergoes non‐enzymatic (abiotic) decarboxylation.
- Δ^8^‐THC formed from natural Δ^9^‐THC by isomerisation yields the (−) trans Δ^8^‐THC isomer. No cis Δ^8^‐THC has been reported in natural hemp, although both the trans and cis isomers of Δ^9^‐THC have been identified in natural hemp.
Hazard identification and characterisation
ADME
In experimental animals
- While a large data set is available for Δ^9^‐THC, there is scant information on Δ^8^‐THC ADME in experimental animals and for the studies available, the large majority used non‐oral routes of administration.
- Upon oral exposure Δ^8^‐THC is rapidly absorbed and distributed to a limited extent to the brain; after parenteral exposure relatively high concentrations are detected in the bile and fat.
- In liver, Δ^8^‐THC undergoes a series of CYP‐mediated oxidations yielding 11‐OH‐Δ^8^‐THC, 11‐oxo‐Δ^8^‐THC and 11‐nor‐9‐carboxy‐Δ^8^‐THC. The relative potency in inducing cataleptogenic effects was in the order 11‐OH‐Δ^8^‐THC > > 11‐oxo‐Δ^8^‐THC ~ Δ^8^‐THC > 11‐nor‐9‐carboxy‐Δ^8^‐THC. There is evidence of the in vitro/in vivo glucuronidation of Δ^8^‐THC and of its oxidised metabolites.
- Conjugated derivatives are excreted via the urinary and biliary routes, although no qualitative or quantitative information is available. Contrary to Δ^9^‐THC, no data on the mammary excretion of Δ^8^‐THC and its metabolites could be retrieved in experimental or food‐producing animals.
- No major differences in ADME between Δ^8^‐THC and Δ^9^‐THC have been reported after oral exposure; the cataleptogenic potency of the Δ^9^‐THC oxidised metabolites ranks the same order of their counterparts derived from Δ^8^‐THC.
- Δ8‐THC and Δ9‐THC cross the placenta.
In humans
- In a clinical study, where Δ^8^‐THC was orally administered to 19 healthy volunteers, the T max ranged from 2.4 to 2.8 h, suggesting a rapid oral absorption.
- There are no data regarding the distribution of Δ^8^‐THC.
- Δ^8^‐THC is metabolised into 11‐OH‐Δ^8^‐THC which is subsequently metabolised to 11‐nor‐9‐carboxy‐Δ^8^‐THC. Two other metabolites (7α‐OH‐Δ^8^‐THC and 7β‐OH‐Δ^8^‐THC) have been detected but the information on their pharmacological activity is lacking.
- There are no studies on the excretion of Δ^8^‐THC.
- After oral exposure, Δ^8^‐THC and Δ^9^‐THC are rapidly absorbed with oral bioavailabilities of 9% and 6%, respectively.
- Similar to Δ^9^‐THC, Δ^8^‐THC is metabolised by the CYP2C9 and converted to an active metabolite, the 11‐OH‐THC metabolite. The 11‐OH‐THC is further oxidised to an intermediate aldehyde metabolite (11‐oxo‐THC), which is transformed by oxidation into 11‐nor‐9‐carboxy‐THC (inactive molecule) by an aldehyde oxidase.
Toxicity in experimental animals
- The existing oral rodent studies on acute toxicity show that Δ^8^‐THC and Δ^9^‐THC exhibit LD50 values of the same magnitude, with females being more sensitive than males. Results obtained in Beagle dogs and Rhesus monkeys after oral administration show a tendency to a lower potency of Δ^8^‐THC compared to Δ^9^‐THC. Single oral doses of Δ^8^‐THC or Δ^9^‐THC were non‐lethal up to a dose of 3000 mg/kg bw in Beagle dogs and up to 9000 mg/kg bw in Rhesus monkeys.
- Single oral doses of Δ^8^‐THC induce CNS effects and behavioural changes indicative of depression in mice, rats (hypothermia, bradypnoea, rapid weight loss, inactivity, wide stance, ataxia, muscle tremors and prostration), Beagle dogs (drowsiness, ataxia, prostration, anaesthesia, tremors, mild hypothermia, salivation, emesis and anorexia) and Rhesus monkeys (initial hyperreactivity to stimuli, and in a second‐phase lethargy, drowsiness, characteristic crouched posture and abnormal eating procedures) as well as endocrine effects in one i.p. study (ovulation disruption). Similar effects have also been shown for Δ^9^‐THC.
- In neurotoxicity studies, cannabimimetic effects, anxiogenic effects and psychoactivity, pain tolerance as well as behavioural and somatic signs of physical dependence were observed for Δ^8^‐THC and Δ^9^‐THC. Δ^8^‐THC produced Δ^9^‐THC‐like discriminative stimulus effect in both males and females, suggesting a qualitatively similar psychoactive outcome. However, Δ^8^‐THC demonstrated greater potency in females compared to males.
- Existing oral acute animal studies show that both Δ^8^‐THC and Δ^9^‐THC exhibit in general effects on the CNS with a tendency to a lower potency of Δ^8^‐THC compared to Δ^9^‐THC. However, the available data after oral administration do not allow a quantitative evaluation of possible differences.
- From repeated dose rodent studies with oral or i.p. administration, there is evidence that Δ^8^‐THC shows Δ^9^‐THC‐like effects. A subchronic oral study in rats showed for both, Δ^8^‐THC and Δ^9^‐THC, a first short phase of CNS depression followed by a continuous phase of hyperactivity.
- Adverse effects were also observed in the reproductive system in two studies with limitations including stromal degeneration of the ovaries induced by Δ^8^‐THC and interference with male pubertal growth by Δ^8^‐THC and Δ^9^‐THC in developing male rats.
Genotoxicity
- Standard genotoxicity tests that would allow to assess the potential of Δ^8^‐THC for inducing gene mutations or structural or numerical chromosomal aberrations are not available.
- Based on read‐across from existing data on Δ9‐THC, for which the available evidence indicates it is not genotoxic in vivo (EFSA CONTAM Panel, 2015), Δ8‐THC is also not considered to be genotoxic in vivo. QSAR analysis supports the read‐across hypothesis between Δ^8^‐THC and Δ^9^‐THC. The analysis only considered QSAR predictions with good reliability. These are available for Ames test and indicate negative results.
Human pharmacological and toxicological data
- Case reports of intoxications caused by the consumption of unregulated Δ^8^‐THC products, which include food‐like products such as gummies that resemble popular sweets, have shown serious adverse effects, especially in children. Symptoms like bradypnoea, lethargy and unresponsiveness have been observed in patients positively screened for THC in plasma or urine.
- Clinical studies involving oral administration of Δ^8^‐THC in doses ranging from 10 to 75 mg have demonstrated psychotropic, psychomotor and cognitive effects along with physiological responses such as increased heart rate and enhanced airway conductance.
- No appropriate studies in the low‐dose range (< 10 mg/person) were available to identify a reference point for Δ^8^‐THC. However, an acute oral clinical study allowed a direct comparison of the potencies of Δ^8^‐THC and Δ^9^‐THC and the derivation of a relative potency factor.
Mode of action
- The effects of Δ^8^‐THC are likely mediated by its activity as agonist for CB1 and CB2 receptors, both at CNS level and autonomic nervous system level, similar to Δ^9^‐THC.
Hazard characterisation
- For Δ^8^‐THC, the cognitive and psychomotor effects observed in human clinical studies, as well as the increase of heart rate, are considered the critical effects.
- Given the similarity in the effects between Δ^8^‐THC and Δ^9^‐THC and the mode of action of the two substances, the Panel considers that human data can be used to inform on the relative potency of Δ^8^‐THC compared to Δ^9^‐THC.
- From one clinical study, the CONTAM panel compared cognitive/psychomotor (in DAT, DRUID, DSST, PASAT) and heart rate performances for Δ^8^‐and Δ^9^ THC at the dose of 20 mg administrated in 19 healthy human volunteers. Based on this comparison, the CONTAM Panel considered that Δ^8^‐THC is equally or slightly less potent than Δ^9^‐THC (ratio Δ^9^‐THC/Δ^8^‐THC is 1.0–1.6). Using a conservative approach, the Panel set a relative potency factor of one for Δ^8^‐THC.
- In this Opinion, no new evaluation of Δ^9^‐THC was performed. An ARfD of 1 μg Δ^9^‐THC/kg bw has been previously set by CONTAM Panel (EFSA CONTAM Panel, 2015). Given the similarity in the effects and mode of action between Δ^8^‐THC and Δ^9^‐THC, the ARfD derived for Δ^9^‐THC can be considered applicable as a group ARfD for both compounds.
Methods of analysis
- Suitable analytical methods are available allowing the simultaneous determination of several cannabinoids, including Δ^8−^THC and meeting the performance criteria laid down in Commission implementing regulation (EU) 2023/2783 (EC, 2023b).
- The majority of samples (70%) were analysed using LC‐MS‐based methods, while 25% were analysed with GC‐MS‐based methods.
Occurrence
- A data set of 1671 samples/analytical results for Δ^8^‐THC, obtained using different analytical methods was available.
- The occurrence data on Δ^8^‐THC covered 18 FoodEx2 (Level 1) food categories with the majority of samples being left‐censored (93%). For hemp infusion leaves, hemp seed oil and hemp seeds, 96%–99% were left censored.
- For the majority of positive samples in all food categories, the content of Δ^8^‐THC was low. The highest value (P95) was reported for ‘Sugar and similar, confectionery and water‐based sweet desserts’ with 39,100 μg/kg (LB=UB), followed by ‘Products for non‐standard diets, food imitates and food supplements’ with 24,000–75,000 μg/kg (LB–UB) and by ‘Grains and grain‐based products’ with 350–1000 μg/kg (LB–UB).
Co‐occurrence with other cannabinoids
- To gain additional insights concerning the origin of Δ^8^‐THC, co‐occurrence data were extracted for the other cannabinoids CBD (1086 results) and Δ^9^‐THC (1145 results). These additional results pertained to the same samples analysed for Δ^8^‐THC; however, for co‐occurrence data, the Panel focused on a subset of samples that were analysed using the more reliable LC‐MS based methods.
- While Δ^9^‐THC was present in most samples, Δ^8^‐THC was detected only in few samples. In 96 samples out of 1145, both substances were detected jointly.
- The Δ^8^/Δ^9^ ratio was very variable and ranged from 0.009 up to 17.7, with an average of 1.37 and a standard deviation of 2.28.
- In literature, all samples containing Δ^8^‐THC from natural origin had a Δ^8^/Δ^9^ ratio below 1, whereas in the EFSA database, many of the samples positive for Δ^8^‐THC had a Δ^8^/Δ^9^ ratio above 1. This indicates either addition of semi‐synthetic Δ^8^‐THC, formation during processing or enrichment of natural Δ^8^‐THC.
Uncertainty analysis
- Based on quantitative analysis of data from Zamarripa et al. (2025), the relative potency of Δ^9^‐THC compared to Δ^8^‐THC is very likely (certainty 90–95%) within the range of 1 to 1.6.
RECOMMENDATIONS
5
- According to relevant information from a preliminary screening of the new literature on Δ^9^‐THC, since 2015, data suggest that a further risk assessment of Δ^9^‐THC is needed. The Panel recommends to update the evaluation of genotoxicity and of the mechanism of action as well as of dose–effect relationships especially for the low‐dose range in human and experimental animal studies, and endpoints investigated in developmental and reproductive toxicology studies.
- Further studies on the transfer rate of Δ^8^‐THC, and its metabolites, into animal products intended for human consumption are needed, after confirming the actual presence of Δ^8^‐THC in hemp feed materials.
- Monitoring/data evaluation of food samples should be performed using suitable and validated analytical methods for Δ^8^‐THC.
- Investigations into the formation of Δ^8^‐THC from naturally present cannabinoids during food processing and storage should be carried out to give more insights into the source of Δ^8^‐THC in food.
DOCUMENTATION AS PROVIDED TO EFSA
6
2204 PD Master Sheet (Oral). April 2025. Submitted by Professor Ryan Vandrey.
ABBREVIATIONSAchAcetylcholineARfDAcute reference doseAUCArea under the curvebwBody weightBMDL10Lower confidence limit of benchmark dose causing 10% effectCB1Central type‐1 cannabinoid receptorCB2Central type‐2 cannabinoid receptorCBDCannabidiolCBDACannabidiolic acidCBGACannabigerolic acidCBNCannabinolCBNACannabinoic acidCIConfidence intervalCLConfidence limit C max Maximum concentrationCMECrude marihuana extractCNR1Cannabinoid receptor gene 1CNR2Cannabinoid receptor gene 2CNSCentral nervous systemCONTAMEFSA Scientific Panel on Contaminants in the Food ChainCYPCytochrome P450DATDivided Attention TaskDHTDihydrotestosteroneDMDry matterDRUIDDRiving Under the Influence of DrugsED50Effective dose 50%ESREar‐scratch responseFAERSUS Drug Administration Adverse Event Reporting SystemFDAUS Food and Drug AdministrationFEEDAPEFSA's Panel on Additives and Products or Substances used in Animal FeedFSHFollicle stimulating hormoneGCGas chromatographyGC‐FIDGas Chromatography with Flame Ionisation DetectionHBGVHealth Based Guidance ValueHPLCHigh performance liquid chromatographyHRHeart rateHTRHead‐twitch responsei.m.Intramusculari.p.Intraperitoneali.v.IntravenousKiAffinityLBLower boundLC‐MSLiquid chromatography coupled to mass spectrometryLC‐MS/MSQuadrupole mass spectrometers operating in tandem modeLD50Lethal dose 50%LHLuteinising hormoneLH‐RHLuteinising hormone‐releasing hormoneLOAELLowest observed adverse effect levelLODLimit of detectionLOELLowest observed effect levelLOQLimit of quantificationMESMaximal electroshock seizuremm HgMillimetre of mercuryMSMass spectrometry n Sample size per group N Total sample sizeNANoradrenalineNDNot determinedNONitric oxideNOAELNo observed adverse effect levelNPDSAmerican National Poison Data SystemNTPUS National Toxicology ProgramPPercentilePASATPaced Auditory Serial Addition TaskP‐gpP‐glycoproteinPMTDIProvisional maximum tolerable daily intakePNDPostnatal dayQSARQuantitative Structure–Activity Relationships.c.SubcutaneousSgawSpecific airway conductanceSOPStandard Operational ProcedureT 1/2Half lifeTHCTetrahydrocannabinolTHCATetrahydrocannabinolic acidTLCThin layer chromatography T max Time to reach maximum concentrationUBUpper boundUGTUridin‐diphospho‐glucuronyltransferaseUNUnited Nationsw/wWeight per weight
REQUESTOR
European Commission
QUESTION NUMBER
EFSA‐Q‐2024‐00200
COPYRIGHT FOR NON‐EFSA CONTENT
EFSA may include images or other content for which it does not hold copyright. In such cases, EFSA indicates the copyright holder and users should seek permission to reproduce the content from the original source.
PANEL MEMBERS
Helle Katrine Knutsen, Agneta Åkesson, Vasileios Bampidis, Margherita Bignami, Laurent Bodin, James Kevin Chipman, Gisela Degen, Antonio Hernández‐Jerez, Tim Hofer, Christer Hogstrand, Stefano Landi, Jean‐Charles Leblanc, Kyriaki Machera, Evangelia Ntzani, Isabelle Oswald, Guido Rychen, Salomon Sand, Katharina Vejdovszky, and Barbara Viviani.
Supporting information
Annex A: Protocol for the assessment
Annex B: Literature search and selection for relevance of studies related to Δ8 ‐Tetrahydrocannabinol (Δ^8^‐THC) in food
Annex E: Outcome of the Public Consultation
The reference list from the paper itself. Each links out to its DOI / PubMed record.
- 1Abdel‐Kader, M. S. , Radwan, M. M. , Metwaly, A. M. , Eissa, I. H. , Hazekamp, A. , & El Sohly, M. A. (2024). Chemistry and pharmacology of delta‐8‐tetrahydrocannabinol. Molecules, 29(6), 1249. 10.3390/molecules 29061249 38542886 PMC 10976172 · doi ↗ · pubmed ↗
- 2Abrahamov, A. , Abrahamov, A. , & Mechoulam, R. (1995). An efficient new cannabinoid antiemetic in pediatric oncology. Life Sciences, 56, 2097–2102. 10.1016/0024-3205(95)00194-b 7776837 · doi ↗ · pubmed ↗
- 3Agurell, S. , Edward, C. , Halldin, M. , Leander, K. , Levy, S. , Lindgren, J. E. , Mechoulam, R. , Noreqvist, M. , & Ohlsson, A. (1979). Chemical synthesis and biological occurrence of carboxylic acid metabolites of Δ1(6)‐tetrahydrocannabinol. Drug Metabolism and Disposition, 7(3), 155–161.38086 · pubmed ↗
- 4Agurell, S. , Nilsson, I. M. , Nilsson, J. L. G. , Ohlsson, A. , Widman, M. , & Leander, K. (1971). Metabolism of 7‐hydroxy‐Δ1(6)‐THC and CBN. Symposium on Cannabis, 698–699.
- 5Akpunonu, P. , Baum, R. A. , Reckers, A. , Davidson, B. , Ellison, R. , Riley, M. , Trecki, J. , & Gerona, R. (2021). Sedation and acute encephalopathy in a pediatric patient following ingestion of Delta‐8‐tetrahydrocannabinol gummies. The American Journal of Case Reports, 22, e 933488. 10.12659/AJCR.933488 34762615 PMC 8594112 · doi ↗ · pubmed ↗
- 6Askew, W. E. , Kimball, A. P. , & Ho, B. T. (1974). Effect of tetrahydrocannabinols on brain acetylcholine. Brain Research, 69(2), 375–378. 10.1016/0006-8993(74)90018-3 4823100 · doi ↗ · pubmed ↗
- 7Avraham, Y. , Ben‐Shushan, D. , Breuer, A. , Zolotarev, O. , Okon, A. , Fink, N. , Katz, V. , & Berry, E. M. (2004). Very low doses of Δ8‐THC increase food consumption and alter neurotransmitter levels following weight loss. Pharmacology, Biochemistry, and Behavior, 77(4), 675–684. 10.1016/j.pbb.2004.01.015 15099912 · doi ↗ · pubmed ↗
- 8Babalonis, S. , Raup‐Konsavage, W. M. , Akpunonu, P. D. , Balla, A. , & Vrana, K. E. (2021). Δ8‐THC: Legal status, widespread availability, and safety concerns. Cannabis and Cannabinoid Research, 6(5), 362–365. 10.1089/can.2021.0097 34662224 PMC 8664123 · doi ↗ · pubmed ↗