Comparison of Fibrillin-1 and Fibrillin-2 Gene Expression Level in Esophageal Squamous Cell Carcinoma Tumor Tissue and Tumor Margin Tissue
Mahsa Mahdizadeh, Marie Saghaeian Jazi, Seyyed Mostafa Mir, Seyyed Mehdi Jafari

TL;DR
This study compares the expression of FBN1 and FBN2 genes in esophageal cancer tissue and normal tissue, finding significant differences that suggest these genes could be therapeutic targets.
Contribution
The novel contribution is identifying FBN1 and FBN2 as potential therapeutic targets in esophageal squamous cell carcinoma based on their differential gene expression.
Findings
FBN1 gene expression decreased significantly in tumor tissue compared to normal tissue (fold change=0.5472±0.149, P=0.007).
FBN2 gene expression increased significantly in tumor tissue compared to normal tissue (fold change=7.341±1.299, P<0.0001).
No significant association was found between FBN1 and FBN2 gene expression and clinicopathological features.
Abstract
Esophageal cancer is one of the most devastating cancers of the gastrointestinal tract. We will compare the expression levels of fibrillin-1 (FBN1) and fibrillin-2 (FBN2), a family of extracellular matrix glycoproteins, in esophageal cancer with normal adjacent tumor tissue. In this cross-sectional study, 22 esophageal squamous cell carcinoma (ESCC) tumor samples and their matched adjacent normal tissues were collected from hospitals in Gorgan City (Golestan, Iran) between 2020 and 2022. After RNA extraction and cDNA synthesis, we measured the semi-quantitative gene expression level using real-time polymerase chain reaction (PCR). Data from this study were analyzed using SPSS software (version 18), and results were considered statistically significant when the P was <0.05. The primary statistical analyses used in this study were the Paired Samples t test and the Wilcoxon signed-rank…
Genes, proteins, chemicals, diseases, species, mutations and cell lines named across the full text — each resolved to its canonical identifier and authoritative record.
Click any figure to enlarge with its caption.
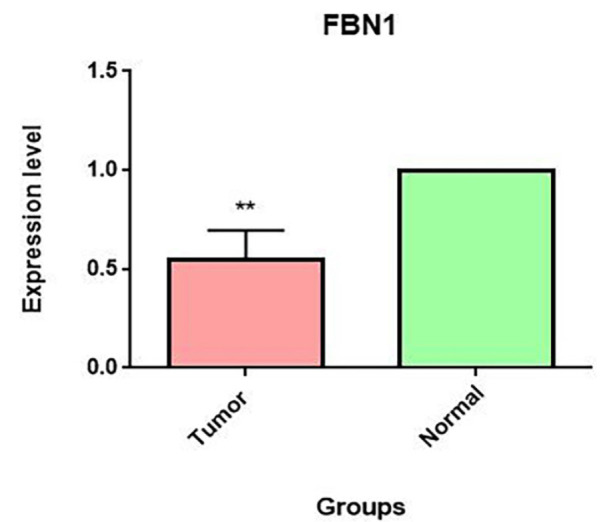 Figure 1
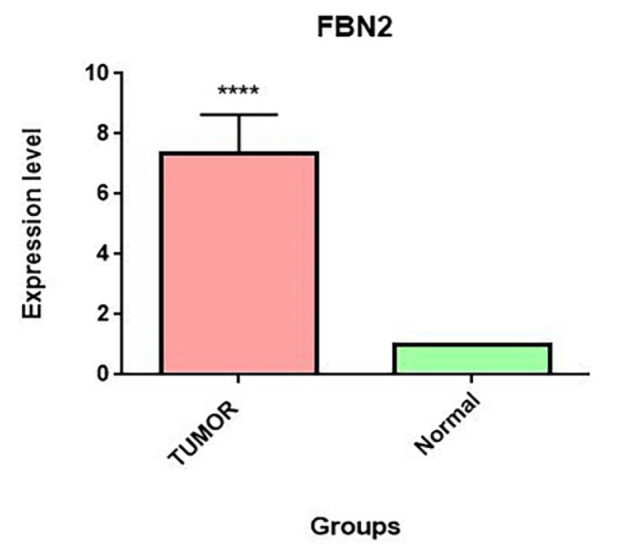 Figure 2
| Genes | Forward | Reverse |
|---|---|---|
|
| TTTAGCGTCCTACACGAGCC | CCATCCAGGGCAACAGTAAGC |
|
| CCTCCCGCCCTCTCTCTTG | ACAAAAGTCGCCCCCAGAAG |
|
| GGAGCGAGATCCCTCCAAAAT | GGCTGTTGTCATACTTCTCATGG |
| Histopathology | Well differentiated | 48.27 % |
| Moderately differentiated | 24.13 % | |
| Poorly differentiated | 27.58 % | |
| Sex (n, %) | Men | 54.54 % |
| Women | 45.45 % | |
| Age (year, mean±SD) | Men | 67.80±13.41 |
| Women | 69.58±9.64 | |
| BMI (Kg/m2, mean±SD) | 21.95±2.84 | |
| Tumor Size (cm, mean±SD) | 5.45±1.5 | |
| Group | Tumor | Normal | P value | ||
|---|---|---|---|---|---|
| Variable | Mean±SD | Median (IQR) | Mean±SD | Median (IQR) | |
|
| 34.034±42.17 | 19.760 (9.354-40.599) | 74.726±161.04 | 17.468 (4.319-62.741) | 0.014 |
|
| 7.010±15.00 | 1.776 (0.803-5.412) | 2.038±2.14 | 1.354 (0.550-3.083) | 0.235 |
|
| 0.775±2.10 | 0.099 (0.022-0.363) | 0.237±0.59 | 0.017 (0.010-0.058) | 0.360 |
| Group | Tumor | Normal | P value | ||
|---|---|---|---|---|---|
| Variable | Mean±SD | Median (IQR) | Mean±SD | Median (IQR) | |
|
| 8.404±1.735 | 8.562 (7.451-9.594) | 10.226±1.536 | 10.007 (9.236-11.358) | <0.0001 |
|
| 6.357±1.810 | 6.011 (4.954-7.609) | 6.440±2.508 | 5.947 (4.440-8.036) | 0.877 |
Peer Reviews
No public reviews on file for this paper yet. If you reviewed it on a platform where reviews are public (OpenReview, ICLR, NeurIPS, ICML), you can paste yours below so the community can read it here.
Videos
No videos yet. Explain this paper in a talk, walkthrough, or lecture? Add one.
Taxonomy
TopicsConnective tissue disorders research · Blood properties and coagulation · Protease and Inhibitor Mechanisms
What’s Known
- In previous studies, changes in fibrillin-1 or fibrillin-2 have been examined separately in cancers such as pancreatic ductal adenocarcinoma and lung cancer.
What’s New
- For the first time, we compared changes in fibrillin-1 and fibrillin-2 expression in esophageal cancer tissue with normal tissue.
- We also reported the expression of fibrillins in the Genotype-Tissue Expression database and the GENT2 dataset tool.
- Our results showed that changes in the expression of fibrillin-1 and fibrillin-2 lead to changes in the extracellular matrix of esophageal cancer tissue compared to normal tissue.
Introduction
Esophageal cancer is one of the most common cancers of the digestive tract and one of the most common aggressive tumors globally. ^ 1 ^ This cancer is the eighth most common worldwide and the sixth leading cause of cancer-related death. It has a poor prognosis, with a five-year survival rate of approximately 15-20%. ^ 1 , 2 ^ Due to the lack of early clinical manifestations, esophageal cancer is typically diagnosed at advanced stages. ^ 3 , 4 ^ Esophageal cancer divides into two subtypes in terms of histology: esophageal squamous cell carcinoma (ESCC), which originates from the stratified squamous epithelial lining of the esophagus (approximately 90 %), and esophageal adenocarcinoma (EAC), which involves columnar epithelial cells that replace the squamous epithelium (about 10 %). ^ 2 , 4 , 5 ^ Of these two types of esophageal cancers, ESCC is the dominant tissue subtype and is also known as one of the most aggressive cancers worldwide. ^ 4 , 5 ^
Studies have shown that tumorigenesis is generally associated with changes in the composition of the extracellular matrix (ECM). Human fibrillins (FBNs) are large cysteine-rich glycoproteins and the main component of fibrous structures in the ECM that multimerize to form microfibrils. Microfibrils in the ECM have mechanical functions and are effective in cell adhesion. These microfibrils are macromolecular complexes that are components of elastic fibers (a vital part of the ECM) and even components of non-elastic tissues. ^ 6
- 9 ^ In elastic fiber assembly, microfibrils are the first structures formed, and FBNs play the role of a scaffold for tropoelastin deposition. ^ 9 ^
Within the microfibril structure, the FBNs interact with different components of microfibrils, for example, with microfibril-associated glycoprotein (MAGP)-1 and 2, fibulins, and the latent transforming growth factor-β-binding proteins (LTBPs) 1, 2, and 4. ^ 9
- 11 ^ There are three FBN isoforms in humans, each encoded by a different gene: fibrillin-1 (FBN1), fibrillin-2 (FBN2), and fibrillin-3 (FBN3). ^ 12 ^ All three glycoproteins are 320 to 350 kDa, ^ 10 , 12 ^ and at the amino acid level, these three isoforms are homologous ^ 6 ^ but show slight differences; for example, FBN1 has a proline-rich part, FBN2 has a glycine-rich part, and FBN3 has a proline and glycine-rich part. ^ 9 ^ The members of this superfamily also undergo post-translational modifications. FBN1 has 14 glycosylation sites, FBN2 has 12, and FBN3 has 10. ^ 9 ^
The human FBN1 gene is located in 15q15–21.3 and is one of the main components of 10–12 nm ECM microfibrils with structural roles and is involved in creating the tensile strength of the ECM. ^ 5 , 10 , 12 ^ FBN1 plays a role in regulating the tissue microenvironment. ^ 13 ^ FBN1 is also involved in endothelial cell adhesion, and its expression is high in most cells of mesenchymal origin. ^ 9 ^ Mutations in the FBN1 coding gene lead to a rare autosomal dominant and hereditary disease called Marfan syndrome, in which the skin, nervous system, heart and blood vessels, eyes, and skeletal muscles are affected. Mutations in this gene also affect growth factors such as Transforming Growth Factor Beta (TGF-β) and increase the expression and activation of TGF-β. ^ 14 , 15 ^ Altered FBN1 expression levels have been reported in various cancers, including thyroid, colorectal, ovarian, pancreatic ductal adenocarcinoma (PDAC), and esophageal cancers. ^ 5 , 16 , 17 ^
The human FBN2 gene is located in 5q23 31 and is expressed in the early stages of development (during embryogenesis). ^ 5 , 12 ^ Its expression is more limited in mesenchymal cells after birth. ^ 5 ^ However, FBN2 also has roles after birth; it forms the central core of microfibrils, which are covered by an outer layer of FBN1. ^ 5 , 7 ^ FBN2 plays a vital role in the formation and accumulation of elastic fibers and fibronectin around tracheal smooth muscle cells. ^ 18 ^ Congenital contractile arachnodactyly is a rare autosomal dominant hereditary connective tissue disease resulting from a mutation in the FBN2 gene. ^ 19 ^ Alterations in FBN2 expression levels have been observed in several cancers; for instance, its increased expression has been reported in lung and colorectal cancers. ^ 5 , 20 ^ The expression of FBN3 decreases after birth, and unlike FBN1 and FBN2, FBN3 has a high expression in the brain, as observed in a human fetal brain library. ^ 19 , 21 ^
Considering the structural role of FBNs in microfibrils and their presence in elastic and non-elastic tissues, these genes have been investigated in several cancers. For example, the role of FBN1 and FBN2 has been studied separately in different cancers, including significant expression of FBN1 in thyroid cancer. ^ 5 ^ The association between FBN1 and the infiltration of immune cells in PDAC, ^ 17 ^ increased expression of FBN2 in lung cancer. ^ 20 ^ The association between FBN1 and metastasis in ovarian cancer, ^ 16 ^ and changes in the expression level of FBNs in colorectal cancer. ^ 22
- 24 ^ Due to conflicting findings regarding FBNs expression in various cancers and the absence of prior reports on their expression in ESCC, this study aims to evaluate FBN1 and FBN2 expression in ESCC.
Materials and Methods
Sample Collection
In this cross-sectional study, we collected tumor tissue samples and tumor margins from 22 patients with ESCC who had visited hospitals in Golestan province, Iran, from 2020 to 2022. The sample size was estimated according to a pilot study of 10 samples with a mean fold change±SD of 0.5767±0.7718 for FBN1 and 8.35±7.1338 for FBN2 compared to a constant value of 1 for the normal group. Using the GPower 3.1 software (Edgar Erdfelder, Franz Faul, Albert-Georg Lang, and Axel Buchner; Germany), with a power of 0.8 and α error probability equal to 0.05, the maximum sample size was calculated at 22. Physicians diagnosed the necessity for surgery for all patients. Inclusion criteria consisted of newly diagnosed ESCC cases with no prior chemotherapy or radiotherapy treatment. Oral and written informed consent were obtained from all participants. After surgery, we collected tumor samples and paired tumor-adjacent normal tissue biopsies (approximately 5 cm from the tumor site) and checked them regarding histopathology. The collected specimens were transferred to Gorgan University of Medical Sciences with dry ice and were kept at -80 °C. The ethics code of this research is IR.GOUMS.REC.1400.438, approved by the ethics committee of Golestan University of Medical Sciences.
Gene Expression Analysis
We extracted total RNA from each sample using TRIzol Reagent (Invitrogen, CA), dissolved it in DEPC-treated water, and then treated it with DNase I (Thermo Fisher Scientific, Inc., United States). The RNA concentration and purity were determined using the A260/A280 ratio in NanoDrop technologies. After that, cDNA synthesis from the RNA was performed according to the protocol of the synthesis kit of Yekta Tajhiz Company (Iran) using reverse transcriptase (M-MULV) from RNA.
The primer sequences used for FBN1, FBN2, and glyceraldehyde-3-phosphate dehydrogenase (GAPDH) genes are presented in table 1. We used GAPDH for all samples as an internal control an gene expression normalization with a 2^-ΔΔct^ formula.
Then, we performed real-time polymerase chain reaction (RT-PCR) using Real Q Plus 2x master mix Green, High Rox (AMPLIQON, Denmark) in the ABI system 7300. We carried out the PCR reaction in a 10 μL reaction mixture consisting of 5 μL of 2x master mix AMPLIQON, 3 μL of water, 0.5 μL of each 10 μM primer, and 1 μL of the cDNA. Reactions were started by initial denaturation for 15 min at 95 °C; then for 40 cycles of denaturation at 95 °C for 10 sec, and subsequent annealing for 30 sec at 61 °C and extension at 72 °C for 40 sec was done, and in the last stage, we did melt carve analyzes for the assurance. We replicated real-time PCR analysis twice and used the average threshold cycles (CT) obtained for fold change calculations. To calculate fold changes for the FBN1 and FBN2 genes, ΔCT was calculated for each patient’s tumor and adjacent normal tissue using the formula: CT (FBN gene)- CT (GAPDH gene)=ΔCT. In the second step, we calculated CT for each patient: ΔCT (Tumor)-ΔCT (Tumor Margin)= ΔΔCT. In the last step, we calculated the fold change using the following formula for each patient: fold change=2^-ΔΔCT^.
Statistical Analysis
We assessed the current study data with SPSS software Version 18 (International Business Machines Corporation; United States) and analyzed differences between the two groups using the Paired Samples t test and the Wilcoxon signed-rank test. We used Pearson’s correlation coefficient to check the correlation of variables. We considered results statistically significant when the P<0.05.
Results
Patient Information
Patient information, including sex, mean age, mean body mass index (BMI), mean tumor size, and histopathology (well differentiated, moderately differentiated, and poorly differentiated), is listed in table 2.
Validation of the FBN1, FBN2, and FBN3 Gene Expression in OncoDB
To select the FBN genes to measure in esophageal samples, we first evaluated the mRNA expression of FBN1, FBN2, and FBN3 in 184 esophageal cancer tissue samples and 13 normal esophageal tissue samples using the OncoDB (OncoDB is an online database resource at http://oncodb.org). We reported the results as mean and median (IQR) in table 3.
FBN1 had the highest mean gene expression level in normal and esophageal cancer tissue. As reported in table 3, the expression level of FBN3 in normal esophageal tissue and esophageal cancer tissue was lower than the other two genes. Consequently, due to the low expression of FBN3 in normal esophageal tissue and esophageal cancer tissue, FBN1 and FBN2 were selected for evaluation in ESCC patients by RT-PCR in the current study.
GENT2 Database
We retrieved the microarray data for FBN1 and FBN2 from the GENT2 dataset tool (GPL570 platform HG-U133_Plus_2 [Korea Research Institute of Bioscience and Biotechnology, South Korea]) for tumor and normal tissues in the esophagus (http://gent2.appex.kr/gent2/). We analyzed the gene expression of 236 esophageal tumor tissue samples compared to 24 control groups from the microarray data available from the GENT2 database. The normalized values reported by the database were extracted and re-analyzed.
There was a significant downregulation of the FBN1 gene in tumor tissues compared to the control group. This data also indicated that the FBN2 gene in the tumor tissue was upregulated compared to the control, but the difference was not statistically significant (table 4).
The mRNA Expression of FBN1
We examined the expression level of the FBN1 gene in tumor tissue samples and tumor margin tissue samples using a RT-PCR technique. ∆CTs had a normal distribution (P=0.20), and the fold change for the FBN1 gene was equal to 0.5472±0.149. This result showed a significant decrease in FBN1 expression in esophageal cancer tumors compared to tumor margins (P=0.007) (figure 1). Regarding the tumor size and differentiation status of the ESCC tumor samples, no significant association with FBN1 gene fold change in gene expression was observed.
FBN1 gene expression was examined in tumor tissue and tumor margins in ESCC. The expression of this gene was investigated using the real-time PCR method in the tumor tissue and tumor margins of 22 people with ESCC. We used the paired samples t test, and the significance level of <0.05 was considered. FBN1 gene expression was lower in the tumor tissue than in the peripheral tissue, and the fold change was equal to 0.5472±0.149, and this decrease was statistically significant (P=0.007). FBN1: Fibrillin-1; ESCC: Esophageal squamous cell carcinoma; Real-time PCR: Real-time polymerase chain reaction
The mRNA Expression of FBN2
We examined changes in FBN2 gene expression between tumor tissue and adjacent normal tissue samples. ∆CTs did not have a normal distribution (P<0.001), and the fold change for the FBN2 gene was equal to 7.341±1.299. This result showed a significant increase in FBN2 expression in esophageal cancer tumors compared to tumor margins (P<0.0001) (figure 2).
FBN2 gene expression was examined in tumor tissue and tumor margins in ESCC. The expression of this gene was analyzed using the real-time PCR method in the tumor tissue and tumor margins of 22 people with ESCC. We used the Wilcoxon signed-rank test, and the significance level of <0.05 was considered. FBN2 gene expression was higher in the tumor tissue than in the peripheral tissue, and the fold change was equal to 7.341±1.299, and this increase was statistically significant (P<0.0001). FBN2: Fibrillin-2; ESCC: Esophageal squamous cell carcinoma; Real-time PCR: Real-time polymerase chain reaction
The Correlation of FBN1 and FBN2
To evaluate the correlation analysis of the two FBN genes, a Pearson’s correlation test was performed, and FBN1 expression level was found to be correlated with FBN2 expression level (r=0.583, P=0.036).
Discussion
In this study, for the first time, we investigated the expression level of two crucial ECM glycoproteins, FBN1 and FBN2, in tumor tissue samples and tumor margin samples of patients with ESCC. In our previous review, we highlighted the importance of FBN1 and FBN2 in various cancers. ^ 5 ^ In our study, the expression level of the FBN1 gene in the tumor tissue was lower than its expression level in the margin tissue of the tumor; this decrease in expression was statistically significant. Several studies highlight the importance of FBN1 and its association with cancer. ^ 5 , 7 , 16 , 17 ^
In ovarian cancer, increased expression of FBN1 has been introduced as a reason for the early recurrence of this cancer. The role of FBN1 in ovarian cancer metastasis has also been mentioned. ^ 5 , 16 ^
Proportionally, it can be hypothesized that FBN1-expressing tumor cells can use FBN1 to migrate and metastasize. Increased FBN1 expression compared to normal tissue was observed in PDAC. An association between the increased expression of FBN1 in PDAC was seen with a poor prognosis. In this research, the association between FBN1 and the infiltration of immune cells into the tumor was specified. ^ 17 ^
In the study by Tseleni-Balafouta and others, FBN1 was observed to be expressed in normal thyroid tissue only in perivascular areas. In examining the neoplastic thyroid cancer tissue, FBN1 was found in the cytoplasm of neoplastic cells. Their results confirmed that FBN1 could be expressed in fibroblast and epithelial cells. ^ 25 ^ An inverse association between FBN1 expression and angiogenesis in tumors has been reported. FBN1 acts as a negative regulator of angiogenesis; its decreased expression in tumors has been linked to enhanced angiogenic activity. ^ 7 ^
We hypothesize that reduced FBN1 expression disrupts microfibril assembly in esophageal cancer. This disruption can significantly impact the tumor microenvironment. Furthermore, the altered microfibril network may affect cellular adhesion and migration, contributing to a more aggressive phenotype.
Our results also showed that FBN2 gene expression was significantly increased in ESCC tissue compared with normal tissue.
In lung cancer patients with increased expression of FBN2, survival time was reduced compared with patients without increased expression of FBN2. The results confirmed that the increased FBN2 expression could be effective in the prognosis of lung cancer. In lung cancer patients with high expression of FBN2, the survival time was shorter than in patients without high expression of FBN2. This finding indicated the importance of FBN2 in the prognosis of lung cancer. ^ 20 ^
Due to its involvement in angiogenesis, FBN2 has been proposed as a marker for tumor epithelial cells. ^ 7 ^ We hypothesize that FBN2 overexpression in ESCC plays a significant role in ECM remodeling, leading to enhanced tumor cell motility and, ultimately, poorer patient outcomes. Further research is warranted to elucidate the precise mechanisms by which FBN2 disrupts microfibril assembly and its downstream effects on ESCC progression. Understanding these mechanisms could pave the way for novel therapeutic strategies targeting the ECM in esophageal cancer.
The association between FBN1 and FBN2 expression and cancer can probably be described by the role of FBNs and microfibrils in elastin fibers and their role in the elasticity of the ECM. Moreover, the change in the expression level of FBN1 and FBN2 in esophageal cancer cells compared to normal cells can interfere with the correct formation of microfibrils. Proper microfibril assembly is essential for maintaining the structure and function of the extracellular matrix. In general, the change in the expression level of FBNs in esophageal cancer cells compared to normal cells leads to a change in the typical composition of the ECM. Additionally, our study confronted limitations that required to be considered. The research did not consider other elements, such as genetic mutations, which might affect the expression levels of FBN1 and FBN2. Meanwhile, given the established roles of the changed expression level of FBN1 and FBN2 in the destruction of the normal structure of ECM, the specific mechanism of the effect of the changed expression level of FBN1 and FBN2 on ECM remains unclear.
Conclusion
In general, the results showed that the expression of the FBN1 gene in tumor tissue was significantly decreased compared with normal tissue, and the expression of the FBN2 gene in ESCC tissue was significantly higher than in normal tissue. According to our results, we concluded that human FBN1 and FBN2 gene expression is changed in ESCC, suggesting their potential role in the pathogenesis of ESCC. Future studies should explore the interaction between FBNs and other ECM components in esophageal cancer, as well as correlations between FBN expression and patient survival. Furthermore, exploring the functional consequences of altered FBN expression on esophageal cancer cell behavior, such as proliferation, migration, and invasion, would be valuable. Specifically, in vitro and in vivo models could be utilized to elucidate the mechanisms by which FBNs influence these processes. Finally, investigating the potential of targeting FBNs as a therapeutic strategy for esophageal cancer warrants consideration, potentially through developing inhibitors or modulators of FBN expression or function.
The reference list from the paper itself. Each links out to its DOI / PubMed record.
- 1Song G Liu K Yang X Mu B Yang J He Letal SATB 1 plays an oncogenic role in esophageal cancer by up-regulation of FN 1 and PDGFRB Oncotarget 201781777184[ PMC Free Article ]10.18632/oncotarget.1484928147311 PMC 5392285 · doi ↗ · pubmed ↗
- 2Xu W Xu J Wang Z Jiang Y Weighted Gene Correlation Network Analysis Identifies Specific Functional Modules and Genes in Esophageal Cancer J Oncol 202120218223263[ PMC Free Article ]10.1155/2021/822326334987580 PMC 8723838 · doi ↗ · pubmed ↗
- 3Huang FL Yu SJ Esophageal cancer: Risk factors, genetic association, and treatment Asian J Surg 201841210510.1016/j.asjsur.2016.10.00527986415 · doi ↗ · pubmed ↗
- 4Nie Y Yao G Xu X Liu Y Yin K Lai Jetal Single-cell mapping of N 6-methyladenosine in esophageal squamous cell carcinoma and exploration of the risk model for immune infiltration Front Endocrinol (Lausanne). 2023141155009[ PMC Free Article ]10.3389/fendo.2023.115500937025404 PMC 10070687 · doi ↗ · pubmed ↗
- 5Mahdizadehi M Saghaeian Jazi M Mir SM Jafari SM Role of fibrilins in human cancer: A narrative review Health Sci Rep 20236 e 1434[ PMC Free Article ]10.1002/hsr 2.143437469709 PMC 10353528 · doi ↗ · pubmed ↗
- 6Genovesi ML Torres B Goldoni M Salvo E Cesario C Majolo Metal Case Report: A Novel Homozygous Missense Variant of FBN 3 Supporting It Is a New Candidate Gene Causative of a Bardet-Biedl Syndrome-Like Phenotype Front Genet 202213924362[ PMC Free Article ]10.3389/fgene.2022.92436235910214 PMC 9334770 · doi ↗ · pubmed ↗
- 7van Loon K Yemelyanenko-Lyalenko J Margadant C Griffioen AW Huijbers EJM Role of fibrillin-2 in the control of TGF-beta activation in tumor angiogenesis and connective tissue disorders Biochim Biophys Acta Rev Cancer 2020187318835410.1016/j.bbcan.2020.18835432119940 · doi ↗ · pubmed ↗
- 8Kumra H Reinhardt DP Fibrillins Methods Cell Biol 20181432234610.1016/bs.mcb.2017.08.01329310780 · doi ↗ · pubmed ↗