Human bite cases reported to health facilities in the Volta region of Ghana, 2019 to 2023
Chrysantus Kubio, Maxwell Afetor, Samuel Adolf Bosoka, Williams Azumah Abanga, Victor Zeng, Christopher Sunkwa Tamal, Gyesi Razak lssahaku, Clement Tetteh Narh, Frank Baiden

TL;DR
This study analyzed human bite injuries reported in Ghana's Volta region from 2019 to 2023, finding rising cases among young males.
Contribution
The study provides baseline data on human bite injuries in the Volta region, highlighting trends and demographics.
Findings
A total of 931 human bite injuries were reported from 2019 to 2023, with the highest incidence in 2021.
Males and young adults aged 18–34 made up the majority of reported cases.
Ketu North district had the highest number of human bite injuries.
Abstract
Although human bite injuries occur less frequently than other types of injuries, they present notable public health challenges, yet they have received relatively little attention. This study examined the incidence, trend, and distribution of human bite injuries in the Volta Region of Ghana from 2019 to 2023. A retrospective analysis of human bite injury data from the District Health Information Management System 2 (DHIMS-2) for the Volta Region was conducted for the period 2019 to 2023. Data on human bite injuries were obtained from the monthly outpatient (OPD) morbidity report form. Variables available and extracted were age, sex, district and year of report. The data was analyzed descriptively using Microsoft Excel and Quantum Geographic Information System (QGIS) and the findings presented in tables and graphs. A total of 931 human bite injuries were reported to health facilities…
Genes, proteins, chemicals, diseases, species, mutations and cell lines named across the full text — each resolved to its canonical identifier and authoritative record.
Click any figure to enlarge with its caption.
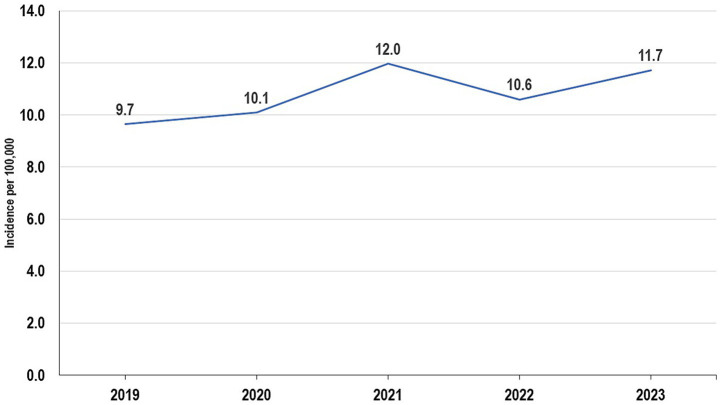 Figure 1
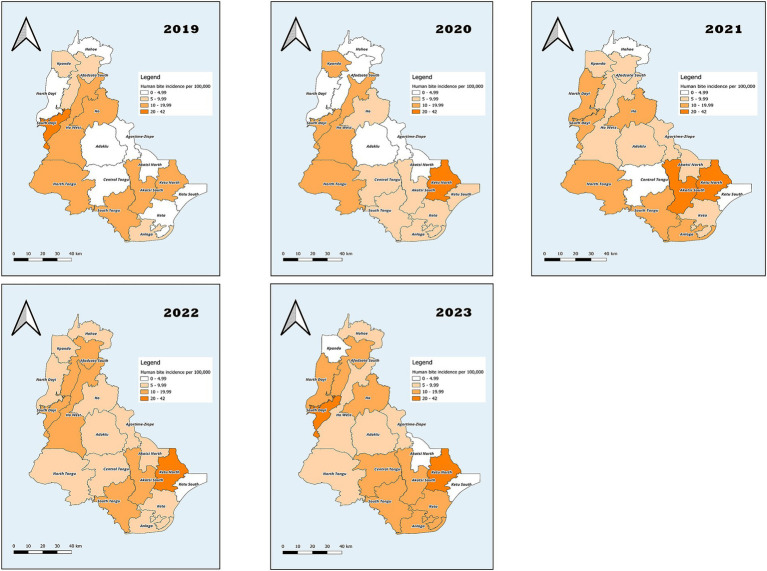 Figure 2
| District/region | 2019 annual population | 2020 annual population | 2021 annual population | 2022 annual population | 2023 annual population |
|---|---|---|---|---|---|
| Adaklu | 44,307 | 45,325 | 38,649 | 39,461 | 40,289 |
| Afadjato South | 117,258 | 119,971 | 73,146 | 74,682 | 76,250 |
| Agortime-Ziope | 35,867 | 36,031 | 39,553 | 40,384 | 41,232 |
| Akatsi North | 41,691 | 42,655 | 32,541 | 33,224 | 33,922 |
| Akatsi South | 117,263 | 119,978 | 92,494 | 94,436 | 96,420 |
| Anloga | 97,713 | 99,966 | 94,895 | 96,888 | 98,922 |
| Central Tongu | 72,971 | 74,652 | 83,803 | 85,563 | 87,360 |
| Ho | 218,948 | 223,947 | 180,420 | 184,209 | 188,077 |
| Ho West | 117,268 | 119,963 | 82,886 | 84,627 | 86,404 |
| Hohoe | 133,021 | 136,090 | 92,211 | 93,760 | 95,729 |
| Keta | 84,696 | 86,649 | 78,862 | 80,518 | 82,209 |
| Ketu North | 122,546 | 125,366 | 114,846 | 117,258 | 119,720 |
| Ketu South | 198,051 | 202,614 | 253,122 | 258,438 | 263,865 |
| Kpando | 65,140 | 66,649 | 58,552 | 59,782 | 61,037 |
| North Dayi | 49,510 | 50,503 | 39,268 | 40,093 | 40,935 |
| North Tongu | 109,454 | 111,978 | 110,891 | 113,220 | 115,597 |
| South Dayi | 57,337 | 58,666 | 57,526 | 58,734 | 59,967 |
| South Tongu | 109,442 | 111,996 | 113,114 | 115,489 | 117,915 |
|
|
|
|
|
|
|
| Variables | Population | ||||
|---|---|---|---|---|---|
| 2019 | 2020 | 2021 | 2022 | 2023 | |
| Gender | |||||
| Male | 855,014 | 874,340 | 780,743 | 796,955 | 813,690 |
| Female | 937,469 | 958,658 | 856,035 | 873,809 | 892,159 |
| Age group | |||||
| 0–4 yrs | 198,966 | 203,463 | 181,682 | 185,455 | 189,349 |
| 5–9 yrs | 213,305 | 218,127 | 194,777 | 198,821 | 202,996 |
| 10–14 yrs | 200,758 | 205,296 | 183,319 | 187,126 | 191,055 |
| 15–17 yrs | 127,266 | 130,143 | 116,211 | 118,624 | 121,115 |
| 18–19 yrs | 77,077 | 78,819 | 70,381 | 71,843 | 73,352 |
| 20–34 yrs | 408,686 | 417,924 | 373,185 | 380,934 | 388,934 |
| 35–49 yrs | 277,835 | 284,115 | 253,701 | 258,968 | 264,407 |
| 50–59 yrs | 121,889 | 124,644 | 111,301 | 113,612 | 115,998 |
| 60–69 yrs | 87,832 | 89,817 | 80,202 | 81,867 | 83,587 |
| 70 + yrs | 78,869 | 80,652 | 72,018 | 73,514 | 75,057 |
| Variables | Year | Total = 931 N (%) | ||||
|---|---|---|---|---|---|---|
| 2019 = 173 n (%) | 2020 = 185 n (%) | 2021 = 196 n (%) | 2022 = 177 n (%) | 2023 = 200 n (%) | ||
| Gender | ||||||
| Male | 106 (61.3) | 104 (56.2) | 111 (56.6) | 106 (59.9) | 114 (57.0) | 541 (58.1) |
| Female | 67 (38.7) | 81 (43.8) | 85 (43.4) | 71 (40.1) | 86 (43.0) | 390 (41.9) |
| Age group | ||||||
| 0–4 | 12 (6.9) | 7 (3.8) | 13 (6.6) | 13 (7.3) | 24 (12.0) | 69 (7.4) |
| 5–9 | 14 (8.1) | 10 (5.4) | 15 (7.7) | 10 (5.6) | 14 (7.0) | 63 (6.8) |
| 10–14 | 9 (5.2) | 12 (6.5) | 19 (9.7) | 17 (9.6) | 7 (3.5) | 64 (6.9) |
| 15–17 | 11 (6.4) | 10 (5.4) | 16 (8.2) | 15 (8.5) | 13 (6.5) | 65 (7.0) |
| 18–19 | 15 (8.7) | 12 (6.5) | 13 (6.6) | 10 (5.6) | 11 (5.5) | 61 (6.6) |
| 20–34 | 52 (30.1) | 72 (38.9) | 70 (35.7) | 58 (32.8) | 69 (34.5) | 321 (34.5) |
| 35–49 | 40 (23.1) | 34 (18.4) | 29 (14.8) | 37 (20.9) | 39 (19.5) | 179 (19.2) |
| 50–59 | 12 (6.9) | 15 (8.1) | 12 (6.1) | 10 (5.6) | 16 (8.0) | 65 (7.0) |
| 60–69 | 4 (2.3) | 9 (4.9) | 6 (3.1) | 6 (3.4) | 1 (0.5) | 26 (2.8) |
| 70+ | 4 (2.3) | 4 (2.2) | 3 (1.5) | 1 (0.6) | 6 (3.0) | 18 (1.9) |
| District | ||||||
| Adaklu | 1 (0.6) | 2 (1.1) | 3 (1.5) | 2 (1.1) | 3 (1.5) | 11 (1.2) |
| Afadjato South | 9 (5.2) | 5 (2.7) | 7 (3.6) | 13 (7.3) | 15 (7.5) | 49 (5.3) |
| Agortime-Ziope | 1 (0.6) | 1 (0.5) | 2 (1.0) | 4 (2.3) | 3 (1.5) | 11 (1.2) |
| Akatsi North | 0 (0.0) | 0 (0.0) | 2 (1.0) | 2 (1.1) | 0 (0.0) | 4 (0.4) |
| Akatsi South | 14 (8.1) | 10 (5.4) | 29 (14.8) | 14 (7.9) | 18 (9.0) | 85 (9.1) |
| Anloga | 8 (4.6) | 7 (3.8) | 15 (7.7) | 8 (4.5) | 12 (6.0) | 50 (5.4) |
| Central Tongu | 2 (1.2) | 6 (3.2) | 4 (2.0) | 5 (2.8) | 9 (4.5) | 26 (2.8) |
| Ho | 43 (24.9) | 21 (11.4) | 22 (11.2) | 16 (9.0) | 20 (10.0) | 122 (13.1) |
| Ho West | 15 (8.7) | 14 (7.6) | 6 (3.1) | 11 (6.2) | 7 (3.5) | 53 (5.7) |
| Hohoe | 2 (1.2) | 4 (2.2) | 3 (1.5) | 8 (4.5) | 9 (4.5) | 26 (2.8) |
| Keta | 1 (0.6) | 5 (2.7) | 7 (3.6) | 7 (4.0) | 15 (7.5) | 35 (3.8) |
| Ketu North | 20 (11.6) | 52 (28.1) | 44 (22.4) | 38 (21.5) | 30 (15.0) | 184 (19.8) |
| Ketu South | 8 (4.6) | 12 (6.5) | 8 (4.1) | 5 (2.8) | 8 (4.0) | 41 (4.4) |
| Kpando | 5 (2.9) | 8 (4.3) | 3 (1.5) | 3 (1.7) | 2 (1.0) | 21 (2.3) |
| North Dayi | 1 (0.6) | 2 (1.1) | 5 (2.6) | 3 (1.7) | 8 (4.0) | 19 (2.0) |
| North Tongu | 13 (7.5) | 18 (9.7) | 12 (6.1) | 11 (6.2) | 7 (3.5) | 61 (6.6) |
| South Dayi | 13 (7.5) | 11 (5.9) | 7 (3.6) | 11 (6.2) | 16 (8.0) | 58 (6.2) |
| South Tongu | 17 (9.8) | 7 (3.8) | 17 (8.7) | 16 (9.0) | 18 (9.0) | 75 (8.1) |
| Variable | 2019 | 2020 | 2021 | 2022 | 2023 |
|---|---|---|---|---|---|
| Incidence per 100,000 (95% CI) | Incidence per 100,000 (95% CI) | Incidence per 100,000 (95% CI) | Incidence per 100,000 (95% CI) | Incidence per 100,000 (95% CI) | |
| Gender | |||||
| Male | 12.4 (10.0–14.8) | 11.9 (9.6–14.2) | 14.2 (11.6–16.8) | 13.3 (10.8–15.8) | 14.0 (11.4–16.6) |
| Female | 7.1 (5.4–8.8) | 8.4 (6.6–10.2) | 9.9 (7.8–12.0) | 8.1 (6.2–10.0) | 9.6 (7.6–11.6) |
| Age Group | |||||
| 0–4 | 6.0 (2.6–9.4) | 3.4 (0.9–5.9) | 7.2 (3.3–11.1) | 7.0 (3.2–10.8) | 12.7 (7.6–17.8) |
| 5–9 | 6.6 (3.2–10.0) | 4.6 (1.8–7.4) | 7.7 (3.8–11.6) | 5.0 (1.9–8.1) | 6.9 (3.3–10.5) |
| 10–14 | 4.5 (1.6–7.4) | 5.8 (2.5–9.1) | 10.4 (5.7–15.1) | 9.1 (4.8–13.4) | 3.7 (1.0–6.4) |
| 15–17 | 8.6 (3.5–13.7) | 7.7 (2.9–12.5) | 13.8 (7.0–20.6) | 12.6 (6.2–19.0) | 10.7 (4.9–16.5) |
| 18–19 | 19.5 (9.6–29.4) | 15.2 (6.6–23.8) | 18.5 (8.5–28.5) | 13.9 (5.3–22.5) | 15.0 (6.1–23.9) |
| 20–34 | 12.7 (9.2–16.2) | 17.2 (13.2–21.2) | 18.8 (14.4–23.2) | 15.2 (11.3–19.1) | 17.7 (13.5–21.9) |
| 35–49 | 14.4 (9.9–18.9) | 12.0 (8.0–16.0) | 11.4 (7.2–15.6) | 14.3 (9.7–18.9) | 14.8 (10.2–19.4) |
| 50–59 | 9.8 (4.2–15.4) | 12.0 (5.9–18.1) | 10.8 (4.7–16.9) | 8.8 (3.3–14.3) | 13.8 (7.0–20.6) |
| 60–69 | 4.6 (0.1–9.1) | 10.0 (3.5–16.5) | 7.5 (1.5–13.5) | 7.3 (1.4–13.2) | 1.2 (−1.1–3.5) |
| 70+ | 5.1 (0.1–10.1) | 5.0 (0.1–9.9) | 4.2 (−0.5–8.9) | 1.4 (−1.3–4.1) | 8.0 (1.6–14.4) |
| Variables | RR (95% CI) | |
|---|---|---|
| Sex | ||
| Female | Ref | |
| Male | 1.27 (1.11–1.44) | <0.001 |
| Age Group | ||
| 0–4 | Ref | |
| 5–9 | 0.85 (0.59–1.22) | 0.356 |
| 10–14 | 0.92 (0.64–1.31) | 0.628 |
| 15–17 | 1.47 (1.03–2.10) | 0.024 |
| 18–19 | 2.28 (1.59–3.27) | <0.001 |
| 20–34 | 2.26 (1.74–2.98) | <0.001 |
| 35–49 | 1.86 (1.40–2.49) | <0.001 |
| 50–59 | 1.54 (1.08–2.19) | 0.012 |
| 60–69 | 0.85 (0.52–1.36) | 0.491 |
| 70+ | 0.66 (0.37–1.12) | 0.111 |
Peer Reviews
No public reviews on file for this paper yet. If you reviewed it on a platform where reviews are public (OpenReview, ICLR, NeurIPS, ICML), you can paste yours below so the community can read it here.
Videos
No videos yet. Explain this paper in a talk, walkthrough, or lecture? Add one.
Taxonomy
TopicsRabies epidemiology and control · Legionella and Acanthamoeba research · Tattoo and Body Piercing Complications
Background
Human bites are regarded as a significant public health issue around the globe. It is considered the third most common bite injury behind dog and cat bites (1). Human bites are often underestimated, but literature has it that they can lead to significant infections in the victims (2). Similar to monkey bites, human bites are generally more serious and more prone to infections and complications than those infected by other animals (3). Because there are more resident germs in the human mouth than in the mouths of dogs or cats, human bites usually infect the victim with more bacteria (4). Anaerobic bacteria often infect such wounds as a result of these bites (5). Findings from studies conducted in the United States have indicated that approximately 10% of human bites in infants would end in infection (6). With an increasing population, these bites can significantly increase with a pronounced rise in developing nations (7).
According to US estimates, one in two people will get bitten at some point in their lives, either by an animal or by a human (3). Human bites account for 3% of total bites seen at emergency departments (8). In some under-developed and developing countries in Africa, human bites are relatively common (9). However, studies conducted within these regions have primarily focused on human bites occurring at the oro-facial region of the human body (9–11). This inference could mean that most of these injuries occur in the head region. A study conducted across 12 African countries in 2020 on traumatic injuries revealed that out of a total of 200 cases seen, 51(25.5%) were as a result of human bites and these injuries occurred in the facial region (9). Most of these human bite injuries occurring in the orofacial region are a result of social conflicts (10). One of the two studies done on human bites in Ghana was in 2016 at the Komfo Anokye Teaching Hospital, which aimed to provide a general overview of orofacial human bites with a focus on etiology, presentations, anatomic locations, treatment, and outcome of treatment (11). Findings from the study showed that most of the offenders are known to the patients because they are rivals (11). Considering the fact that the incidence of human bite could increase due to potential rise in social conflicts, close contact activities and crowded living conditions (9), there is a need to review existing data to estimate the incidence, population at risk and identify patterns.
Human bites, although preventable, continue to represent a significant public health concern in both developing and developed regions. In Ghana, there has been insufficient research regarding the incidence, age distribution, and other demographic risk factors of human bite cases. Furthermore, there are currently no established national preventive or intervention strategies to address this issue. This situation underscores the urgent need for heightened public awareness and additional research. However, this will be based on baseline data. Therefore, this study aimed to examine the incidence, trends and geographic distribution of human bite cases reported in the Volta Region between 2019 and 2023.
Methods
Study design and setting
A retrospective analysis of aggregated secondary data was performed to describe human bite cases in the Volta Region of Ghana for the years 2019 to 2023. The Volta Region consist of 18 districts with an estimated population of 1.7 million people, with Ho as its capital city. The observed decrease in the Volta Region’s population between 2020 and 2021 is because the 2020 figure was a projection based on the 2010 census, while the 2021 figure comes from the actual 2021 census. The most populated district in the region is Ketu South Municipality, followed by Ho Municipality and Ketu North Municipality (Table 1). The predominant occupation in the region is farming, with most indigenes residing in rural communities. Fishing occurs along the coast and in communities along the Volta Lake (12). The Alavanyo-Nkonya conflict, which has been ongoing sporadically since 1923, is located in the Volta Region (13). The Volta Region currently has a total of 557 health facilities, with the majority of which are Community-based Health Planning Service (CHPS) compounds. The region has one Teaching Hospital, however, there are six districts without a primary hospital (14). The Volta Region was chosen for this review because there has not been any study on human bites in the region and ranks among the top 3 regions with the highest prevalence of domestic violence in Ghana (15). The region also experiences recurring community conflicts, such as the long-standing Alavanyo–Nkonya dispute, which reflects underlying social tension. Despite these conditions, there has been no prior study on human bite injuries in the region. Examining human bite patterns in this setting therefore provides important baseline information for understanding the burden and potential social drivers of such injuries in Ghana.
Data collection and processing
All registered health facilities in the Volta Region have access to an electronic health record platform known as the District Health Information Management System-2 (DHIMS-2). This system facilitates the compilation of monthly data generated at each facility. When a client presents to a health facility with an injury, such as a human bite, demographic information, including age and sex, is recorded either electronically or in physical registers, along with the clinician’s diagnosis. At the end of each month, a summary of all new health conditions is prepared using the outpatient morbidity form, which is then entered into DHIMS-2 (13). For this study, the data visualization feature within DHIMS-2 was used to extract relevant information. As the data is reported by age and sex, the study was able to retrieve variables for age, sex, year, and the districts where human bite cases were documented and reported. To extract data on mortalities as a result of human bite, the Cause of Death (CoD) instance of the DHIMS was utilized. The event report page of the CoD instance was used to extract the number of deaths due to human bite.
Data analysis
Data was analyzed descriptively based on person, place and time. The results were reported as frequencies and proportions. The QGIS software was used to geographically describe the distribution of the cases in the Volta Region. Incidence rate was calculated by dividing the number of cases reported by the total population within a specific year. Using estimates from the population and housing census, the age and sex specific populations were calculated. These estimates were used to compute the age and sex specific incidence (Table 2). District-specific incidence was also computed using the district-specific population by year (Table 1). The incidence was reported per 100,000 population with their respective 95% confidence intervals.
Results
Characteristics of reported human bites
Over the 5 years, a total of 931 cases of human bites were recorded, of which 541 (58.1%) were males. There was no recorded mortality. In terms of age groupings, 321 (34.5%) of cases aged 20–34 years and 179 (19.2%) were between the ages of 35–49 years. Children less than 5 years old were 69 (7.4%). The majority of the cases were reported in 2023, 200 (21.5%). In terms of locations where these cases were reported, 184 (19.8%) human bites were recorded in Ketu North, 122 (13.1%) in Ho, and 85 (9.1%) in Akatsi North (Table 3).
Incidence of human bites in the Volta region, 2019–2023
In 2019, the incidence of human bites was 9.7 per 100,000 (Figure 1). The incidence was highest among males, 12.4 per 100,000 (95% CI: 10.0–14.8) and among persons aged 18–19 years, 19.5 per 100,000 (95% CI: 9.6–29.4; Table 4). Geographically, the incidence was highest in South Dayi, 22.7 per 100,000 (Figure 2). In 2020, the incidence of human bites increased to 10.1 per 100,000 (Figure 1). The incidence was lowest among females, 8.4 per 100,000 (95% CI: 6.6–10.2) but highest among persons aged 20–34 years, 17.2 per 100,000 (95% CI: 13.2–21.2; Table 4). Geographically, the incidence was highest in Ketu North, 41.5 per 100,000 (Figure 2). In 2021, the incidence further increased to 12.0 per 100,000 (Figure 1), resulting in a further increase in the incidence among persons aged 20–34 years, 18.8 (95% CI: 14.4–23.2; Table 4). There was, however, a decrease in incidence in Ketu North, 38.3 per 100,000, though it still remained the district with the highest incidence (Figure 2).
Trend of human bites in the Volta Region, 2019–2023.
Human bites incidence by district in the Volta Region, 2019–2023.
In 2022, there was a decrease in the incidence of human bites, 10.6 per 100,000 (Figure 1). This affected the incidence among males, 13.3 per 100,00 (95% CI: 10.8–15.8) and also on persons aged 20–34 years, 15.2 (95% CI: 11.3–19.1; Table 4). In 2023, the incidence increased to 11.7 per 100,000 (Figure 1). As a result, there was an increase in incidence among males, 14.0 (95% CI: 11.4–16.6), which is the highest across the 5 years studied. The incidence among persons aged 20–34 years was 17.7 per 100,000 (13.5–21.9; Table 4). Geographically, the incidence was highest in South Dayi, 26.7 per 100,000 (Figure 2).
Compared to females, males had a significantly higher risk of human bite incidents (RR = 1.27, 95% CI: 1.11–1.44, p < 0.001). The risk of bites increased progressively with age, peaking among individuals aged 18–19 years (RR = 2.28, 95% CI: 1.59–3.27, p < 0.001) and 20–34 years (RR = 2.26, 95% CI: 1.74–2.98, p < 0.001), relative to children aged 0–4 years. Older adults (≥60 years) had a comparatively lower but non-significant risk. Overall, the results indicate that males and younger adults are at the greatest risk of human bite incidents (Table 5).
Discussion
This study investigated the occurrence, trends, and patterns of human bites in the Volta Region of Ghana. A five-year analysis of human bites provided important insights into the incidence rates, demographic characteristics, and geographic disparities across the region. Findings from this study show that there seems to be an increase in the incidence of human bites over the years studied. Although the study did not establish the exact reason for the increase, surge in domestic violence in the region, may have contributed to this upward trend. The Ghana demographic and health survey indicated that the percentage of women aged 15–49 who have ever experienced domestic violence in the Volta region increased from 34.7% in 2008 to 40.3% in 2022. This places the Volta region in the top 3 regions with the highest prevalence (15).
This study offers important insights into the trends and demographic patterns of human bite cases in the Volta Region. However, the findings should be interpreted with caution because of the limitations of the DHIMS-2 data. Although DHIMS-2 captures routine health facility information, it lacks clinical and contextual details. It does not capture how the bite occurred, who the aggressor was, the body part affected, or the type and outcome of treatment. These gaps limit our ability to identify behavioral, social, and clinical factors that influence human bite incidents and their severity. Our study could only describe demographic and geographic patterns but could not assess causality or the risk of complications such as infections or hospital admissions. Despite these limitations, our study provides useful baseline data on the epidemiology of human bites in Ghana. The findings highlight the need to improve surveillance systems to include more detailed information. Enhancing DHIMS-2 to capture variables on injury mechanisms, treatment, and outcomes would support deeper analysis and better public health action. We recommend future studies should combine DHIMS-2 data with qualitative or hospital-based data to give a complete picture of the causes and effects of human bites in the region.
More males were affected compared to females. The district with the highest incidence is Ketu North and the lowest incidence was reported in Akatsi North. Although these estimates are lower than other diseases of public health concern within the region, there is a need to put in measures to curb the occurrence of these incidents, as human bites are generally more infectious than other animal bites (3). The plausible reasons for the differences in incidence across the districts could be related to population distribution. Districts such as Ketu North, which share borders with Togo, are more densely populated and experience higher cross-border trade and mobility. Increased population movement and social interaction in these settings may elevate the risk of interpersonal conflicts that lead to human bites. In contrast, smaller and more rural districts such as Akatsi North or Adaklu have lower population density and fewer social contact points, possibly explaining their lower incidence. In addition, variations in the strength of surveillance systems across districts may influence data accuracy, with some districts capturing and reporting cases more effectively than others. Although these explanations are speculative, they align with earlier reports linking human bites to domestic and social conflicts in African contexts (7, 10, 16). These findings further emphasize the need for further studies that explore the social and behavioral drivers of these injuries to design effective prevention strategies.
In our study, we reported a higher proportion of human bites among males compared to females. This is consistent with studies from Ghana and the US, which found that the majority of human bite victims are males (17–19). It is not surprising to see more males being victims of human bites because males are generally more aggressive and are involved in more risky behaviors such as fights, than females (20, 21). Also, in a physical altercation between a man and a woman, it is uncommon for the man to resort to biting. Typically, the woman is more likely to bite in self-defense. In contrast, studies conducted in several African countries, including Ghana, have found more females being victims of human bites (9–11, 22, 23). In the African settings where polygamy is practiced (24), co-wives often engage in physical altercations driven by jealousy, which can lead to one biting the other in an attempt to disfigure her rival (9). This may explain why studies have found a higher proportion of women being victims of human bites. The difference in estimates could be due to the fact that our study focused on all types of human bite injuries reported to the health facilities, whereas studies that reported higher proportions among females used data on persons who had orofacial human bite.
Our study found 34.5% of victims of human bites aged 20–34 years. In terms of incidence, the results show that persons aged 18–34 years are the most victims of human bites. This agrees with findings by Shubi et al., who found 45.5% of persons aged 20–29 years as victims of human bite (10). Also, Osaiyuwu & Osaguona found 38.5% of persons aged 28–37 years as victims of human bite (22). The high incidence among young adults correlates with the assertion that young adults are usually persons who are involved in conflicts, which results in physical altercation, because it is at this age that they begin intimate relationships (24). The relative risk analysis further supports these demographic trends. Males were about 27% more likely to experience human bite injuries than females, consistent with findings from previous studies in Ghana (11) and elsewhere (10) that associate aggressive behavior and interpersonal violence more commonly with men. Similarly, the risk peaked among young adults aged 18–34 years, the age group most likely to be involved in social or physical confrontations. These results suggest that targeted prevention and conflict resolution programs for young men could help reduce such incidents.
Limitations and strengths
This study had important limitations. First, the DHIMS-2 data captured inadequate characteristics of human bite injuries. The cause and the affected areas were not routinely recorded. Furthermore, who did the biting, the type of treatment given and the outcome of the bite were not captured by the data source that was used for this analysis. The limited data variability restricted the level of analysis of the data for this study. Additionally, only human bite injuries reported at health facilities were included for this study, potentially underrepresenting the actual situation in the region. Despite these limitations, this study is the first to determine the rate, trend, and distribution of human bite injuries in the Volta Region of Ghana.
Conclusion
The incidence of human bite injuries in the Volta Region appears to have risen over the years under study. While the incidence remains lower compared to other public health-related injuries in the region, it is essential to address this upward trend. Although our findings did not identify the specific causes of these injuries or their outcomes, we believe this study offers valuable baseline data for further research into the potential causes and outcomes of such injuries.
The reference list from the paper itself. Each links out to its DOI / PubMed record.
- 1Brook I. Management of human and animal bite wounds: an overview. Adv Skin Wound Care. (2005) 18:197–203. doi: 10.1097/00129334-200505000-00008, PMID: 15920371 · doi ↗ · pubmed ↗
- 2Elkamch H Mesbahi A Brahmi A Hafidi J Gharib N Abassi A. Management of necrotizing fasciitis due to a human bite: case report. Int Surg J. (2024) 11:1147–51. doi: 10.18203/2349-2902.isj 20241744 · doi ↗
- 3Goldstein EJ. Bite wounds and infection. Clin Infect Dis. (1992) 14:633–40.1562653 10.1093/clinids/14.3.633 · doi ↗ · pubmed ↗
- 4Meadowcroft M. Treating mammalian bite wounds. J Clin Pharm Ther. (2000) 25:85–99.10849186 10.1046/j.1365-2710.2000.00274.x · doi ↗ · pubmed ↗
- 5Goldstein EJ Citron DM Wield B Blachman U Sutter VL Miller TA. Bacteriology of human and animal bite wounds. J Clin Microbiol. (1978) 8:667–72.744798 10.1128/jcm.8.6.667-672.1978 PMC 275321 · doi ↗ · pubmed ↗
- 6Darvishi M Nava AO Karimi E Nouri M Meigooni SS Hejripoor SZ. Human and animal bites. Caspian J Environ Sci. (2023) 21:445–56.
- 7Robsam SO Ihechi EU Olufemi WO. Human bite as a weapon of assault. Afr Health Sci. (2018) 18:79–89. doi: 10.4314/ahs.v 18i 1.12, PMID: 29977261 PMC 6016993 · doi ↗ · pubmed ↗
- 8Maniscalco K.Edens M. A. Human bites. Stat Pearls - NCBI Bookshelf (2023). Available online at: https://www.ncbi.nlm.nih.gov/books/NBK 430764/?report=reader (Accessed December 19, 2024).