Optimization of Artemisia ordosica crude polysaccharides on milk fatty acid composition in lactating donkeys and their effects on rectal microbiome and lactation performance
Fanzhu Meng, Yanli Zhao, Yongmei Guo, Xiaoyu Guo, Qingyue Zhang, Shuyi Li, Yue Chi, Li Li, Fang Hui, Manman Tong, Sumei Yan

TL;DR
This study shows that adding Artemisia ordosica polysaccharides to donkey diets improves milk quality, digestion, and gut bacteria.
Contribution
The study demonstrates AOCP's novel impact on donkey milk fatty acids and gut microbiota.
Findings
AOCP increased milk yield, fat, lactose, and unsaturated fatty acids in lactating donkeys.
AOCP improved rectal butyrate and beneficial bacteria while reducing pathogenic species.
AOCP enhanced lipid metabolism enzyme activity and nutrient digestibility.
Abstract
This study evaluated the effects of dietary Artemisia ordosica crude polysaccharides (AOCP; 0.5 g/kg DM) supplementation on milk fatty acid profiles, rectal microbiota, enzymes related to lipid metabolism, and lactation performance in lactating Dezhou donkeys. A single-factor completely randomized design was used, with 14 lactating Dezhou donkeys (6.16 ± 0.67 years old, 250.06 ± 25.18 kg, parity 2.82 ± 0.48, 39.11 ± 7.42 days in lactation, each with a foal) randomly divided into two groups (n = 7/group). The CON group was fed a diet with a concentrate to forage ratio of 3:7, while the AOCP group received the same diet supplemented with 0.5 g/kg DM of AOCP. The trial lasted 10 weeks (including a 2-week adaptation period). Compared with the CON group, AOCP supplementation significantly enhanced lactation performance (milk yield, fat, lactose) and the digestibility of DM, ADF, NDF, and…
Genes, proteins, chemicals, diseases, species, mutations and cell lines named across the full text — each resolved to its canonical identifier and authoritative record.
Click any figure to enlarge with its caption.
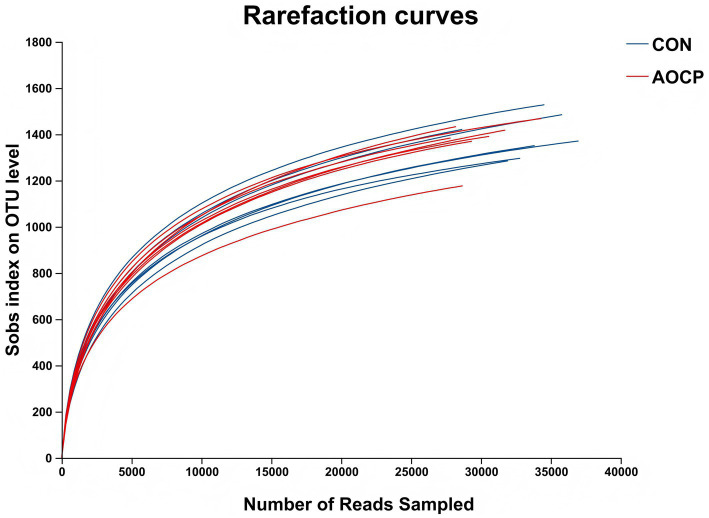 Figure 1
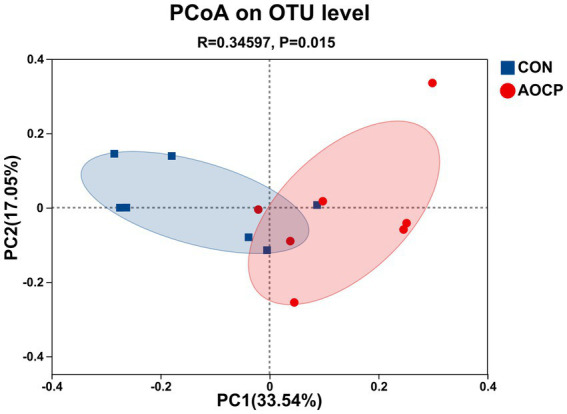 Figure 2
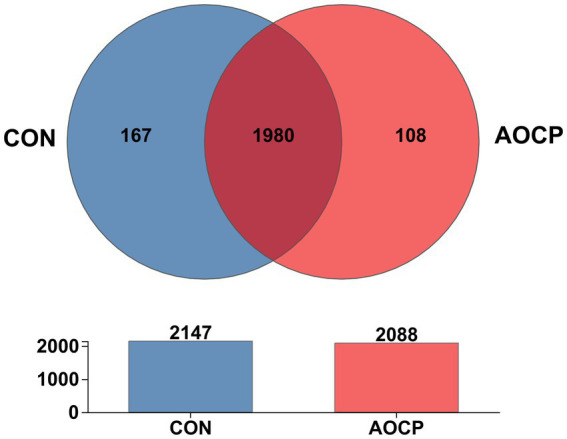 Figure 3
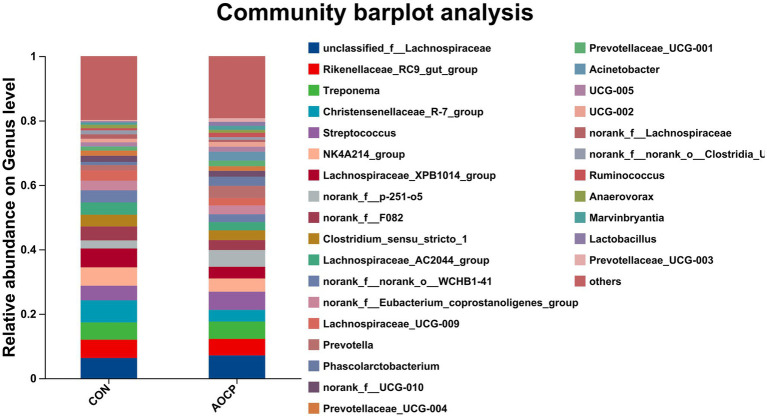 Figure 4
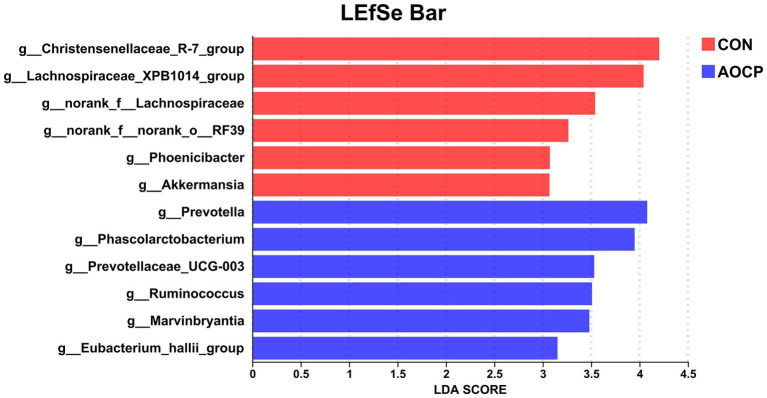 Figure 5
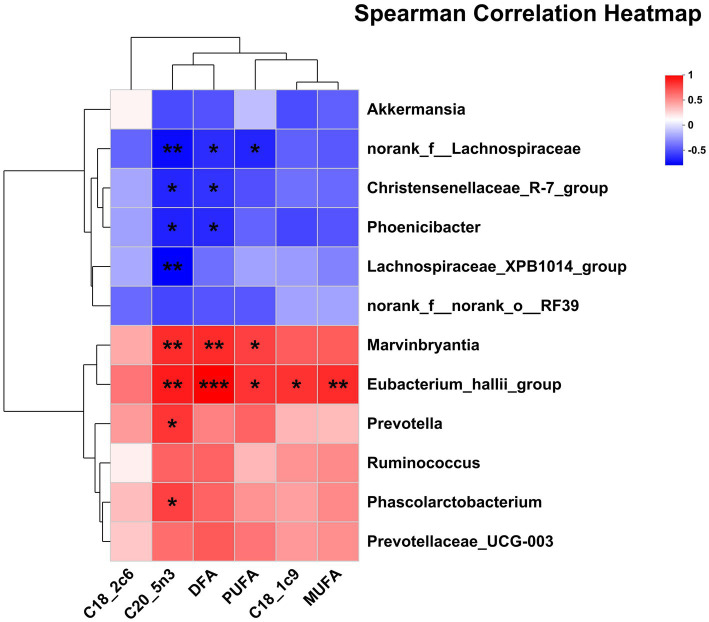 Figure 6
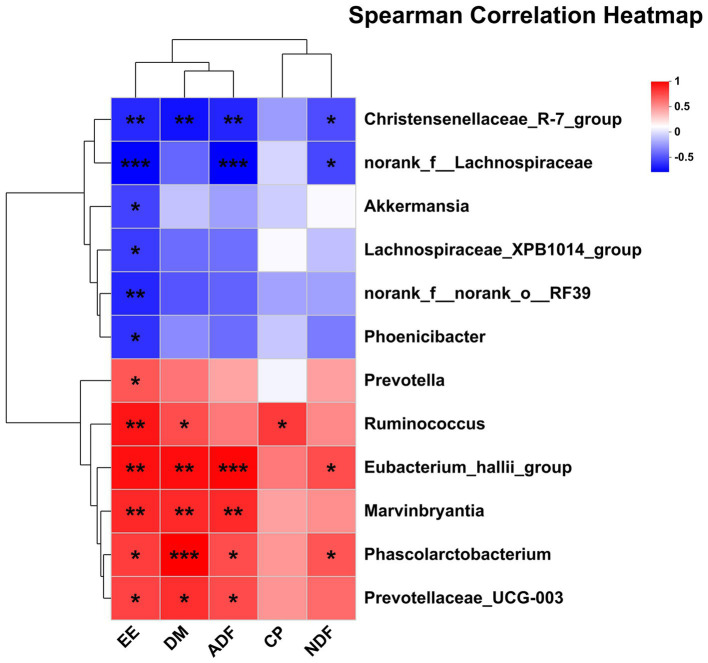 Figure 7
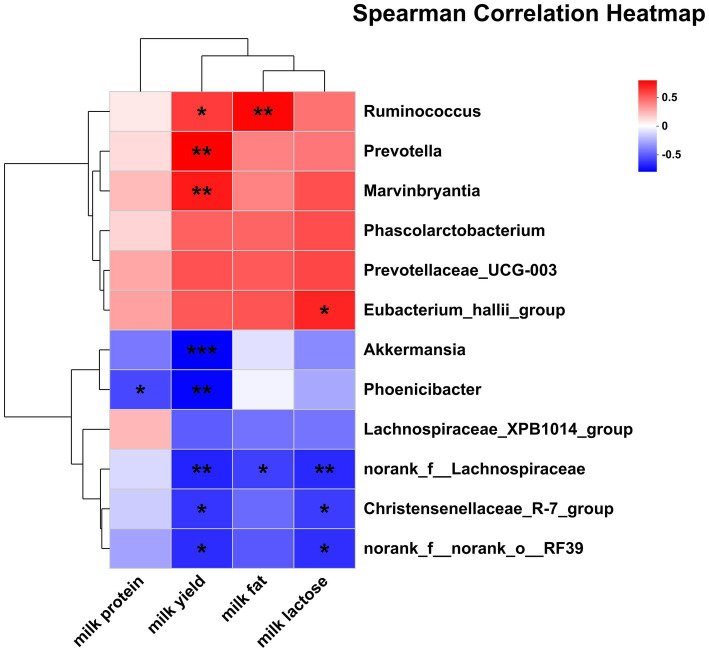 Figure 8
| Items | Content |
|---|---|
| Ingredients (% of DM) | |
| Millet straw | 33.97 |
| Alfalfa | 23.55 |
| Corn | 15.19 |
| Soybean meal | 8.55 |
| Corn silage | 12.49 |
| DDGS (High fat) | 1.80 |
| Corn germ meal | 1.80 |
| Bran | 0.90 |
| NaCl | 0.39 |
| CaCO3 | 0.21 |
| CaHPO4 | 0.66 |
| Premix | 0.50 |
| Total | 100.00 |
| DE (MJ/kg) | 13.82 |
| DM | 87.21 |
| CP | 12.28 |
| EE | 2.12 |
| NDF | 47.87 |
| ADF | 28.30 |
| Ca | 1.12 |
| P | 0.36 |
| Items | CON | AOCP1 | SEM | |
|---|---|---|---|---|
| C11:0 | 0.13 | 0.10 | 0.028 | 0.390 |
| C14:0 | 0.47 | 0.50 | 0.057 | 0.706 |
| C16:0 | 15.34 | 16.31 | 0.497 | 0.198 |
| C20:0 | 0.43 | 0.44 | 0.010 | 0.528 |
| C21:0 | 0.06a | 0.04b | 0.004 | 0.003 |
| C22:0 | 0.25a | 0.21b | 0.009 | 0.021 |
| C24:0 | 0.36a | 0.31b | 0.012 | 0.023 |
| C16:1 | 0.66b | 0.77a | 0.021 | 0.003 |
| C17:1 | 0.30a | 0.24b | 0.011 | 0.004 |
| C18:1t9 | 0.08 | 0.08 | 0.008 | 0.723 |
| C18:1c9 | 10.42b | 11.49a | 0.215 | 0.006 |
| C20:1 | 0.36 | 0.35 | 0.052 | 0.266 |
| C22:1 | 4.75a | 3.77b | 0.112 | <0.001 |
| C18:2t6 | 0.04 | 0.03 | 0.004 | 0.175 |
| C18:2c6 | 38.14b | 41.49a | 0.899 | 0.025 |
| C20:2n6 | 0.34a | 0.31b | 0.007 | 0.042 |
| C20:3n6 | 0.13b | 0.15a | 0.002 | 0.003 |
| C22:2n6 | 0.16a | 0.13b | 0.004 | <0.001 |
| C20:3n3 | 0.17a | 0.13b | 0.005 | <0.001 |
| C20:5n3 | 0.07b | 0.10a | 0.007 | 0.007 |
| SFA | 42.98a | 39.52b | 0.895 | 0.024 |
| UFA | 57.02b | 60.49a | 0.895 | 0.024 |
| MUFA | 17.16 | 17.31 | 0.220 | 0.665 |
| PUFA | 39.86b | 43.18a | 0.895 | 0.026 |
| n-3 PUFA | 0.98b | 1.02a | 0.008 | 0.028 |
| n-6 PUFA | 38.89b | 42.19a | 0.897 | 0.026 |
| n-6/n-3 | 39.59 | 40.49 | 0.720 | 0.428 |
| U/S | 1.33b | 1.54a | 0.054 | 0.026 |
| P/S | 0.93b | 1.10a | 0.044 | 0.026 |
| Desirable fatty acid (DFA) | 76.25 | 79.16 | 1.040 | 0.086 |
| Atherogenicity Index (AI) | 0.30 | 0.30 | 0.014 | 0.988 |
| Thrombogenic Index (TI) | 1.13 | 1.08 | 0.027 | 0.220 |
| (C18:0 + C18:1)/C16:0 | 1.95 | 1.86 | 0.053 | 0.292 |
| Items3 | milk FA composition (%, TFA) | milk FA yield (g/day) | ||||||
|---|---|---|---|---|---|---|---|---|
| CON | AOCP1 | SEM | CON1 | AOCP1 | SEM2 | |||
| C11:0 | 0.03a | 0.01b | 0.002 | 0.003 | 0.11a | 0.05b | 0.005 | 0.002 |
| C14:0 | 6.69a | 6.06b | 0.073 | <0.001 | 24.76 | 23.66 | 0.984 | 0.443 |
| C16:0 | 18.51b | 20.14a | 0.454 | 0.026 | 68.39b | 78.69a | 2.994 | 0.039 |
| C20:0 | 0.03 | 0.04 | 0.001 | 0.097 | 0.13 | 0.15 | 0.008 | 0.124 |
| C21:0 | 0.01 | 0.01 | 0.004 | 0.476 | 0.05 | 0.03 | 0.018 | 0.767 |
| C22:0 | 0.01 | 0.01 | 0.001 | 0.669 | 0.05 | 0.05 | 0.003 | 0.930 |
| C24:0 | 0.00 | 0.00 | 0.001 | 0.783 | 0.02 | 0.02 | 0.005 | 0.370 |
| C16:1 | 2.17b | 2.67a | 0.068 | 0.001 | 8.06b | 10.43a | 0.473 | 0.005 |
| C17:1 | 0.01 | 0.01 | 0.001 | 0.072 | 0.02 | 0.03 | 0.005 | 0.139 |
| C18:1t9 | 0.05b | 0.06a | 0.002 | 0.008 | 0.17b | 0.22a | 0.012 | 0.037 |
| C18:1c9 | 18.05b | 20.02a | 0.597 | 0.043 | 66.90b | 78.02a | 3.369 | 0.042 |
| C20:1 | 0.21b | 0.25a | 0.006 | 0.009 | 0.79b | 0.96a | 0.039 | 0.011 |
| C22:1 | 0.09a | 0.08b | 0.003 | 0.010 | 0.33 | 0.29 | 0.017 | 0.166 |
| C18:2t6 | 0.01 | 0.01 | 0.001 | 0.110 | 0.03 | 0.04 | 0.003 | 0.059 |
| C18:2c6 | 17.41b | 18.84a | 0.442 | 0.043 | 64.45 | 73.95 | 3.530 | 0.087 |
| C20:2n6 | 0.43a | 0.40b | 0.005 | 0.021 | 1.57 | 1.57 | 0.078 | 0.966 |
| C20:3n6 | 0.04 | 0.04 | 0.001 | 0.102 | 0.13b | 0.16a | 0.008 | 0.019 |
| C22:2n6 | 0.03 | 0.03 | 0.001 | 0.113 | 0.13 | 0.11 | 0.008 | 0.323 |
| C20:3n3 | 0.10a | 0.09b | 0.001 | 0.001 | 0.36 | 0.34 | 0.017 | 0.407 |
| C20:5n3 | 0.01b | 0.02a | 0.001 | <0.001 | 0.02b | 0.06a | 0.002 | <0.001 |
| SFA | 57.78a | 53.84b | 0.701 | 0.002 | 213.91 | 211.05 | 9.792 | 0.841 |
| UFA | 42.22b | 46.16a | 0.701 | 0.002 | 156.39b | 180.50a | 7.340 | 0.040 |
| MUFA | 20.82b | 23.32a | 0.618 | 0.018 | 77.18b | 90.89a | 3.755 | 0.027 |
| PUFA | 21.40b | 22.84a | 0.468 | 0.024 | 79.20 | 89.61 | 4.263 | 0.114 |
| n-3 PUFA | 3.46 | 3.50 | 0.125 | 0.820 | 12.80 | 13.69 | 0.734 | 0.408 |
| n-6 PUFA | 17.94b | 19.34a | 0.442 | 0.047 | 66.40 | 75.91 | 3.610 | 0.093 |
| n-6/n-3 | 5.24 | 5.53 | 0.165 | 0.281 | 5.24 | 5.53 | 0.165 | 0.282 |
| U/S | 0.74b | 0.85a | 0.025 | 0.009 | 0.73b | 0.86a | 0.024 | 0.011 |
| P/S | 0.38b | 0.42a | 0.113 | 0.015 | 0.37b | 0.43a | 0.014 | 0.042 |
| Desirable fatty acid (DFA) | 43.83b | 47.79a | 0.684 | 0.007 | 162.35b | 186.90a | 7.609 | 0.043 |
| Atherogenicity Index (AI) | 1.31a | 1.16b | 0.030 | 0.007 | 1.31a | 1.16b | 0.030 | 0.007 |
| Thrombogenic Index (TI) | 0.90 | 0.87 | 0.027 | 0.544 | 0.90 | 0.88 | 0.027 | 0.502 |
| (C18:0 + C18:1)/C16:0 | 1.07 | 1.08 | 0.030 | 0.775 | 1.07 | 1.08 | 0.030 | 0.775 |
| Items | Treatment | SEM | ||||
|---|---|---|---|---|---|---|
| CON | AOCP | Treatment | Week | Treatment*week | ||
| DMI (kg/day) | 7.58b | 8.00a | 0.172 | <0.001 | <0.001 | 0.377 |
| MY (kg/day) | 0.86b | 0.90a | 0.013 | <0.001 | 0.026 | 0.789 |
| EMY (kg/day) | 3.46b | 3.61a | 0.051 | <0.001 | 0.022 | 0.744 |
| Milk production efficiency | 0.25 | 0.26 | 0.007 | 0.304 | <0.001 | 0.768 |
| Milk protein synthesis efficiency | 0.79 | 0.82 | 0.018 | 0.163 | <0.001 | 0.987 |
| Milk components | ||||||
| Fat (%) | 0.37b | 0.40a | 0.009 | 0.005 | 0.003 | 0.003 |
| Protein (%) | 1.74 | 1.76 | 0.035 | 0.505 | <0.001 | 0.298 |
| Lactose (%) | 7.10b | 7.11a | 0.018 | <0.001 | 0.648 | 0.914 |
| SNF (%) | 8.86b | 8.95a | 0.027 | 0.020 | <0.001 | 0.047 |
| TS (%) | 9.30b | 9.34a | 0.017 | 0.001 | <0.001 | 0.221 |
| Milk components yield | ||||||
| Fat yield (g/day) | 12.85b | 14.35a | 0.347 | 0.025 | <0.001 | 0.005 |
| Protein yield (g/day) | 60.17b | 63.67a | 1.151 | 0.033 | <0.001 | 0.395 |
| Lactose yield (g/day) | 245.74b | 256.24a | 4.230 | <0.001 | 0.030 | 0.785 |
| SNF yield (g/day) | 306.44b | 322.18a | 4.393 | 0.007 | <0.001 | 0.741 |
| TS yield (g/day) | 321.08b | 336.99a | 4.754 | 0.010 | <0.001 | 0.690 |
| Items | CON | AOCP | SEM | |
|---|---|---|---|---|
| DM (%) | 66.02b | 68.11a | 0.518 | 0.016 |
| CP (%) | 80.42 | 80.43 | 0.519 | 0.987 |
| EE (%) | 79.26b | 82.56a | 0.523 | 0.002 |
| NDF (%) | 39.69b | 42.11a | 0.662 | 0.029 |
| ADF (%) | 33.48b | 36.57a | 0.610 | 0.005 |
| Ca (%) | 65.74 | 65.80 | 0.637 | 0.959 |
| P (%) | 16.72 | 20.67 | 1.888 | 0.165 |
| Energy digestibility (%) | 70.39 | 70.43 | 0.714 | 0.973 |
| Energy metabolic rate (%) | 38.85b | 48.22a | 2.098 | 0.010 |
| Protein biological value (%) | 71.45 | 73.48 | 1.221 | 0.285 |
| Nitrogen metabolic rate (%) | 57.46 | 59.11 | 1.096 | 0.322 |
| Items3 | CON1 | AOCP1 | SEM2 | |
|---|---|---|---|---|
| ACC (U/L) | 43.66a | 37.48b | 1.115 | 0.003 |
| LPL (U/L) | 497.86 | 476.79 | 13.866 | 0.306 |
| HSL (U/L) | 1,501.14a | 1,079.00b | 44.177 | <0.001 |
| FAS (U/mL) | 1,224.29 | 1,238.57 | 17.997 | 0.629 |
| SCD (U/L) | 117.63b | 149.33a | 3.674 | <0.001 |
| FADS1 (U/L) | 33.07 | 37.38 | 1.278 | 0.114 |
| ELOVL5 (U/L) | 76.03 | 72.9 | 2.579 | 0.479 |
| Items | CON | AOCP | SEM | |
|---|---|---|---|---|
| Acetate (mmol/L) | 6.10b | 6.65a | 0.094 | 0.002 |
| Propionate (mmol/L) | 2.41 | 2.38 | 0.014 | 0.122 |
| Butyrate (mmol/L) | 0.82b | 0.87a | 0.009 | 0.002 |
| Acetate: Propionate ration | 2.53b | 2.80a | 0.036 | <0.001 |
| Total VFA (mmol/L) | 9.98b | 10.57a | 0.109 | 0.003 |
| Items | CON | AOCP | SEM | |
|---|---|---|---|---|
| Firmicutes | 68.22a | 58.96b | 1.607 | 0.004 |
| Bacteroidota | 18.73b | 28.51a | 1.177 | 0.001 |
| Spirochaetota | 6.01 | 6.10 | 1.017 | 0.956 |
| Verrucomicrobiota | 3.21 | 3.48 | 0.346 | 0.691 |
| Actinobacteriota | 1.07 | 1.06 | 0.093 | 0.921 |
| Phylum | Genus | Treatments | SEM | ||
|---|---|---|---|---|---|
| CON | AOCP | ||||
|
|
| 5.90b | 7.66a | 0.352 | 0.008 |
|
| 8.95a | 2.94b | 0.279 | <0.001 | |
|
| 5.76a | 4.53b | 0.198 | 0.001 | |
|
| 4.35 | 3.49 | 0.287 | 0.163 | |
|
| 5.35a | 3.33b | 0.357 | 0.015 | |
|
| 4.14 | 4.07 | 0.443 | 0.946 | |
|
| 3.22 | 3.06 | 0.326 | 0.811 | |
|
| 3.27 | 3.96 | 0.297 | 0.559 | |
|
| 2.56 | 2.00 | 0.224 | 0.151 | |
|
| 1.92 | 1.82 | 0.18 | 0.685 | |
|
| 1.30 | 1.42 | 0.146 | 0.627 | |
|
| 1.00 | 1.14 | 0.149 | 0.563 | |
|
|
| 5.47 | 5.57 | 0.302 | 0.838 |
|
| 3.74 | 3.09 | 0.384 | 0.296 | |
|
| 1.07b | 4.04a | 0.242 | <0.001 | |
|
| 1.75 | 1.66 | 0.238 | 0.804 | |
|
| 1.19 | 1.40 | 0.216 | 0.514 | |
|
|
| 4.62 | 4.26 | 0.631 | 0.771 |
|
|
| 2.54 | 2.17 | 0.286 | 0.432 |
|
|
| 1.89 | 1.68 | 0.275 | 0.699 |
Peer Reviews
No public reviews on file for this paper yet. If you reviewed it on a platform where reviews are public (OpenReview, ICLR, NeurIPS, ICML), you can paste yours below so the community can read it here.
Videos
No videos yet. Explain this paper in a talk, walkthrough, or lecture? Add one.
Taxonomy
TopicsReproductive Physiology in Livestock · Fatty Acid Research and Health · Ruminant Nutrition and Digestive Physiology
Introduction
1
Over the past two decades, donkey milk has attracted increasing attention as a functional food with potential beneficial effects on human health (Papademas et al., 2022). It has a low fat content and is rich in polyunsaturated fatty acids (PUFA) (Cimmino et al., 2023), making it especially suitable for people with cardiovascular diseases. Donkey milk contains various bioactive molecules with multifunctional properties. These include antimicrobial activity (e.g., lysozyme and lactoferrin), anti-inflammatory effects, and modulation of gut microbiota growth (Rubio, 2014; Yvon et al., 2018). Owing to its palatability and low levels of caseins and other allergenic proteins, it is particularly suitable for children with cow milk protein allergy (Mignone et al., 2015; Vincenzetti et al., 2017). However, donkey milk production remains limited, primarily owing to physiological constraints including a relatively small mammary gland, as well as an alveolar-dominant pattern of milk storage (Papademas et al., 2022). Nevertheless, lactation performance can be influenced by factors such as diet and animal health (Amirabadi Farahani et al., 2019). Therefore, improving milk production through nutritional strategies is of great importance.
Artemisia ordosica crude polysaccharide (AOCP) is extracted from Artemisia ordosica, a perennial dominant shrub species in the China-Mongolia region, and it contains diverse bioactive compounds, including polysaccharides, essential oils, flavonoids, and terpenoids (Zhou et al., 2019). These components exhibit broad-spectrum biological activities in livestock, such as antimicrobial, antioxidant, anti-stress, and anti-inflammatory effects, indicating significant application potential for AOCP in agriculture. Studies have shown that AOCP, as a feed additive, can enhance the antioxidant and anti-inflammatory capacities of lactating donkeys while improving the digestibility of nutrients (Li et al., 2024). Furthermore, dietary inclusion of Artemisia montana Pampan, a congeneric species of Artemisia ordosica, significantly elevates C18:3n3 and PUFA concentrations in beef cattle longissimus dorsi muscle, while concurrently reducing levels of C18:0, oleic acid (C18:1c9), and monounsaturated fatty acids (MUFA) (Kim et al., 2012). Intestinal microbiota play a critical role in monogastric animal physiology. A recent study by Guo et al. (2024) revealed that Clostridium_sensu_stricto_1 in the rectum was significantly positively correlated with the digestibility of crude protein (CP), neutral detergent fiber (NDF), and acid detergent fiber (ADF) in late-gestation donkeys. Additionally, the [Eubacterium]_coprostanoligenes_group showed a strong positive correlation with dry matter (DM) digestibility. In rodent models, AOCP has been shown to significantly increase the relative abundance of Bacteroidetes, unclassified_f_Lachnospiraceae, and Ruminococcus (Xing et al., 2020), as well as promote the growth of probiotics including Lactobacillus, Bifidobacterium, and Blautia (Zeng et al., 2022). Nevertheless, studies investigating the effects of AOCP on fatty acid (FA) composition, lactation performance, and rectal bacteria structure in lactating donkeys remain scarce.
In our study, we hypothesized that AOCP supplementation modulates milk FA profiles and lactation performance via microbiota-mediated pathways. This study aims to provide a theoretical basis for the comprehensive development and utilization of Artemisia ordosica as a feed resource and establish a scientific foundation for improving donkey milk yield and quality.
Materials and methods
2
Animal ethics statement
2.1
The experiment was conducted at the demonstration base of Inner Mongolia Agricultural University, Inner Mongolia Grassland Yulv Science and Technology Animal Husbandry Co., Ltd. (Hohhot, China). The Animal Ethics and Welfare Committee approved the experimental procedures at the Inner Mongolia Agricultural University (NND2022050), which were under the university’s guidelines for animal research.
Preparation of Artemisia ordosica crude polysaccharides
2.2
The Artemisia ordosica (aerial parts) used in this study was collected during its July–August flowering period from sandy grasslands in Ordos, Inner Mongolia Autonomous Region. AOCP was prepared according to the method described by Xing et al. (2020). AOCP was extracted from the whole plant (excluding roots) using a water-extraction and ethanol-precipitation method. The dried plant material was ground into powder, defatted with petroleum ether, and then extracted with 15 volumes of distilled water at 60 °C for 4 h. The aqueous extract was filtered and concentrated. Polysaccharides were precipitated by adding anhydrous ethanol (4:1, v/v) to the concentrated supernatant and incubating at 4 °C for 48 h. The precipitate was collected by centrifugation at 12,000×g for 15 min and washed sequentially with petroleum ether, acetone, and ethanol. The resulting precipitate was redissolved in distilled water and deproteinized using the Sevag method and dialyzed. Finally, the product was freeze-dried to obtain AOCP powder, which was stored at −20 °C until use. The extracted AOCP yield was 55.6 g AOCP per kilogram of raw Artemisia ordosica material. Compositional analysis revealed that the major constituents of AOCP were polysaccharides (52.65%), proteins (2.39%), uronic acids (4.27%), and phenols (0.11%).
Animals, diets and experimental design
2.3
In a single factor completely randomized experimental design, a total of 14 lactating Dezhou donkeys (39.11 ± 7.42 days in milk, 2.82 ± 0.48 parity, 250.06 ± 25.18 kg of live weight) were randomly assigned to two groups, including the control (CON) and AOCP groups (n = 7). Based on the basal diet, the AOCP addition dose was 0 and 0.5 g/kg DM in the CON and AOCP groups, respectively. Table 1 shows the feed ingredients and nutrient composition (with a concentration-to-forage ratio of 3:7). The supplemented dose of AOCP was based on our previous study (Li et al., 2017). The experiment period lasted for 10 weeks, and included 2 weeks for adaptation (pretrial period) and 8 weeks for data and sample collection (experimental period).
Each donkey was kept in a single stall (1.6 m × 2.0 m) and fed concentrate, corn silage and alfalfa at 7:00 a.m. and 2:00 p.m. every day. Millet straw was fed five times a day. Water was supplied ad libitum. Any leftover feed was collected each day in the morning before feeding, and the amount of feed offered was adjusted daily on the basis of the intake of the previous day to obtain the target refuse rate of 5–10%. The designated ratio of concentrate to forage was maintained. The feed offered and refused was weighed daily to calculate the daily matter intake (DMI) for each group.
Sample collection and analysis
2.4
Milk sampling and analysis
2.4.1
From 7:00 a.m. to 10:00 a.m. and 2:00 p.m. to 5:00 p.m. every day, the donkeys were separated from their foals for 3 h each time, a total of 6 h per day, to allow for milk collection. Milking was conducted twice daily at 10:00 a.m. and 5:00 p.m. using an individual vacuum pumping machine (JuduH5402, Judu Technology, Hebei, China), and milk yield (MY, kg/d) was recorded at each milking, and daily MY was calculated by summing the two measurements (Li et al., 2013). Milk samples from the morning and afternoon were combined in a 1:1 ratio. One portion of this blended sample was analyzed for protein, fat, lactose, non-fat solids (SNF), and total solids (TS) using an automated mid-infrared milk analyzer (MilkoScan FT+, Foss Analytical Co., Ltd., Hillerød, Denmark). Another portion was preserved at −20 °C for subsequent analysis of FA. The estimated milk yield (EMY, kg/day) was calculated from MY measurements. Solids-corrected milk (SCM), milk production efficiency and milk protein synthesis efficiency were calculated according to the EMY and milk composition content. EMY (kg/day) = MY (kg/day)/isolation time (h) × 24 (h) (Liang et al., 2022). Milk production efficiency = SCM (kg/day)/DMI (kg/day) × 100. SCM (kg/day) = {(12.3 × milk fat (%) content of nonstandard milk + 6.56 × SNF (%) content of nonstandard milk − 0.0752)} × EMY (kg/day) (Yue et al., 2022). Milk protein synthesis efficiency = {EMY (kg/day) × milk protein (%)}/{DMI (kg/day) × CP level (%)} (Leiber et al., 2015).
FA methyl esters were produced from 1 g samples of Freeze-dried donkey milk powder following the method of Liang et al. (2025). For determination of FA concentration, a gas chromatograph (Agilent 7890B, DE, USA) with a SP™-2560 (Supelco, 100 m × 0.25 mm, 0.2 μm) was used. The injector temperature was 248 °C. The temperature program was configured as follows: initiate at 120 °C, maintain for 5 min, then escalate to 170 °C at a rate of 3 °C/min and hold for 10 min; further increase to 220 °C at 3 °C/min and maintain for 5 min; finally, elevate to 240 °C at 1 °C/min and hold for 10 min. Nitrogen served as the carrier gas, flowing at a rate of 3 mL/min with a split ratio of 9:1. The mixed standard for the FA methyl esters was sourced from Sigma Company.
The contents of 37 single FA were determined, and SFA, UFA, MUFA, PUFA, n-6 PUFA, n-3 PUFA, n-6/n-3, U/S, P/S, desirable fatty acid (DFA), atherogenicity index (AI), and thrombogenic index (TI) values were calculated. SFA in the milk including C4:0, C6:0, C8:0, C10:0, C11:0, C12:0, C13:0, C14:0, C15:0, C16:0, C17:0, C18:0, C20:0, C21:0, C22:0, C23:0 and C24:0. MUFA in the milk including C14:1, C15:1, C16:1, C17:1, C18:1t9, C18:1c9, C20:1, C22:1 and C24:1. n-6 PUFA including C18:2 t6, linoleic acid (C18:2c6), C18:3n6, C20:2n6, C20:3n6, C20:4n6 and C22:2n6. n-3 PUFA including C18:3n3, C20:3n3, eicosapentaenoic acid (C20:5n3) and C22:6n3. PUFA = n-3 PUFA + n-6 PUFA, n-6/n-3 = n-6 PUFA/n-3 PUFA, P/S = PUFA/SFA; UFA/SFA = U/S. DFA = C18:0 + UFA (Wereńska et al., 2021), AI = (C12:0 + (4 × C14:0) + C16:0)/UFA (Ulbricht and Southgate, 1991), TI = (C14:0 + C16:0 + C18:0)/[0.5 (MUFA) + 0.5 (n-6 PUFA) + 3 (n-3 PUFA) + (n-3 PUFA/n-6 PUFA)] (Ulbricht and Southgate, 1991), (C18:0 + C18:1)/C16:0 (Wereńska et al., 2021).
Apparent nutrient digestion and metabolism
2.4.2
Before the start of the experiment, dietary samples were collected and dried in a 65 °C oven. After crushing and sifting, air-dried samples were obtained and stored in a dry, dark and ventilated place to determine nutrient composition. During the 8th week of the experiment, 200 g of rectal feces from each donkey were collected consistently over six consecutive days, then thoroughly mixed and divided into two parts. One portion was treated with H_2_SO_4_ (10%, v/v) to prevent nitrogen loss and subsequently stored at −20 °C for future nitrogen analysis. Another portion was directly dried at 65 °C to determine the DM (method 930.15), CP (method 984.13), ether extract (EE, method 920.39) based on AOAC International methods (Helrich, 2006). NDF and ADF were analyzed with an Ankom 220 Fiber Analyzer (Ankom Co., NY, USA) following the methods proposed by Van Soest et al. (1991). Acid-insoluble ash (AIA) was used to determine the apparent total-tract digestibility (ATTD) of a certain nutrient according to the description of Ren et al. (2020) using the following formula:
Where A is the content of a given nutrient in the diet (%), A1 is the content of the same nutrient in the feces (%), B is the content of AIA in the diet (%), and B1 is the content of AIA in the feces (%).
A metabolic trial was conducted during the final 6 days of the experimental period using the methods outlined by Liang et al. (2022). Urine samples were transferred into Corning sample vessels (Corning Incorporated Costar, NY, USA). One sample remained untreated for creatinine and gross energy (GE) analysis, while the other was treated with 10 N sulfuric acid for nitrogen fixation to assess urinary nitrogen levels (Reynolds et al., 2014). All samples were stored at −20 °C.
GE in the diet, feces and urine samples was measured using an oxygen bomb calorimeter (6400 Automatic Analyzer Parr, IL, USA) according to the methods described by Jha et al. (2011). Energy digestibility and metabolisability were determined according to equations: energy digestibility = {diet GE (MJ/kg) × DMI -fecal GE (MJ/kg) × fecal output (kg)}/diet GE (MJ/kg) × DMI (kg) (Jha et al., 2011), and energy metabolisability = {diet GE (MJ/kg) × DMI (kg) - fecal GE (MJ/kg) × fecal output-urine GE (MJ/kg) × urine output (kg)}/diet GE (MJ/kg) × DMI (kg) (Jha et al., 2011); Fecal output = DMI × (AIA % in feed/AIA % in feces). The urine volume of the female donkeys was calculated according to the creatinine content in the urine, according to equation: Urine output = body weight (kg) × 24.05/creatinine (urine)/113 (Liang et al., 2022). N metabolisability = biological value (BV) × N digestibility, and BV = {N intake (kg/day)-N feces (kg/day)-N urine (kg/day)}/{N intake (kg/day)-N feces (kg/day)} × 100%.
Blood sampling and analysis
2.4.3
Blood samples were collected from the jugular vein of all experimental donkeys before morning feeding on the last day of the experiment, using both ordinary blood collection tubes and heparin sodium blood collection tubes (Corning, Corning Incorporated Costar, NY, USA). The samples were centrifuged at 2,500×g for 15 min to separate the serum and plasma. Both fractions were subsequently stored at −20 °C pending further analysis. The FA content in the plasma was determined using an Agilent 7890B gas chromatograph (Agilent Technologies, DE, USA) following the methods described by Wang et al. (2020). Serum lipid metabolism-related enzyme activities, including fatty acid synthase (FAS), acetyl-CoA carboxylase (ACC), fatty acid elongase 5 (ELOVL5), fatty acid desaturase 1 (FADS1), lipoprotein lipase (LPL), hormone-sensitive lipase (HSL) and stearoyl-CoA desaturase (SCD), were determined using enzyme-linked immunosorbent assay kits (Shanghai yanjin Biotechnology Institute, Shanghai, China).
Short-chain fatty acids analysis of the feces
2.4.4
During the final day of the experiment, rectal feces samples were collected from lactating donkeys using sterile gloves (2 collections per donkey). The samples were stored in DNase and RNase-free tubes (Shanghai Jingke Chemical Technology Co., Ltd., Shanghai), immediately frozen in liquid nitrogen (−196 °C), and reserved for subsequent analysis of short-chain fatty acids (SCFA). SCFA mainly include acetate, propionate, and butyrate. SCFA were produced from 1.5 g of rectal feces, as reported by Li et al. (2024). A Shimadzu 2014 gas chromatograph (Agilent Technologies, Santa Clara, CA) was utilized with nitrogen as the carrier gas, in conjunction with a DB-FFAP column (60 m × 0.25 mm × 0.5 μm). The temperatures of the column, detector, and injector were 120 °C, 250 °C, and 220 °C, respectively. The quantification of SCFA was completed by comparison against known standards (Supelco Volatile Fatty Acid Standard Mix, Sigma-Aldrich, St. Louis, MO, USA).
Rectal microbiome analysis
2.4.5
During the final day of the experiment, rectal feces samples were collected from lactating donkeys using sterile gloves (2 collections per donkey). The samples were stored in DNase and RNase-free tubes (Shanghai Jingke Chemical Technology Co., Ltd., Shanghai), immediately frozen in liquid nitrogen (−196 °C), and reserved for 16S microbiome analysis. To extract DNA, fecal samples from each donkey were thawed on ice. The E.Z.N.A.® soil DNA Kit (Omega Bio-tek, Norcross, GA, U.S.) was used to extract the total microbial DNA from 14 rectal feces samples according to the manufacturer’s instructions. DNA purity and concentration were detected with NanoDrop2000 (Thermo Fisher, New York, USA) and DNA integrity was assessed by 1% agarose gel electrophoresis. The hypervariable region V3-V4 of the bacterial 16S rRNA gene were amplified with primer pairs 338F (5′-ACTCCTACGGGAGGCAGCAG-3′) and 806R (5′-GGACTACHVGGGTWTCTAAT-3′) by an ABI GeneAmp® 9700 PCR thermocycler (ABI, CA, USA). The PCR system (20 μL) included 4 μL 5 × FastPfu Buffer, 2 μL 2.5 mmol/L dNTPs, 0.8 μL forward primer (5 μmol/L), 0.8 μL reverse primer (5 μmol/L), 0.4 μL FastPfu Polymerase, 0.2 μL BSA, 10 ng template DNA, and ddH2O. Three PCR replicates for each sample were mixed, and 5 μL of the PCR products of each sample were detected by 2% agarose gel electrophoresis. The PCR product was extracted from 2% agarose gel and purified using the PCR Clean-Up Kit (YuHua, Shanghai, China) according to manufacturer’s instructions and quantified using Qubit 4.0 (Thermo Fisher Scientific, USA). Sequencing was conducted on the MiSeq PE300 platform (Illumina, San Diego, USA) according to the standard protocols by Majorbio Bio-Pharm Technology Co. Ltd. (Shanghai, China).
Quality control and adapter trimming were performed using fastp (version 0.19.6). Paired-end reads were merged using FLASH (version 1.2.7) with the following parameters: (i) reads were truncated at sites with an average quality score < 20 within a 50 bp sliding window, and those shorter than 50 bp or containing ambiguous bases were discarded; (ii) overlapping sequences longer than 10 bp were assembled with a maximum mismatch ratio of 0.2 in the overlapping region - reads that could not be assembled were discarded; (iii) barcode and primer matching was conducted using exact barcode matching and allowing up to 2 nucleotide mismatches in primer sequences. Processed sequences were clustered into OTU at 97% similarity using UPARSE (version 7.1).1 Taxonomic classification of representative OTU sequences was performed using the RDP Classifier (version 2.2) against the SILVA v138 16S rRNA database with a confidence threshold of 0.7. Subsequent analyses included alpha-diversity analysis,2 construction of Venn diagrams, community composition analysis, intergroup significance testing at the phylum and genus levels, LEfSe analysis, and calculation of Spearman rank correlation coefficients between environmental factors and prominent genera. The resulting numerical matrices were visualized as heatmaps, where colors indicate the magnitude of values within the matrix. Beta diversity was assessed through principal coordinate analysis (PCoA) based on Bray-Curtis distances. All statistical analyses and visualizations were implemented in R (version 3.3.1).
Statistical analysis
2.5
All statistical analyses were conducted using SAS software (version 8.1; SAS Institute Inc., Cary, NC, USA). A mixed-effects model was implemented using the PROC MIXED procedure to analyze repeated-measures data, including DMI, MY, EMY, SCM/DMI ratio, milk protein synthesis efficiency, milk composition profiles, and their corresponding yields. The model was specified as follows: Yijk = μ + Ci + Wj + Ci × Wj + bXjk + εijk, where Yijk = dependent variable; μ = overall mean; Ci = fixed effect of dietary AOCP levels, Wj = fixed effect of lactation week (weeks 1, 2, 3, 4, 5, 6, 7, and 8), Ci × Wj = effect of the interaction between diet treatment and lactation week, bXjk = effect of covariate (week 0, the observations during the 2 weeks of pretrial period served as covariates for the corresponding experimental period), εijk = residual error. The other parameters were analyzed using the T-Test procedure on normally distributed data, otherwise using the Kruskal-Wallis test. The differences in species composition at phylum and genus classification levels were analyzed using Kruskal-Wallis rank sum tests in SAS. Differentially abundant bacterial genera in the rectal microbiota were identified using LEfSe, with a significance threshold set at a logarithmic LDA score of > 3. The correlations between differential bacteria genera and FA composition, as well as nutrient digestibility and lactation performance, were calculated by Spearman’s correlation coefficient, respectively. Differences were considered statistically significant at p < 0.05 and a trend toward significance was considered at 0.05 ≤ p < 0.10.
Results
3
Fatty acid composition in plasma and milk
3.1
As shown in Table 2, compared with the CON group, the AOCP group significantly increased the proportions of C16:1 (p = 0.003), C18:1c9 (p = 0.006), C18:2c6 (p = 0.025), C20:3n6 (p = 0.003), C20:5n3 (p = 0.007), UFA (p = 0.024), PUFA (p = 0.026), n-3 PUFA (p = 0.028), and n-6 PUFA (p = 0.026), as well as the U/S (p = 0.026) and P/S (p = 0.026) ratios in plasma. DFA showed a trend of increase (p = 0.086). Conversely, the AOCP group significantly decreased the proportions of C21:0 (p = 0.003), C22:0 (p = 0.021), C24:0 (p = 0.023), C17:1 (p = 0.004), C22:1 (p < 0.001), C20:2n6 (p = 0.042), C22:2n6 (p < 0.001), C20:3n3 (p < 0.001), and SFA (p = 0.024) in plasma. Supplement: Except for the FAs mentioned above, the other FAs did not differ between the two groups (p > 0.05; see Supplementary Table S1).
The effects of AOCP supplementation on milk FA composition and yield are presented in Table 3. Compared with the CON group, the AOCP group significantly increased proportions and yields of C16:0 (p = 0.026; p = 0.039), C16:1 (p = 0.001; p = 0.005), C18:1 t9 (p = 0.008; p = 0.037), C18:1c9 (p = 0.043; p = 0.042), C20:1 (p = 0.009; p = 0.011), C20:5n3 (p < 0.001; p < 0.001), UFA (p = 0.002; p = 0.040), MUFA (p = 0.018; p = 0.027), and DFA (p = 0.007; p = 0.043), as well as the U/S (p = 0.009; p = 0.011) and P/S (p = 0.015; p = 0.042). The AOCP group also showed increased proportions of C18:2c6 (p = 0.043), PUFA (p = 0.024), and n-6 PUFA (p = 0.047), along with increased yields of C20:3n6 (p = 0.019). The proportion of C20:0 (p = 0.097) and the yields of C18:2t6 (p = 0.059), C18:2c6 (p = 0.087), and n-6 PUFA (p = 0.093) showed an increasing trend. Conversely, the AOCP group significantly decreased proportions of C11:0 (p = 0.003), C14:0 (p < 0.001), C22:1 (p = 0.010), C20:2n6 (p = 0.021), C20:3n3 (p = 0.001), SFA (p = 0.002), and AI (p = 0.007), as well as decreased yields of C11:0 (p = 0.002) and AI (p = 0.007). Among the other FAs listed in Supplementary Table S2, only the proportion of C6:0 (p = 0.086) showed an increasing trend, while no significant differences were observed for the others (p > 0.05)
Milk performance
3.2
As shown in Table 4, compared with the CON group, the DMI (p < 0.001), MY (p < 0.001), EMY (p < 0.001), milk fat (p = 0.005), lactose (p < 0.001), SNF (p = 0.020), and TS (p = 0.001) contents in the AOCP group were increased. Additionally, yields of milk fat (p = 0.025), protein (p = 0.033), lactose (p < 0.001), SNF (p = 0.007), and TS (p = 0.010) also significantly increased. No significant differences were observed between the two groups in milk production efficiency, milk protein synthesis efficiency, or milk protein content (p > 0.05).
Nutrient digestibility
3.3
As shown in Table 5, the apparent digestibility of DM (p = 0.016), EE (p = 0.002), NDF (p = 0.029), ADF (p = 0.005) and energy metabolic rate (p = 0.010) increased in the AOCP group compared with the CON group. No significant differences in the apparent digestibility of CP, Ca, and P, as well as in energy digestibility, BV, and nitrogen metabolic rate existed between the CON and AOCP groups (p > 0.05).
Enzyme activities related to lipid metabolism in the serum
3.4
As shown in Table 6, compared with the CON group, the SCD (p < 0.001) activities was increased in the AOCP group, while the activities of ACC (p = 0.003) and HSL (p < 0.001) were declined. No significant differences in the activities of LPL, FAS, FADS1, and ELOVL5 between the two groups (p > 0.05).
Short-chain fatty acids in the rectal feces
3.5
As shown in Table 7, acetate (p = 0.002), butyrate (p = 0.002), total VFA (p = 0.003) levels and acetate-to-propionate (p < 0.001) ratio increased in the AOCP group, compared with the CON group. No significant difference was observed in propionate concentration between the CON and AOCP groups (p > 0.05).
Fecal bacterial richness, diversity and composition
3.6
A total of 684,335 effective 16S rRNA sequences were retrieved from 14 sequenced samples and 1980 OTUs were obtained by performing OTU clustering on nonrepetitive sequences according to 97% similarity. Rarefaction curves (Figure 1) showed that the current sequencing depth and sample size were sufficient to assess the microbial diversity, total species richness and core species number of rectal bacterial samples.
Rarefaction curves of OTU number in rectal microbiota. CON, control (basal diet); AOCP, Artemisia ordosica crude polysaccharide (basal diet with 0.5 g/kg DM AOCP).
The α-diversity analysis (Supplementary Table S3) revealed that the Shannon index was significantly higher in the AOCP group (5.69) than in the CON group (5.56) (p = 0.010), indicating that AOCP supplementation enhanced the diversity of the rectal microbial community. AOCP supplementation had no statistically significant impact on the α-diversity indices (Chao1, ACE, and Simpson) of the fecal microbiota compared with the CON group (p > 0.05), although certain numerical differences were noted. Specifically, both the Chao1 and ACE indices were higher in the AOCP group (1,600.77 and 1,598.07, respectively) than in the CON group (1,580.66 and 1,590.17 respectively). The coverage index of the sequencing results in each group reached 0.99, indicating that the coverage was sufficient to meet the requirements of subsequent analysis. The β-diversity analysis was performed to explore differences in the rectum microbial community between the two groups (Figure 2). The PCoA based on the Bray-Curtis distance matrix showed that, at the genus level, the points representing rectum microorganisms in the two groups, respectively, were significantly separated in different quadrants on the coordinate axis, which indicated that AOCP supplementation had a distinct effect on rectum microbial species and abundance. By performing a Venn diagram on the OTU samples with 97% identity, 167 and 108 unique OTUs were identified in the CON and AOCP groups, respectively (Figure 3).
Beta diversity analysis of rectal microbiota via principal coordinate analysis (PCoA). CON, control (basal diet); AOCP, Artemisia ordosica crude polysaccharide (basal diet with 0.5 g/kg DM AOCP).
Common and unique OTU number of rectal bacteria in the control group and AOCP group. CON, control (basal diet); AOCP, Artemisia ordosica crude polysaccharide (basal diet with 0.5 g/kg DM AOCP).
Significantly different rectal bacteria between the CON and AOCP groups
3.7
We analyzed changes in rectal bacterial communities between the two groups at the phylum and genus levels to characterize the effects of AOCP on rectal bacterial community structure in donkeys. As shown in Table 8, at the phylum level, the rectal flora primarily consisted of Firmicutes, Bacteroidota, Spirochaetota, Verrucomicrobiota, and Actinobacteriota. AOCP increased the relative abundance of phylum Bacteroidota (p < 0.05), and decreased the relative abundance of phylum Firmicutes (p < 0.05).
As shown in Table 9 and Figure 4, the top 20 bacterial genera (relative abundance >1%) were analyzed at the genus level, with unclassified_f_Lachnospiraceae being the most dominant genus. Compared to the CON group, AOCP supplementation significantly increased the abundance of unclassified_f_Lachnospiraceae and Prevotella (p < 0.05), while reducing the abundance of Christensenellaceae_R-7_group, Streptococcus and Lachnospiraceae_XPB1014 (p < 0.05). Furthermore, the significantly different abundant bacteria in the rectum between the two groups were identified through LEfSe analysis (Figure 5). The relative abundances of Prevotella, Phascolarctobacterium, Prevotellaceae_UCG-003, Ruminococcus, Marvinbryantia, and Eubacterium_hallii_group were increased in the AOCP group compared with the CON group (p < 0.05). In contrast, Christensenaceae_R-7, Lachnospiraceae_XPB1014_group, norank_f_Lachnospiraceae, norank_f_norank_o_RF39, Phoenicibacter, Akkermansia were decreased in the rectum with the AOCP supplementation (p < 0.05).
Community compositions of rectal bacteria at the genus level in the control and AOCP groups. CON, control (basal diet); AOCP, Artemisia ordosica crude polysaccharide (basal diet with 0.5 g/kg DM AOCP). The different colors of the bars represent different species, and the length of the bars represents the proportion of the species.
LEfSe analysis of differentially abundant rectal bacterial taxa between the CON and AOCP groups, using a threshold LDA score > 3 for statistical significance. CON, control (basal diet); AOCP, Artemisia ordosica crude polysaccharide (basal diet with 0.5 g/kg DM AOCP).
Correlation analysis of different rectal bacterial genera with milk fatty acid composition, nutrient digestibility, and lactation performance
3.8
The correlations between the significantly differential rectal bacteria and milk FA composition are presented in Figure 6. The proportion of C18:1c9 and MUFA was positively correlated with Eubacterium_hallii_group. The proportion of PUFA was negatively correlated with norank_f__Lachnospiraceae but was positively correlated with Marvinbryantia, Eubacterium_hallii_group. The proportion of DFA was negatively correlated with Phoenicibacter, norank_f__Lachnospiraceae, Christensenellaceae_R-7_group, but was positively correlated with Eubacterium_hallii_group, Marvinbryantia. The proportion of C20:5n3 was negatively correlated with Phoenicibacter, Lachnospiraceae_XPB1014_group, Christensenellaceae_R-7_group, norank_f__Lachnospiraceae, but was positively correlated with Prevotella, Marvinbryantia, Eubacterium_hallii_group, and Phascolarctobacterium.
*Pearson correlation analysis of differential bacteria genus and milk FA composition. Red indicates a positive correlation; the blue indicates a negative correlation. ***p ≤ 0.001, **0.001 < p ≤ 0.01, 0.01 < p ≤ 0.05. DFA, desirable fatty acid (C18:0 + UFA).
The correlations between the significantly differential rectal bacteria and nutrient digestibility are presented in Figure 7. EE was negatively associated with Christensenellaceae_R-7_group, norank_f__Lachnospiraceae, Lachnospiraceae_XPB1014_group, norank_f__norank_o__RF39, Phoenicibacter, Akkermansia but was positively associated with Ruminococcus, Marvinbryantia, Eubacterium_hallii_group, Phascolarctobacterium, Prevotellaceae_UCG-003, and Prevotella. DM was also negatively associated with Christensenellaceae_R-7_group and positively associated with Ruminococcus, Marvinbryantia, Eubacterium_hallii_group, Phascolarctobacterium, and Prevotellaceae_UCG-003. ADF was negatively associated with Christensenellaceae_R-7 and norank_f__Lachnospiraceae, but positively associated with Marvinbryantia, Eubacterium_hallii_group, Phascolarctobacterium, and Prevotellaceae_UCG-003. NDF was also negatively associated with Christensenellaceae_R-7 and norank_f__Lachnospiraceae, but positively associated with Eubacterium_hallii_group and Phascolarctobacterium. CP was positively associated with Ruminococcus.
*Pearson correlation analysis of differential bacteria genus with nutrient digestibility. Red indicates a positive correlation; the blue indicates a negative correlation. ***p ≤ 0.001, **0.001 < p ≤ 0.01, 0.01 < p ≤ 0.05.
The correlations between the significantly differential rectal bacteria and lactation performance are presented in Figure 8. Milk yield was negatively associated with Phoenicibacter, Akkermansia, Christensenellaceae_R-7_group, norank_f__Lachnospiraceae, norank_f__norank_o__RF39 but was positively associated with Ruminococcus, Marvinbryantia, and Prevotella. Milk protein was negatively associated with Phoenicibacter. Milk fat was negatively associated with norank_f__Lachnospiraceae but was positively associated with Ruminococcus. Milk lactose was negatively associated with Christensenellaceae_R-7_group, norank_f__Lachnospiraceae, norank_f__norank_o__RF39 but was positively associated with Eubacterium_hallii_group.
*Pearson correlation analysis of differential bacteria genus with lactation performance. Red indicates a positive correlation; the blue indicates a negative correlation. ***p ≤ 0.001, **0.001 < p ≤ 0.01, 0.01 < p ≤ 0.05.
Discussion
4
Donkey milk is characterized by low fat content yet high levels of essential fatty acids, with significantly higher PUFA concentrations compared to bovine or caprine milk (Wang et al., 2022). In our study, AOCP supplementation significantly elevated the levels of C18:1c9, C18:2c6, C20:5n3, MUFA, PUFA, and DFA beneficial to human health in donkey milk, thereby optimizing the FA profile. A similar trend in FA composition was observed in blood. However, the specific mechanisms underlying AOCP-mediated modulation of the FA profile in donkey milk remain unclear. Studies have demonstrated that norank_f__Lachnospiraceae participates in biohydrogenation (BH) processes (Zou et al., 2025). In the present study, norank_f_Lachnospiraceae was significantly enriched in the CON group relative to AOCP group, suggesting that AOCP may exert a suppressive effect on this BH-related bacterial genus. Spearman correlation analysis revealed that C20:5n3, DFA, and PUFA were negatively correlated with norank_f_Lachnospiraceae. These findings suggest that the elevated levels of C20:5n3, DFA, and PUFA following AOCP supplementation may be partially attributed to the observed inhibition of BH-related bacterial genera. However, as this correlative relationship was not directly verified in the present study, further research is essential to establish a definitive causal link. C16:0 in the mammary gland acts as a key limiting factor for the enhancement of milk fat yield (Benoit et al., 2024). The FAs involved in the synthesis of milk fat originate from two primary sources: de novo synthesis and exogenous uptake by mammary epithelial cells. Medium- and short-chain FAs (<16 carbons) along with approximately 50% of the C16:0 are synthesized de novo by mammary epithelial cells using acetate and butyrate as a substrate (Urrutia et al., 2019; Qi et al., 2014), and they constitute nearly half of the total FA utilized in milk fat synthesis. In contrast, long-chain FAs (>16 carbons), as well as about 50% of the C16:0 present in milk fat, are directly absorbed from the bloodstream by mammary epithelial cells (Hu et al., 2024). The Eubacterium hallii group is a bacterial group exhibiting butyrate-producing, cellulose-degrading, and antimicrobial properties (Engels et al., 2016; Song et al., 2014). In the present study, AOCP supplementation increased the abundance of the Eubacterium hallii group, elevated the production of acetate and butyrate, and concurrently raised milk fat content and C16:0 levels. These results suggest that AOCP supplementation could enhance de novo synthesis of C16:0 and milk fat synthesis by boosting acetate and butyrate levels, potentially through increasing the abundance of Eubacterium hallii group. However, these functional connections remain to be verified.The observed increase in C18:1c9 and MUFA levels may be attributed to enhanced FA desaturation mediated by AOCP. This mechanism is further supported by the corresponding elevation in SCD activity, which catalyzes a key step in MUFA synthesis. P/S is an important indicator for assessing dietary nutritional value, and the recommended value of P/S is 0.45 (Bouzaida et al., 2021), and greater than 0.45 is better. For cardiovascular protection and prophylaxis against atherosclerosis, the value of AI in foods must be lower than 1.0 (Frunză et al., 2025). In the present study, AOCP supplementation enhanced the P/S ratio, elevated DFA levels, and concurrently reduced the AI. These findings indicate that AOCP supplementation may optimize the FA profile of milk and enhance the content of FAs beneficial to human health. However, to date, no studies have reported the impact of AOCP on donkey milk fat quality. The present study is limited by a relatively small sample size of experimental animals and a lack of functional validation for key differential bacterial genera, warranting further investigation and exploration.
Current research on the effects of dietary AOCP supplementation on lactation performance in lactating donkeys remains limited. This study demonstrated that 0.5 g/kg DM AOCP supplementation significantly increased MY and elevated the production of milk fat, protein, lactose, TS, and SNF. The improvements may be partially attributed to enhanced nutrient digestion and metabolism, including increased digestibility of DM, EE, NDF, and ADF, as well as improved energy metabolic rate and DMI in lactating donkeys. As indicated previously, the underlying mechanism likely involves the increased abundance of the Eubacterium hallii group and elevated SCFA levels. Furthermore, the enhanced milk production performance is also linked to the increased abundance of other SCFA-producing bacteria. For instance, Prevotella efficiently degrades dietary fiber, primarily yielding acetate and succinate (Zhang et al., 2023). Symbiotic bacteria then convert succinate into propionate, which serves as a substrate for gluconeogenesis. This pathway generates glucose required for lactose synthesis. Additionally, Ruminococcus degrades fibrous substances, such as resistant starch, producing acetate and butyrate while enhancing intestinal barrier function (Crost et al., 2018). Consequently, the proliferation of these SCFA-producing bacteria increases rectal SCFA concentrations, elevates milk fat and lactose yields, and ultimately enhances milk production in donkeys through improved nutrient utilization. In our study, Prevotella showed positive correlations with EE digestibility and milk yield. Ruminococcus was positively correlated with the digestibility of DM, EE, and CP, as well as milk yield and milk fat content. These associations suggest the potential roles of these genera in enhancing nutrient utilization. In contrast, AOCP supplementation significantly reduced the relative abundance of opportunistic pathogens. Specifically, the relative abundance of Streptococcus and norank_f_Lachnospiraceae was significantly inhibited. Streptococcus is a Gram-positive genus known to induce systemic diseases such as meningitis and septicemia in monogastric animals (Lun et al., 2007). Norank_f_Lachnospiraceae has been reported for its positive correlation with uremic toxins and inflammatory markers (Hong et al., 2023). By suppressing these bacteria, AOCP may reduce energy expenditure on immune-metabolic processes, thereby potentially redirecting metabolic resources toward lactation. However, the specific mechanisms underlying this metabolic shift, including possible modulation of inflammatory pathways, require further comprehensive investigation.
Interestingly, although AOCP supplementation significantly increased the yields of milk protein, no significant increase in milk protein content was observed compared to the CON group. This indicates that the improvement in milk protein yield is mainly due to the overall increase in MY, rather than to a specific elevation in the protein content. The lack of change in protein content, together with the absence of improvement in milk protein synthesis efficiency, suggests that AOCP supplementation may not directly enhance mammary protein synthesis or improve the utilization of amino acids for protein production. Instead, the benefits appear to be more closely linked to enhancements in energy metabolism and nutrient partitioning directed toward general milk production and fat synthesis. This differential response underscores the specificity of the metabolic pathways modulated by AOCP. However, at present, there are few relevant studies, and the exact reasons need to be further explored in the future.
In summary, AOCP supplementation improved milk performance in lactating donkeys, which may be partially attributed to the optimization of intestinal bacterial structure. Such optimization is featured by an increased relative abundance of beneficial bacteria (e.g., Eubacterium hallii group, Ruminococcus, and Prevotella), as well as a reduced relative abundance of potentially pathogenic bacteria (e.g., Streptococcus, norank_f__Lachnospiraceae). However, that these inferences are drawn primarily from correlation analyses and have not been functionally validated. Therefore, further studies with larger sample sizes are necessary to corroborate these findings.
Conclusion
5
In conclusion, supplementation with 0.5 g/kg DM AOCP represents a novel nutritional strategy that may enhance milk production and milk fat yield, while also increasing the levels of C18:1c9, C18:2c6, and C20:5n3, as well as the U/S and P/S ratios in donkey milk. These improvements appear to be primarily mediated through enhanced digestion and metabolism of nutrients, modulation of enzymes related to lipid metabolism, and increased relative abundance of SCFA-producing bacteria. The optimized AOCP dosage established in this study provides a sustainable and eco-friendly feed additive for donkey farming, with the potential to enhance the economic viability of the dairy donkey industry. However, due to the limitation of a small sample size, future studies are needed to elucidate the exact mechanism by which AOCP regulates milk FA composition, with a focus on omics approaches such as lipid metabolomics and milk proteomics.
The reference list from the paper itself. Each links out to its DOI / PubMed record.
- 1Amirabadi Farahani T.Amanlou H.Farsuni N. E.Kazemi-Bonchenari M. (2019). Interactions of protein levels fed to Holstein cows pre- and postpartum on productive and metabolic responses. J. Dairy Sci. 102, 246–259. doi: 10.3168/jds.2018-14575, PMID: 30391172 · doi ↗ · pubmed ↗
- 2Benoit A. C.Dos Santos Neto J. M.Lock A. L. (2024). Mammary gland responses to altering the supply of de novo fatty acid substrates and preformed fatty acids on the yields of milk components and milk fatty acids. J. Dairy Sci. 107, 10653–10666. doi: 10.3168/jds.2024-24982, PMID: 39122149 · doi ↗ · pubmed ↗
- 3Bouzaida M. D.Resconi V. C.Gimeno D.Romero J. V.Calanche J. B.Barahona M.. (2021). Effect of dietary grape pomace on fattening rabbit performance, fatty acid composition, and shelf life of meat. Antioxidants (Basel) 10:795. doi: 10.3390/antiox 10050795, PMID: 34067887 PMC 8155864 · doi ↗ · pubmed ↗
- 4Cimmino F.Catapano A.Villano I.Di Maio G.Petrella L.Traina G.. (2023). Invited review: human, cow, and donkey milk comparison: focus on metabolic effects. J. Dairy Sci. 106, 3072–3085. doi: 10.3168/jds.2022-22465, PMID: 36894420 · doi ↗ · pubmed ↗
- 5Crost E. H.Le Gall G.Laverde-Gomez J. A.Mukhopadhya I.Flint H. J.Juge N. (2018). Mechanistic insights into the cross-feeding of ruminococcus gnavus and ruminococcus bromii on host and dietary carbohydrates. Front. Microbiol. 9:2558. doi: 10.3389/fmicb.2018.02558, PMID: 30455672 PMC 6231298 · doi ↗ · pubmed ↗
- 6Engels C.Ruscheweyh H. J.Beerenwinkel N.Lacroix C.Schwab C. (2016). The common gut microbe Eubacterium hallii also contributes to intestinal propionate formation. Front. Microbiol. 7:713. doi: 10.3389/fmicb.2016.00713, PMID: 27242734 PMC 4871866 · doi ↗ · pubmed ↗
- 7FrunzăG.Ciobanu M. M.Murariu O. C.Radu-Rusu R. M.Boișteanu P. C. (2025). The fatty acid content, health lipid indices, and instrumental, histological, and sensory quality of hare meat (Lepus europaeus Pallas). Foods 14:310. doi: 10.3390/foods 14020310, PMID: 39856976 PMC 11764587 · doi ↗ · pubmed ↗
- 8Guo Y.Yin G.Hui F.Guo X.Shi B.Zhao Y.. (2024). Effects of dietary energy level on antioxidant capability, immune function and rectal microbiota in late gestation donkeys. Front Microbiol. 15:1308171. doi: 10.3389/fmicb.2024.130817138414765 PMC 10896733 · doi ↗ · pubmed ↗