The promoter T-413A variant and elevated enzyme levels of heme oxygenase-1 associated with an increased risk of polycystic ovarian syndrome
Qiuyi Wang, Jiagui Liang, Qingqing Liu, Hongwei Liu, Huai Bai, Wei Huang, Ping Fan

TL;DR
A genetic variant and higher levels of a stress-related enzyme are linked to a higher risk of polycystic ovarian syndrome in Chinese women.
Contribution
The study identifies a specific HMOX1 genetic variant and enzyme levels as risk factors for PCOS in a Chinese population.
Findings
The HMOX1 rs2071746T/A SNP is associated with increased PCOS risk in multiple genetic models.
Elevated HMOX1 levels are linked to a slight but significant increase in PCOS risk.
The TT/SS combined genotype of HMOX1 variants is associated with higher PCOS risk.
Abstract
Oxidative stress and metabolic disorders significantly contribute to the development of polycystic ovarian syndrome (PCOS). Heme oxygenase-1 (HMOX1) plays a key role in the degradation of heme and the regulation of oxidative stress, ferroptosis, and glycolipid metabolism. This study explored the relationship between HMOX1 promoter T-413A single nucleotide polymorphism (SNP, rs2071746), (GT)n dinucleotide repeat variant (rs3074372), plasma HMOX1 levels, and the risk of PCOS in Chinese women. This case-control study included 1092 women diagnosed with PCOS and 805 controls. The (GT)n and rs2071746 polymorphisms were identified using polymerase chain reaction amplification, followed by capillary electrophoresis or restriction fragment length polymorphism. HMOX1 levels and clinical, metabolic, hormonal, and oxidative stress indices were analyzed. The HOMX1 rs2071746T/A SNP was associated…
Genes, proteins, chemicals, diseases, species, mutations and cell lines named across the full text — each resolved to its canonical identifier and authoritative record.
Click any figure to enlarge with its caption.
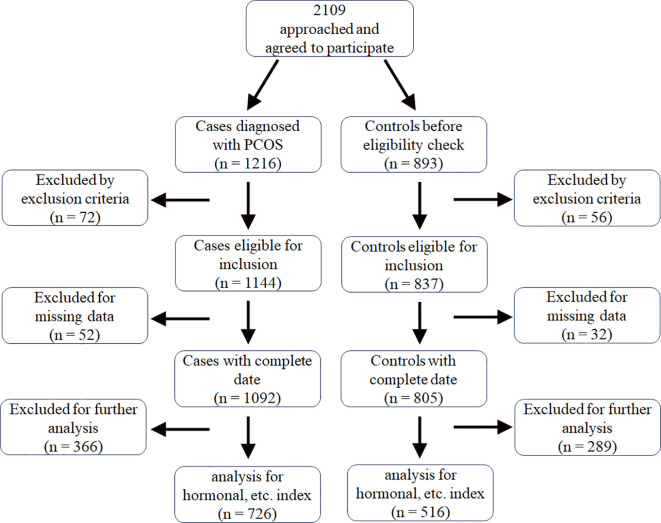 Figure 1
| Controls (n = 805) | PCOS (n = 1092) |
|
| |
|---|---|---|---|---|
| Age (years) | 28.25 ± 4.10 | 25.10 ± 4.15 | <0.001 | |
| BMI (kg/m2) | 21.15 ± 2.81 | 23.04 ± 4.14 | <0.001 | |
| WC (cm) | 73.64 ± 8.08 | 79.15 ± 11.07 | <0.001 | <0.001 |
| Waist-to-hip ratio | 0.81 ± 0.60 | 0.85 ± 0.07 | <0.001 | <0.001 |
| F-G score | 0.24 ± 0.72 | 1.74 ± 2.03 | <0.001 | <0.001 |
| Acne grade score | 0.13 ± 0.34 | 0.67 ± 0.90 | <0.001 | <0.001 |
| SBP (mmHg) | 112.38 ± 11.15 | 114.16 ± 10.61 | 0.001 | 0.315 |
| DBP (mmHg) | 73.33 ± 8.58 | 75.43 ± 8.75 | <0.001 | 0.003 |
| Mean ovarian volume (mL) | 7.36 ± 2.90 | 9.92 ± 4.04 | <0.001 | <0.001 |
| Hormonal levels* | ||||
| E2 (pmol/L) | 313.87 ± 324.44 | 275.17 ± 273.34 | 0.035 | 0.657 |
| TT (nmol/L) | 1.45 ± 0.52 | 2.26 ± 0.80 | <0.001 | <0.001 |
| SHBG (nmol/L) | 55.32 ± 27.19 | 32.63 ± 19.03 | <0.001 | <0.001 |
| FAI | 3.14 ± 1.89 | 9.53 ± 6.87 | <0.001 | <0.001 |
| LH (IU/L) | 7.05 ± 6.24 | 13.15 ± 8.05 | <0.001 | <0.001 |
| FSH (IU/L) | 6.55 ± 2.63 | 6.05 ± 2.10 | 0.001 | 0.015 |
| LH/FSH | 1.16 ± 1.13 | 2.24 ± 1.23 | <0.001 | <0.001 |
| Metabolic profile* | ||||
| Fasting Ins (pmol/L) | 60.37 ± 35.46 | 98.46 ± 72.40 | <0.001 | <0.001 |
| 2-h Ins (pmol/L) | 365.80 ± 270.73 | 715.01 ± 566.96 | <0.001 | <0.001 |
| Fasting Glu (mmol/L) | 5.23 ± 0.47 | 5.34 ± 0.84 | 0.003 | 0.861 |
| 2-h Glu (mmol/L) | 5.98 ± 1.27 | 7.21 ± 2.46 | <0.001 | <0.001 |
| HOMA-IR | 2.21 ± 1.30 | 3.79 ± 3.01 | <0.001 | <0.001 |
| TG (mmol/L) | 1.00 ± 0.54 | 1.41 ± 1.14 | <0.001 | <0.001 |
| TC (mmol/L) | 4.25 ± 0.72 | 4.43 ± 0.80 | <0.001 | <0.001 |
| HDL-C (mmol/L) | 1.51 ± 0.33 | 1.37 ± 0.34 | <0.001 | 0.002 |
| LDL-C (mmol/L) | 2.35 ± 0.64 | 2.60 ± 0.77 | <0.001 | <0.001 |
| TG/HDL-C | 0.73 ± 0.61 | 1.19 ± 1.37 | <0.001 | <0.001 |
| ApoA1 (g/L) | 1.46 ± 0.21 | 1.42 ± 0.21 | 0.001 | 0.752 |
| ApoB (g/L) | 0.75 ± 0.17 | 0.83 ± 0.20 | <0.001 | <0.001 |
| Oxidative stress parameters* | ||||
| TOS (nmol H2O2 Equiv./mL) | 11.41 ± 5.34 | 15.25 ± 10.31 | <0.001 | <0.001 |
| T-AOC (U/mL/min) | 14.51 ± 2.60 | 15.92 ± 3.51 | <0.001 | <0.001 |
| OSI | 0.79 ± 0.41 | 0.99 ± 0.76 | <0.001 | <0.001 |
| GSH (nmol/mL) | 1.11 ± 0.25 | 1.18 ± 0.25 | <0.001 | 0.005 |
| TOS/GSH | 10.50 ± 5.76 | 12.71 ± 9.33 | <0.001 | <0.001 |
| HMOX1 (μg/L) | 4.51 ± 2.41 | 5.02 ± 4.61 | 0.018 | 0.011 |
| Variants | Controls (n = 805) | PCOS (n = 1092) | Unadjusted | Adjusted | ||
|---|---|---|---|---|---|---|
| OR (95% CI) |
| OR (95% CI) |
| |||
| T-413A (rs2071746) | ||||||
| Genotype | ||||||
| AA | 173 (21.5%) | 193 (17.7%) | Referent | |||
| AT | 426 (52.9%) | 556 (50.9%) | 1.170 (0.919–1.489) | 0.201 | 1.140 (0.872–1.493) | 0.342 |
| TT | 206 (25.6%) | 343 (31.4%) | 1.493 (1.141–1.952) | 0.003 | 1.395 (1.033–1.883) | 0.030 |
|
| 0.233 | 0.456 | ||||
| Recessive | ||||||
| TT + AT | 632 (78.5%) | 899 (82.3%) | ||||
| AA | 173 (21.5%) | 193 (17.7%) | 1.275 (1.014–1.603) | 0.037 | 1.212 (0.936–1.570) | 0.144 |
| Dominant | ||||||
| TT | 206 (25.6%) | 343 (31.4%) | ||||
| AA + AT | 599 (74.4%) | 749 (68.6%) | 1.332 (1.086–1.632) | 0.006 | 1.272 (1.013–1.597) | 0.039 |
| Allele | ||||||
| A | 772 (48.0%) | 942 (43.1%) | ||||
| T | 838 (52.0%) | 1242 (56.9%) | 1.215 (1.067–1.382) | 0.003 | / | / |
| (GT)n repeat | ||||||
| Genotype | ||||||
| LL | 224 (27.8%) | 298 (27.3%) | Referent | |||
| SL | 422 (52.4%) | 542 (49.6%) | 0.965 (0.779–1.197) | 0.748 | 0.935 (0.736–1.189) | 0.584 |
| SS | 159 (19.8%) | 252 (23.1%) | 1.191 (0.915–1.551) | 0.193 | 1.134 (0.844–1.522) | 0.404 |
|
| 0.292 | 0.983 | ||||
| Recessive | ||||||
| LL + SL | 646 (80.2%) | 840 (76.9%) | ||||
| SS | 159 (19.8%) | 252 (23.1%) | 1.219 (0.975–1.524) | 0.082 | 0.842 (0.655–1.081) | 0.178 |
| Dominant | ||||||
| LL | 224 (27.8%) | 298 (27.3%) | ||||
| SS + SL | 581 (72.2%) | 794 (72.7%) | 0.973 (0.794–1.193) | 0.796 | 1.041 (0.827–1.309) | 0.733 |
| Allele | ||||||
| L | 870 (54.0%) | 1138 (52.1%) | ||||
| S | 740 (46.0%) | 1046 (47.9%) | 1.081 (0.950–1.229) | 0.239 | / | / |
Peer Reviews
No public reviews on file for this paper yet. If you reviewed it on a platform where reviews are public (OpenReview, ICLR, NeurIPS, ICML), you can paste yours below so the community can read it here.
Videos
No videos yet. Explain this paper in a talk, walkthrough, or lecture? Add one.
Taxonomy
TopicsHeme Oxygenase-1 and Carbon Monoxide · Paraoxonase enzyme and polymorphisms · Reproductive Biology and Fertility
Introduction
1
Polycystic ovarian syndrome (PCOS) is the leading endocrine-metabolic disorder among women of reproductive age, with a prevalence of 10–13% (1). Its clinical presentation is diverse and may include reproductive, dermatological, metabolic, and psychological symptoms such as irregular menstrual cycles, infertility, acne, hirsutism, obesity, insulin resistance, dyslipidemia, anxiety, depression, etc. (1, 2). PCOS can affect women throughout their lives and potentially lead to long-term complications, including type 2 diabetes (T2D), cardiocerebrovascular disease, and endometrial cancer. The exact etiology of PCOS remains unknown, making its treatment difficult (1, 3). Increasing evidence indicates that its etiology is complex, involving interactions between multiple predisposing genes, genetic epigenetics, and detrimental environmental factors (2, 4–6).
Heme oxygenase (HMOX) is the rate-limiting enzyme that catalyzes the breakdown of heme, resulting in the production of biliverdin (BV), carbon monoxide (CO), and free iron (Fe^2+^) (7, 8). BV is rapidly turned into bilirubin (BR) by BV reductase (8, 9). Heme and free Fe^2+^ are toxic owing to their oxidative properties; however, in the physiological state, free iron is swiftly sequestered by ferritin, ensuring a harmonious balance within the body (8). CO, BV, and BR possess vasodilator, antioxidant, and anti-inflammatory properties, but excessive accumulation of these products can be toxic (8, 10). The two main isomers of HMOX in humans, inducible HMOX1 (also known as HO-1) and constitutive HMOX2 (also known as HO-2), have similar structures and catalytic functions but are distributed in different tissues and exhibit distinct features (10). Low HMOX1 expression was observed in most tissues under normal conditions. However, its expression can be markedly increased in response to different pathophysiological stress conditions or stimulation factors (9, 11).
The HMOX1 is located on chromosome 22q13.1. Two genetic polymorphisms in the promoter of HMOX1, the (GT)n dinucleotide repeat variant (rs3074372) and rs2071746T/A single nucleotide polymorphism (SNP) (rs2071746), can affect the transcriptional activity of HMOX1 (11). These two polymorphisms are closely linked to certain diseases, including sensitivity to several cancers and coronary heart disease (11), cardiovascular events and mortality in patients undergoing hemodialysis (12), T2D (13), pre-eclampsia (14), chronic obstructive pulmonary disease (15), SARS-CoV-2 viremia in COVID-19 infection (16), and risk of encephalitis in HIV infection (17).
Oxidative stress and metabolic disorders significantly contribute to the pathophysiology and progression of PCOS (1, 18–21). Genetic variants of HMOX2 G554A and A-42G SNPs are associated with endocrine abnormalities and glycolipid metabolic irregularities in patients with PCOS (5). The levels of HMOX1 mRNA are higher in subcutaneous adipose tissue and granulosa cells (22, 23), but the concentrations of serum HMOX1 are lower in women with PCOS than those among control women (24). However, the association between HMOX1 polymorphisms and PCOS remains unclear. Therefore, we explored the relationship between HMOX1 (GT)n repeats and rs2071746T/A polymorphisms and the risk of PCOS. Additionally, we analyzed how these genetic variants affected plasma HMOX1 levels and various clinical and biochemical parameters in Southwest Chinese women.
Materials and methods
2
Study participants
2.1
This was a case-control study. All participants aged 17–40 years provided written informed consent and were recruited from the Reproductive Endocrinology Outpatient Department of the West China Second University Hospital between 2006 and 2024 (Figure 1). This study was approved by the Institutional Review Board of West China Second University Hospital, Sichuan University (2014–014 for P. Fan).
The process of recruitment and selction of the case and control group.
PCOS was diagnosed based on the revised 2003 Rotterdam European Society of Human Reproduction and Embryology/American Society for Reproductive Medicine consensus criteria, which include irregular menstrual cycles, oligo-ovulation, or anovulation (OA), biochemical and/or clinical hyperandrogenism (HA), and polycystic ovaries (PCOs) (25). Detailed definitions of HA, OA, and PCOs have been provided in previous articles (26–28). PCOS was diagnosed if a woman met at least two of the three criteria after ruling out other etiologies such as Cushing syndrome, congenital adrenal hyperplasia, and androgen-secreting tumors (1, 25). Both HA and OA are required in individuals aged < 20 years of age (1). Control women had regular menstrual cycles between 21–35 days, normal ovarian morphology on ultrasonography, and no biochemical or clinical signs of HA.
The participants were excluded if they had infections, cardiovascular diseases, liver or kidney diseases, autoimmune diseases, thyroid disorders, hypogonadism, hyperprolactinemia, premature ovarian insufficiency, endometriosis, or other malignancies. Additionally, the participants were excluded from the analysis when comparing oxidative stress and metabolic and hormonal parameters between groups/subgroups if they met any of the following criteria: (i) use of hormonal therapy and/or medications that influence glucose and lipid metabolism within 12 weeks before the study; (ii) smoking; (iii) being pregnant or in the luteal phase of their menstrual cycle; and/or (iv) having a fasting glucose (Glu) level of ≥7.0 mmol/L and/or a 2-hour plasma glucose after the glucose challenge (2-h Glu) level of ≥11.1 mmol/L in the control group.
Clinical indices, including waist circumference (WC), body mass index (BMI), waist-to-hip ratio, diastolic blood pressure (DBP), systolic blood pressure, severity of acne and hirsutism, and ovarian volume were assessed as previously described (27–29).
Blood samples were collected after fasting for 8–12 h. Blood cells were stored at 4°C, and plasma and serum aliquots were preserved at −80°C for later analysis. A 75g oral glucose tolerance test was conducted immediately after fasting blood sampling.
DNA purification and genotype measurements
2.2
Genomic DNA was purified from stored blood cells using a previously described method (30). (GT)n repeats in HMOX1 were determined using polymerase chain reaction (PCR) amplification and capillary electrophoresis. The forward primer with 6-carboxyfluorescein (FAM) was 5′-FAM-CCAGCTTTCTGGAACCTTCTG-3′, the reverse primer was 5′-GAAACAAAGTCTGGCCATAGGA-3′ (31). Samples were amplified using a touchdown PCR protocol (17). The products were then analyzed using a 3730xl DNA Analyzer (Applied Biosystems, Foster City, CA, USA) and GeneMapper 4.1 (Applied). Short repeats, with fewer than 27 GT repeats, were classified as S alleles, whereas long repeats, with at least 27 GT repeats, were classified as L alleles (12). For genotyping the rs2071746 SNP, we used PCR and restriction fragment length polymorphism method with a mismatched primer set (the forward primer: 5′-GTTCCTGATGTTGCCCACCAAGC-3′; the reverse primer: 5′-CTGCAGGCTCTGGGTGTGATTTTG-3′). The PCR products of the rs2071746T/A SNP (151 bp) were then digested with HindIII (New England Biolabs, Ipswich, MA, USA), resulting in 20 and 131 bp fragments with the T allele and a whole 151-bp product with the A allele. The results were verified by repeating the genotyping of > 30% of the randomly selected samples, yielding 100% concordance.
Analysis of HMOX1, oxidative stress, hormonal, and metabolic indices
2.3
Plasma HMOX1 concentrations were measured using ELISA kits (Elabscience Biotechnology Co., Ltd., Wuhan, China).
Estradiol, TT, luteinizing hormone (LH), follicle-stimulating hormone (FSH), sex hormone binding globulin (SHBG), plasma insulin (Ins) and Glu levels, triglycerides (TG), total cholesterol (TC), high-density lipoprotein cholesterol (HDL-C), low-density lipoprotein cholesterol (LDL-C), apolipoprotein (apo) A1, and apoB concentrations, total antioxidant capacity (T-AOC), glutathione (GSH), total oxidant status (TOS), and oxidative stress index (OSI) were also analyzed as previously described in other studies (20, 21, 28). The homeostatic model assessment of insulin resistance (HOMA-IR) and free androgen index (FAI) were calculated as previously described (18, 28) using the following formulas:
Statistical analysis
2.4
Data are presented as mean ± standard deviation. We used analysis of variance or independent sample t-tests for normally distributed variables and the Mann–Whitney U test for non-normally distributed variables. Analysis of covariance was used to evaluate differences in clinical and biochemical indices after adjusting for variations in age, BMI, and participant recruitment year. Chi-squared (χ²) analysis was performed to evaluate deviations in genotypic distribution from Hardy–Weinberg equilibrium and to compare the frequencies of genotypes and alleles between two groups. The Spearman’s correlation coefficient was used to assess the relationship between HMOX1 levels and other parameters. Differences were considered statistically significant if the P value was <0.05. Data were analyzed using the Statistical Program for Social Sciences (SPSS) 21.0 (IBM SPSS Statistics, IBM Corporation).
Power values were calculated according to the disease allele frequency of the rs2071746T/A SNP in HMOX1 and the sample size (prevalence = 0.12, significance level = 0.05) using the Genetic Association Study Power Calculator (http://csg.sph.umich.edu/abecasis/gas_power_calculator/index.html).
Using the online SNPStats (https://www.snpstats.net/start.htm), we assessed the linkage disequilibrium between two genetic polymorphic loci in view of the D’ parameter.
Results
3
Clinical and biochemical characteristics of the participants
3.1
Owing to the significant discrepancies in BMI and age between the PCOS and control groups (Table 1), and the relatively long recruitment period of participants between 2006 and 2024 in this study, we adjusted for these three confounding factors in our subsequent analyses.
Table 1 shows that the PCOS group had significantly higher acne grade scores, F-G scores, average ovarian volumes, DBP, WC, waist-to-hip ratio, TT, LH, LH/FSH ratio, FAI, fasting Ins, HOMA-IR, 2-h Glu and 2-hour insulin after the glucose challenge (2-h Ins), LDL-C, TC, TG, TG/HDL-C ratio, apoB, TOS, T-AOC, GSH, OSI, TOS/GSH ratio, and plasma HMOX1 levels, but lower serum FSH, SHBG, and HDL-C concentrations than the control group (P < 0.05).
We further compared the plasma HMOX1 levels in lean (BMI < 23 kg/m²) and overweight/obese (BMI ≥ 23 kg/m² and/or waist circumference > 80 cm) subgroups after adjusting for age, BMI, and recruitment period of participants. The results showed that the HMOX1 levels were higher in the lean PCOS subgroup (n = 339) than in the lean control subgroup (n = 382) (5.00 ± 5.00 vs. 4.48 ± 2.36 µg/L, P = 0.034), but no statistical significance in the overweight/obese PCOS subgroup (n = 387) than in the overweight/obese control subgroup (n = 134) (5.04 ± 4.29 vs. 4.48 ± 2.15 µg/L, P = 0.115).
Correlation of HMOX1 levels with clinical and biochemical indicators and risk of PCOS
3.2
The Spearman’s correlation analysis showed that plasma HMOX1 levels were positively correlated with 2-h Glu, WC, fasting Ins, HOMA-IR, TG/HDL-C ratio, BMI, 2-h Ins, TC, fasting Glu, FAI, T-AOC, apoB, and WHR in patients with PCOS (r = 0.138, 0.132, 0.132, 0.129, 0.127, 0.118, 0.105, 0.093, 0.092, 0.087, 0.085, 0.080, and 0.079, respectively; P < 0.05). Although statistically significant, the correlations between HMOX1 and PCOS traits were quantitatively modest.
Binary logistic regression analysis demonstrated that elevated HMOX1 levels were associated with an increased risk of PCOS after correcting for differences in participant recruitment year, age, and BMI (odds ratio [OR] = 1.053, 95% confidence interval [CI]: 1.008–1.100, P = 0.019).
Distributions of HOMX1 rs2071746T/A and (GT)n genotypes and alleles
3.3
Table 2 summarizes the genetic models for the rs2071746T/A and (GT)n repeat polymorphisms in HOMX1. The distribution of genotypes for both polymorphisms was consistent with Hardy–Weinberg equilibrium in women with and without PCOS (P > 0.05).
The frequencies of the TT genotype and T allele in the HOMX1 rs2071746T/A SNP were significantly higher in the PCOS group than those in the control group. The OR indicated that this difference was statistically significant for the dominant model, the recessive model, and the TT vs. AA genotype model, and the allele model (all P < 0.05). After adjusting for age, BMI, and recruitment year of participants, the dominant genetic model remained statistically significant in the binary logistic regression model (OR = 1.272, 95% CI: 1.013–1.597, P = 0.039) and the TT genotype remained a significant predictor for PCOS in a multinomial logistic regression model, with the AA genotype as the reference (OR = 1.395, 95% CI: 1.033–1.883, P = 0.030). The genetic association power is 0.984 for rs2071746T/A SNP. No statistically significant differences were observed between the two groups for the (GT)n repeat polymorphism of HMOX1 when analyzed using different genetic models (P > 0.05; Table 2).
The combined genotypes of HMOX1 rs2071746T/A and (GT)n polymorphisms exhibited a significant difference in frequency between patients with PCOS and controls (P = 0.031; Supplementary Table 1). The TT/SS was a risk factor for PCOS (OR = 1.442, 95% CI: 1.021–2.035, P = 0.037) in a multinomial logistic regression model using the AA/LL combined genotype as the reference, with participant recruitment year, age, and BMI as covariates. Moderate linkage disequilibrium was observed between the rs2071746T/A and (GT)n polymorphisms (D’= 0.8517, r^2^ = 0.5539).
Effects of genotypes on clinical and biochemical indicators
3.4
We analyzed the effect of HMOX1 rs2071746T/A and (GT)n genetic variants on plasma HMOX1 levels and clinical and biochemical parameters in women with and without PCOS.
Supplementary Table 2 shows that patients with the AT genotype of HMOX1 rs2071746T/A SNP had a greater TOS/GSH ratio than those with the TT genotype (P = 0.028). The controls with the TT genotype exhibited a lower acne grade score than those with the AA genotype (P = 0.043) and lower HDL-C levels (P = 0.038) than those with the AT genotype; whereas the controls with the AT genotype exhibited lower GSH levels (P = 0.022) than those with the AA genotype.
The same parameters were analyzed for different genotypes of HMOX1 (GT)n repeat polymorphism (Supplementary Table 3). Patients with the LL genotype displayed a lower waist-to-hip ratio and TT levels (P < 0.05) than those with the SS genotype. The controls with the LL genotype exhibited a lower BMI than those with the SS and SL genotypes (P < 0.05). The controls with the SL genotype showed higher FAI (P = 0.019) than those with the SS genotype.
No statistically significant differences in plasma HMOX1 levels were observed between the different genotypes of HMOX1 rs2071746T/A and (GT)n genetic variants in the control and PCOS groups (P > 0.05; Supplementary Tables 2, 3).
Discussion
4
For the first time, we demonstrated that the TT genotype and T allele of the rs2071746T/A SNP are associated with an increased risk of PCOS in Chinese women. We also proved that the TT/SS combined genotype of the rs2071746T/A and (GT)n repeat variants is a risk factor for PCOS. Furthermore, we found that plasma HMOX1 levels were significantly higher in patients with PCOS than those in the control women, and elevated HMOX1 levels were related to a slight but significant increase in the risk of PCOS, suggesting that patients with PCOS have a compensatory increase in HMOX1 levels. HMOX1 rs2071746T/A and (GT)n repeat polymorphisms significantly affected BMI, waist-to-hip ratio, TT, FAI, acne grade score, HDL-C, GSH, and TOS/GSH ratio, but not plasma HMOX1 levels among the PCOS and/or control participants, supporting that the two variants may be involved in obesity, endocrine abnormalities, oxidative stress, and metabolic disorders.
Oxidative stress, metabolic disorders, and iron homeostasis imbalance play significant roles in the occurrence and progression of PCOS (18–21, 32). HMOX catalyzes the degradation of heme and is crucial for controlling the dynamic equilibrium of heme and its products (BV, BR, CO, and Fe^2+^) (7, 8). In addition to the recovery of Fe^2+^ from heme, HMOX participates in the regulation of multiple signaling pathways via its products, BV, CO, and Fe^2+^, as well as its substrate, heme (8). Under physiological conditions, low HMOX1 expression is found in most tissues, except in cells of the reticuloendothelial system (8, 10). Unlike the constitutive isoform HMOX2, which is barely regulated at the transcriptional and translational levels (5, 8), HMOX1 can be rapidly induced under various stress conditions (7, 8, 10, 11). BV and BR are important endogenous antioxidants and cellular signaling molecules that play significant roles in regulating immunity and glycolipid metabolism, and CO is a gaseous mediator with vasodilatory, anti-inflammatory, anti-proliferative, and anti-apoptotic properties, while heme and free Fe^2+^ can facilitate the production of reactive oxygen species (7, 8, 10). Therefore, besides its cytoprotective effects, HMOX1 induction may also be involved in the development of certain diseases. Several studies have indicated that genetic overexpression or chemical induction of HMOX1 can protect against hypertension, cardiovascular diseases, metabolic conditions, and kidney diseases (33–35). Increased HMOX1 activity may promote oxidative stress by increasing free intracellular iron and accelerating the consumption of cytosolic NADPH, thereby contributing to chronic inflammation, ferroptosis, and cell injury (8). It has been reported that elevated plasma HMOX1 levels in individuals with T2D are associated with a higher disease risk (36). However, another study showed that low serum HMOX1 levels in non-obese women are an independent risk factor for PCOS (24). In this study, we found that plasma HMOX1 levels were significantly higher in the PCOS group compared to the control group, and the lean PCOS subgroup compared to the lean control subgroup. Furthermore, elevated HMOX1 levels were related to an increased risk of PCOS. The possible reasons for the inconsistent results of HMOX1 levels in PCOS may be discrepancies in the sample size and study population. Contrary to the report of lower HMOX1 concentrations in PCOS (24), our finding of elevated HMOX1 levels could represent a protective compensatory response to various chronic unfavorable stimuli in PCOS, aligning with the canonical role of HMOX1 as an oxidative stress sensor.
Increased oxidative stress in PCOS, as shown in this study, can enhance HMOX1 transcription by activating nuclear factor erythroid 2-related factor 2 transcription factor (11, 37). Patients with PCOS have iron overload, abnormal heme metabolism, and chronic inflammation due to chronic oligomenorrhea, excessive androgen, and compensatory hyperinsulinemia (32, 38). High levels of heme and activation of the inflammatory factor nuclear factor kappa B can promote the expression of HMOX1 (11, 33). The HMOX1 and its downstream metabolites, including CO, BV, and BR, may play a protective role through their antioxidant, anti-inflammatory, and vasodilator functions (8, 10). However, the sustained induction of HMOX1 and the iron overload may paradoxically dysregulate ferroptosis through iron-mediated production of peroxidized lipids, potentially contributing to ovarian dysfunction. In addition to transcriptional regulation, HMOX1 activity is regulated by critical protein-protein interactions (PPIs) and post-translational modifications (39). PPIs affect the stability, oligomerization, subcellular localization, and function of HMOX1 (39–42). The post-translational modifications, such as phosphorylation, acetylation, and ubiquitination, also play an important role in regulating the level and activity of HMOX1 (43–45). In a word, the possible reasons and mechanisms for elevated HMOX1 levels are complex in PCOS. Further studies are needed to explain this phenomenon and its exact pathophysiological mechanisms.
Genetic variants in the promoter of HMOX1 may affect the expression of HMOX1 (11), thereby affecting the incidence and progression of diseases. The A allele of HMOX1 rs2071746T/A SNP is associated with a higher transcription activity of HMOX1 (11, 46). A meta-analysis revealed a lower susceptibility to coronary heart disease in individuals carrying the A allele (11). The AA genotype increases the occurrence of hypertension in the Japanese women (47), but decreases the risk of ischemic heart disease in the Japanese population (48). The T allele of the rs2071746T/A variant is a risk factor for the development of esophageal varices in patients with cirrhosis (46), and the TT genotype is more likely to cause proteinuria in Korean patients with T2D (49) and SARS-CoV-2 viremia in COVID-19 infection (16). Our findings indicated that women with the TT genotype and T allele have a higher risk of developing PCOS. Moreover, we found that this genetic polymorphism may contribute to oxidative stress, hyperandrogenism status, and metabolic disorders through influencing TOS/GSH ratio, GSH and HDL-C levels, and acne grade score in the study population. However, we did not observe significant differences in plasma HMOX1 levels according to different genotypes of the rs2071746T/A SNP, suggesting that this genetic variant may not be a key factor affecting HMOX1 expression in the study population.
Of the polymorphisms observed in the HMOX1 promoter region, the (GT)n repeat variant has been extensively studied (11, 13). The range of (GT)n repeat numbers is 10–50 (17), and the number of repeat lengths shows a bimodal distribution, with peaks at (GT)23 and (GT)30 repeats in East Asian and Caucasian populations, and a trimodal form, with crest values at (GT)23, (GT)30, and (GT)39 among African-Americans (11). Generally, the short (S) allele is defined as the number of (GT)n repeats < 25 or 27, and the long (L) allele is defined as the number of (GT)n repeats ≥ 25 or 27 in different reports (11–13, 49). The S alleles are linked to increased transcriptional activity compared with the L alleles (11, 13), and individuals with the SS genotype of the (GT)n variant have higher levels of HMOX1 mRNA than those with the LL genotype (50). Individuals with the S allele or SS genotype have a reduced risk of coronary heart disease (11), T2D (13), rheumatoid arthritis (50), and encephalitis in HIV infection (17), but an increased risk of melanoma (51). Whereas individuals with the L allele or LL genotype have an increased risk of hypertension (52), chronic obstructive pulmonary disease (15), and preeclampsia (late-onset and non-severe form) (14). Our study revealed no significant differences were observed between the PCOS and control groups based on different genetic models. However, this polymorphism may be involved in obesity and endocrine disorders, probably by affecting waist-to-hip ratio, BMI, TT levels, and FAI in the study population. Moreover, we did not observe significant differences in plasma HMOX1 levels according to different genotypes of the (GT)n repeat variant.
Additionally, in this study, a moderate linkage disequilibrium was observed between the rs2071746T/A and (GT)n repeat polymorphisms. The TT/SS combined genotype of the two genetic polymorphisms was a risk factor for PCOS. However, we did not observe significant differences in the HMOX1 levels according to the different combined genotypes in the control and PCOS groups (P > 0.05, data not indicated). Several studies have shown that HMOX1 expression is also controlled by genetic polymorphisms (11). The (GT)n and rs2071746T/A polymorphisms may be involved in 5’-UTR alternative splicing of the HMOX1 primary transcript, which may affect translational efficiency and mRNA stability, and thus regulate the translational process of HMOX1 (53). Therefore, a more detailed and systematic investigation of the correlation between genotype and gene expression, along with in vitro studies, is required to clarify the potential mechanism.
The present study has some limitations. First, we did not measure the levels of BV, BR, and iron, which are critical downstream products of HMOX1 enzymatic activity; this could provide further evidence to reveal the relationships between HMOX1 genetic variants, HMOX1 levels, and PCOS and the underlying mechanism. Second, we did not evaluate oxidative stress and hormonal and metabolic indices because of confounding factors in some participants, which could have had an effect on the statistical effectiveness of these parameters. Third, lifestyle factors (e.g., dietary patterns, physical activity levels) and longitudinal treatment histories were not collected during enrollment, preventing us from adjusting for differences in these potential confounders in our analyses.
In conclusion, this study indicates that the HMOX1 rs2071746T/A SNP is associated with the risk of PCOS, and that the T allele, TT genotype, and its coexistence with the SS genotype of the (GT)n repeat variant are genetic risk factors for PCOS among Chinese women. We further demonstrated that patients with PCOS have higher plasma HMOX1 concentrations and that elevated HMOX1 levels are associated with an increased risk of PCOS. We found that the HMOX1 rs2071746T/A and (GT)n repeat polymorphisms may contribute to obesity, oxidative stress, endocrine abnormalities, and metabolic disorders. Our findings suggest that induction of the heme-degrading enzyme HMOX1 and its genetic polymorphisms in the promoter may be involved in the pathophysiology of PCOS.
The reference list from the paper itself. Each links out to its DOI / PubMed record.
- 1Teede HJ Tay CT Laven J Dokras A Moran LJ Piltonen TT . Recommendations from the 2023 international evidence-based guideline for the assessment and management of polycystic ovary syndrome. Fertil Steril. (2023) 120:767–93. doi: 10.1016/j.fertnstert.2023.07.025, PMID: 37589624 · doi ↗ · pubmed ↗
- 2Escobar-Morreale HF . Polycystic ovary syndrome: definition, aetiology, diagnosis and treatment. Nat Rev Endocrinol. (2018) 14:270–84. doi: 10.1038/nrendo.2018.24, PMID: 29569621 · doi ↗ · pubmed ↗
- 3Joshi A . PCOS stratification for precision diagnostics and treatment. Front Cell Dev Biol. (2024) 12:1358755. doi: 10.3389/fcell.2024.1358755, PMID: 38389707 PMC 10881805 · doi ↗ · pubmed ↗
- 4Palumbo M Della Corte L Colacurci D Ascione M D'Angelo G Baldini GM . PCOS and the genome: is the genetic puzzle still worth solving? Biomedicines. (2025) 13:1912. doi: 10.3390/biomedicines 13081912, PMID: 40868166 PMC 12383298 · doi ↗ · pubmed ↗
- 5Zhang X Li S Liu H Bai H Liu Q Yang C . Heme oxygenase 2 genetic variants alter hormonal and metabolic traits in polycystic ovary syndrome. Endocr Connect. (2024) 13:e 230463. doi: 10.1530/EC-23-0463, PMID: 38251965 PMC 10895317 · doi ↗ · pubmed ↗
- 6Merkin SS Phy JL Sites CK . Yang D Environmental determinants of polycystic ovary syndrome. Fertil Steril. (2016) 106:16–24. doi: 10.1016/j.fertnstert.2016.05.011, PMID: 27240194 · doi ↗ · pubmed ↗
- 7Haines DD . Tosaki A heme degradation in pathophysiology of and countermeasures to inflammation-associated disease. Int J Mol Sci. (2020) 21:9698. doi: 10.3390/ijms 21249698, PMID: 33353225 PMC 7766613 · doi ↗ · pubmed ↗
- 8Duvigneau JC Esterbauer H . Kozlov AV role of heme oxygenase as a modulator of heme-mediated pathways. Antioxidants (Basel). (2019) 8:475. doi: 10.3390/antiox 8100475, PMID: 31614577 PMC 6827082 · doi ↗ · pubmed ↗