Effects of Sofosbuvir/Velpatasvir Therapy on Extrahepatic Manifestations in Patients With Type 2 Diabetes and Chronic Hepatitis C: Insights From a Nationwide Hepatitis C Virus Registry in Taiwan
Szu‐Jen Wang, Te‐Sheng Chang, Ching‐Chu Lo, Chao‐Hung Hung, Chien‐Wei Huang, Lee‐Won Chong, Pin‐Nan Cheng, Ming‐Jong Bair, Ming‐Lun Yeh, Cheng‐Yuan Peng, Chien‐Yu Cheng, Jee‐Fu Huang, Chih‐Lang Lin, Chi‐Chieh Yang, Hsing‐Tao Kuo, Tsai‐Yuan Hsieh, Tzong‐Hsi Lee, Pei‐Lun Lee

TL;DR
Treating hepatitis C with sofosbuvir/velpatasvir improves blood sugar control in patients with type 2 diabetes.
Contribution
This study provides evidence that HCV eradication can significantly reduce HbA1c levels in diabetic patients.
Findings
HbA1c levels decreased significantly in diabetic patients after HCV treatment.
Patients with higher baseline HbA1c and cirrhosis had greater reductions in HbA1c.
24.6% of diabetic patients with high HbA1c achieved normal levels after HCV elimination.
Abstract
This study examines the impact of hepatitis C virus (HCV) eradication through sofosbuvir/velpatasvir (SOF/VEL) treatment on glycated hemoglobin (HbA1c) levels in patients with chronic hepatitis C and type 2 diabetes mellitus (T2DM). Utilizing data from the Taiwan HCV Registry, a retrospective analysis was conducted on 2180 patients who met the inclusion criteria, 695 of whom had T2DM. HbA1c levels significantly decreased in the diabetes group from 7.32% ± 1.72% at baseline to 6.87% ± 1.34% after achieving sustained virological response (SVR12). Patients with higher baseline HbA1c levels and cirrhosis experienced more pronounced HbA1c reductions. Among diabetic patients with HbA1c levels ≥ 6.5, 24.6% achieved levels < 6.5 following HCV elimination, while 24.4% of prediabetic patients observed HbA1c reductions < 5.7. Multivariate analysis identified fasting glucose levels and diabetes…
Genes, proteins, chemicals, diseases, species, mutations and cell lines named across the full text — each resolved to its canonical identifier and authoritative record.
Click any figure to enlarge with its caption.
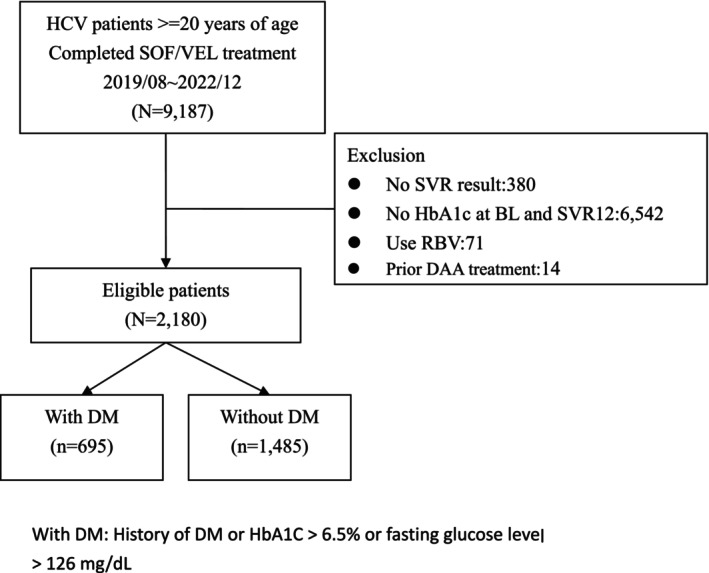 FIGURE 1
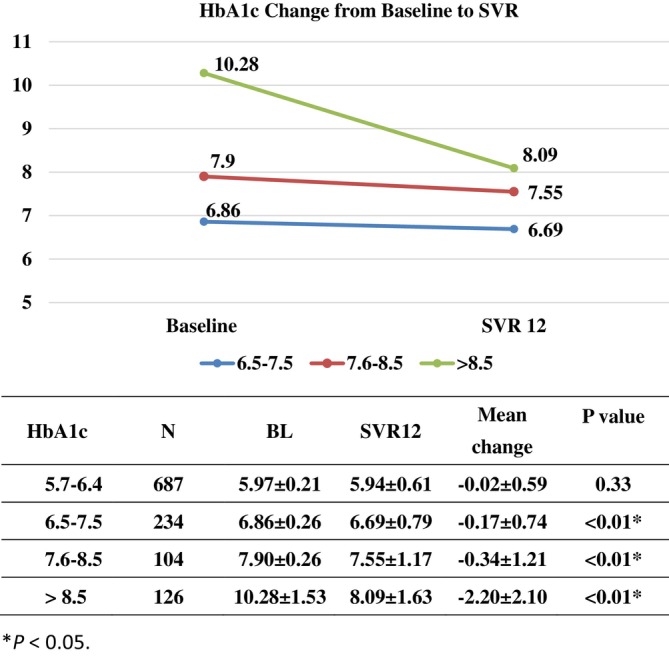 FIGURE 2
| Characteristics | Total ( | DM ( | Non‐DM ( |
|
|---|---|---|---|---|
| Age (years), mean ± SD | 61.0 ± 13.0 | 65.0 ± 11.8 | 59.1 ± 13.0 | < 0.001 |
| Male, | 1063 (48.8) | 347 (49.9) | 716 (48.2) | 0.456 |
| BMI (kg/m2), mean ± SD | 24.8 ± 2.1 | 26.1 ± 4.3 | 24.3 ± 3.9 | < 0.001 |
| Treatment history | ||||
| Naïve, | 2120 (97.3) | 672 (96.7) | 1448 (97.5) | 0.278 |
| Experienced, | 60 (2.8) | 23 (3.3) | 37 (2.5) | |
| HBsAg (+), | 169 (7.8) | 55 (7.9) | 114 (7.7) | 0.847 |
| HIV co‐infection, | 67 (3.1) | 7 (1.0) | 60 (4.0) | < 0.001 |
| Smoker, | 820 (37.6) | 239 (34.4) | 581 (39.1) | 0.033 |
| Alcoholism, | 590 (27.1) | 168 (24.2) | 422 (28.4) | 0.038 |
| Hypertension, | 883 (40.5) | 427 (61.4) | 456 (30.7) | < 0.001 |
| PWID, | 261 (12.0) | 54 (7.8) | 207 (13.9) | < 0.001 |
| PWID Tx, | 101 (4.6) | 16 (0.7) | 85 (5.7) | < 0.001 |
| Cirrhosis, | 314 (14.4) | 133 (19.1) | 181 (12.2) | < 0.001 |
| Decompensated cirrhosis, | 23 (1.1) | 13 (1.9) | 10 (0.7) | < 0.001 |
| HCC, | 94 (4.3) | 50 (7.2) | 44 (3.0) | < 0.001 |
| Liver transplantation, | 1 (0.1) | 1 (0.1) | 0 (0.0) | 0.144 |
| Dialysis, | 47 (2.2) | 36 (5.2) | 11 (0.7) | < 0.001 |
| HCV RNA (log10 IU/mL), mean ± SD | 5.87 ± 1.06 | 5.98 ± 1.01 | 5.82 ± 1.08 | < 0.001 |
| HCV genotype 1/2/3/4/5/6/Others, | 838 (38.4)/1001 (45.9)/54 (2.5)/1 (0.1)/1 (0.1)/219 (10.1)/66 (3.0) | 243 (35.0)/376 (54.1)/14 (2.0)/0 (0.0)/0 (0.0)/43 (6.2)/19 (2.7) | 595 (40.1)/625 (42.1)/40 (2.7)/1 (0.1)/1 (0.1)/176 (11.0)/47 (3.2) | < 0.001 |
| T‐bil (mg/dL), mean ± SD | 0.81 ± 0.40 | 0.76 ± 0.40 | 0.83 ± 0.40 | < 0.001 |
| AST (IU/L), mean ± SD | 57.0 ± 50.1 | 58.3 ± 49.2 | 56.4 ± 50.5 | 0.398 |
| ALT (IU/L), mean ± SD | 68.3 ± 73.0 | 71.0 ± 71.9 | 67.0 ± 73.5 | 0.230 |
| Albumin (mg/dL), mean ± SD | 4.21 ± 0.43 | 4.12 ± 0.47 | 4.24 ± 0.40 | < 0.001 |
| INR, mean ± SD | 1.04 ± 0.35 | 1.05 ± 0.37 | 1.04 ± 0.34 | 0.976 |
| Platelets, mean ± SD | 197.2 ± 71.8 | 194.1 ± 75.6 | 198.6 ± 70.0 | 0.192 |
| HbA1c (%), mean ± SD | 6.09 ± 1.34 | 7.33 ± 1.72 | 5.50 ± 0.43 | < 0.001 |
| Creatinine (mg/dL), mean ± SD | 1.02 ± 1.08 | 1.30 ± 1.66 | 0.89 ± 0.62 | < 0.001 |
| eGFR, mL/min/1.73 m2, mean ± SD | 88.0 ± 28.9 | 79.5 ± 32.7 | 92.0 ± 26.0 | < 0.001 |
| SVR 12 (%) | 2162 (99.2) | 685 (98.6) | 1477 (99.5) | 0.030 |
| Baseline HbA1c | SVR 12 HbA1c | HbA1c change |
| |
|---|---|---|---|---|
| All patients ( | 6.08 ± 1.34 | 5.95 ± 1.07 | −0.13 ± 0.92 | < 0.001 |
| DM patients ( | 7.32 ± 1.72 | 6.87 ± 1.34 | −0.45 ± 1.49 | < 0.001 |
| Non‐DM patients ( | 5.50 ± 0.43 | 5.51 ± 0.51 | 0.01 ± 0.39 | 0.189 |
| DM patients with cirrhosis ( | 7.39 ± 2.13 | 6.78 ± 1.36 | −0.62 ± 1.76 | < 0.001 |
| DM patients without cirrhosis ( | 7.31 ± 1.61 | 6.90 ± 1.33 | −0.41 ± 1.43 | < 0.001 |
| Non‐DM patients with cirrhosis ( | 5.26 ± 0.47 | 5.34 ± 0.52 | 0.09 ± 0.36 | 0.002 |
| Non‐DM patients without cirrhosis ( | 5.53 ± 0.41 | 5.54 ± 0.51 | 0.003 ± 0.39 | 0.791 |
| DM patients with pretreatment HbA1c greater than or equal to baseline average | 8.04 ± 1.66 | 7.27 ± 1.31 | −0.78 ± 1.61 | < 0.001 |
| DM patients with pretreatment HbA1c less than baseline average | 5.87 ± 0.45 | 6.08 ± 0.99 | 0.21 ± 0.95 | 0.001 |
| M3 |
| |||||
|---|---|---|---|---|---|---|
| > 8.5 ( | 7.6–8.5 ( | 6.5–7.5 ( | 5.7–6.4 ( | < 5.7 ( | ||
| Baseline HbA1c | < 0.01 | |||||
| > 8.5 ( | 42 | 39 | 21 | 18 | 6 | |
| 7.6–8.5 ( | 22 | 18 | 56 | 7 | 1 | |
| 6.5–7.5 ( | 7 | 23 | 122 | 71 | 11 | |
| 5.7–6.4 ( | 4 | 4 | 51 | 460 | 168 | |
| HbA1c significant improvement | Yes ( | No ( |
|
|---|---|---|---|
| Age (years, mean (SD)) | 62.1 (13.0) | 60.6 (12.9) | 0.02 |
| Male, | 257 (47.2) | 855 (52.8) | 0.02 |
| BMI (kg/m2, mean (SD)) | 25.5 (4.1) | 24.5 (4.0) | < 0.01 |
| Hypertension, | 282 (51.8) | 597 (36.9) | < 0.01 |
| Creatinine (mg/dL, mean (SD)) | 1.11 (1.20) | 0.99 (1.0) | 0.03 |
| eGFR (mL/min/1.73 m2) | < 0.01 | ||
| > 90, | 243 (44.8) | 770 (47.6) | |
| 60–89, | 193 (35.6) | 657 (40.7) | |
| 30–59, | 82 (15.1) | 151 (9.3) | |
| 15–29, | 9 (1.7) | 8 (0.5) | |
| < 15, | 15 (2.8) | 30 (1.9) | |
| AST (IU/L, mean (SD)) | 64.1 (58.9) | 54.5 (46.5) | < 0.01 |
| ALT (IU/L, mean (SD)) | 78.5 (79.8) | 64.6 (70.1) | < 0.01 |
| Platelet count (× 103 u/L, mean (SD)) | 192.3 (69.6) | 198.8 (72.4) | 0.07 |
| Triglycerides (mg/dL, mean (SD)) | 123.3 (145.0) | 106.3 (58.9) | < 0.01 |
| Fasting glucose (mg/dL, mean (SD)) | 136.2 (62.0) | 107.1 (37.4) | < 0.01 |
| HbA1c (%, mean (SD))) | 7.1 (1.9) | 5.7 (0.8) | < 0.01 |
| Diabetes, | 330 (60.7) | 355 (21.9) | < 0.01 |
| FIB‐4 (mean (SD)) | 3.0 (2.9) | 2.7 (3.2) | 0.08 |
| Cirrhosis, | 96 (17.6) | 214 (13.2) | 0.01 |
| HCC history, | 506 (93.0) | 1,563 (96.6) | < 0.01 |
| HCV RNA (log IU/mL, mean (SD)) | 5.9 (1.0) | 5.8 (1.1) | 0.05 |
| HCV genotype 1, | 189 (34.7) | 642 (39.7) | 0.04 |
| Predictors (mean (SD) or | HbA1c significant improvement | Unadjusted OR (95% CI) |
| Adjusted OR (95% CI) |
|
|---|---|---|---|---|---|
| Age (years) | 1.01 (1.00–1.02) | 0.02 | 0.99 (0.98–1.01) | 0.87 | |
| Gender | |||||
| Female | 257 (23.1) | 1 | 1 | ||
| Male | 287 (27.3) | 1.25 (1.03–1.52) | 0.02 | 1.26 (0.98–1.62) | 0.07 |
| BMI (kg/m2) | 1.05 (1.03–1.08) | < 0.01 | 1.01 (0.98–1.04) | 0.59 | |
| Hypertension | |||||
| No | 262 (20.4) | 1 | 1 | ||
| Yes | 282 (32.1) | 1.84 (1.51–2.24) | < 0.01 | 1.33 (1.01–1.74) | 0.04 |
| Creatinine (mg/dL) | 1.09 (1.01–1.18) | 0.04 | 1.02 (0.90–1.15) | 0.78 | |
| eGFR (mL/min/1.73 m2) | 0.99 (0.99–1.00) | 0.08 | 1.00 (0.99–1.01) | 0.11 | |
| > 90 | 243 (24.0) | ||||
| 60–89 | 193 (22.7) | ||||
| 30–59 | 82 (35.2) | ||||
| 15–29 | 9 (53.0) | ||||
| < 15 | 15 (33.3) | ||||
| AST (IU/L) | 1.00 (1.00–1.01) | < 0.01 | 1.00 (0.99–1.01) | 0.76 | |
| ALT (IU/L) | 1.00 (1.00–1.00) | < 0.01 | 1.00 (0.99–1.00) | 0.61 | |
| Platelet count (× 103 u/L) | 0.99 (0.99–1.00) | 0.07 | 0.99 (0.99–1.00) | 0.99 | |
| Triglycerides (mg/dL) | 1.00 (1.00–1.00) | < 0.01 | 1.00 (0.99–1.00) | 0.87 | |
| Fasting glucose (mg/dL) | 1.01 (1.01–1.02) | < 0.01 | 1.01 (1.00–1.01) | < 0.01 | |
| Diabetes | |||||
| No | 214 (14.5) | 1 | 1 | ||
| Yes | 330 (48.2) | 5.49 (4.45–6.76) | < 0.01 | 3.73 (2.73–5.10) | < 0.01 |
| FIB‐4 | 1.03 (0.99–1.06) | 0.08 | 1.03 (0.97–1.11) | 0.34 | |
| Cirrhosis | |||||
| No | 448 (24.2) | 1 | 1 | ||
| Yes | 96 (31.0) | 1.41 (1.08–1.83) | 0.01 | 0.95 (0.64–1.41) | 0.81 |
| HCC history | |||||
| No | 38 (40.9) | 1 | 1 | ||
| Yes | 506 (24.5) | 2.13 (1.39–3.27) | < 0.01 | 1.23 (0.69–2.17) | 0.48 |
| HCV RNA(log IU/mL) | 1.10 (0.99–1.21) | 0.05 | 1.04 (0.93–1.17) | 0.47 | |
| HCV genotype 1 | |||||
| No | 355 (26.7) | 1 | 1 | ||
| Yes | 189 (22.7) | 0.81 (0.66‐0.99) | 0.04 | 0.81 (0.63–1.04) | 0.10 |
Peer Reviews
No public reviews on file for this paper yet. If you reviewed it on a platform where reviews are public (OpenReview, ICLR, NeurIPS, ICML), you can paste yours below so the community can read it here.
Videos
No videos yet. Explain this paper in a talk, walkthrough, or lecture? Add one.
Taxonomy
TopicsHepatitis C virus research · Liver Disease Diagnosis and Treatment · Hepatitis B Virus Studies
Introduction
1
The hepatitis C virus (HCV) was identified in 1989 and is a major global health concern, with an estimated 56.8 million infections (0.7% prevalence) worldwide as of January 1, 2020 [1]. The World Health Organization aims to control HCV by 2030 by promoting decentralized testing, task shifting, and simplified direct‐acting antiviral (DAA) therapies at the primary care level [2, 3].
Patients with chronic hepatitis C (CHC) are at risk of liver complications and metabolic dysfunction, such as prediabetes and diabetes [4, 5]. Notably, type 2 diabetes mellitus (T2DM) is an extrahepatic manifestation of CHC. HCV eradication through antiviral therapy reduces hepatic complications and leads to improved metabolic outcomes [6, 7, 8], potentially reducing insulin resistance, enhancing beta‐cell function [9, 10], and reducing the incidence of diabetes [8]. However, improvements in glycemic control may be transient rather than long‐lasting [11, 12].
Sofosbuvir/velpatasvir (SOF/VEL), a 12‐week protease inhibitor‐free regimen for CHC, has achieved sustained virologic response (SVR) rates of 95%–100% in over 1100 clinical trial patients across HCV genotypes 1–6 [13]. The efficacy of SOF/VEL has also been validated in real‐world settings through multiple studies in Western [14] and Asian populations [15].
Glycated hemoglobin (HbA1c) levels are a highly sensitive and specific indicator used in diabetes screening [16, 17]. Studies have demonstrated that HbA1c levels are typically reduced after HCV eradication [18, 19]; however, the effects of HCV eradication with SOF/VEL on glycemic control and changes in HbA1c levels have not been extensively examined in nationwide studies. The current study filled this gap by analyzing pretreatment and posttreatment HbA1c levels in a large multicenter cohort of patients with CHC from the Nationwide HCV Registry Program (TACR).
Materials and Methods
2
Patients
2.1
This retrospective analysis included adult patients (age ≥ 20) who completed CHC treatment with SOF/VEL between August 2019 and December 2022 whose data were accessible through the TACR registry. Patients were eligible if they had SVR results at a 12‐week post‐SOF/VEL‐treatment follow‐up (SVR12), had HbA1c data at baseline and at a 12‐week post‐treatment follow‐up, did not use ribavirin, and had not experienced DAA treatment. Patients with a history of diabetes mellitus (DM), an HbA1c level > 6.5%, or a fasting glucose level > 126 mg/dL were classified as having DM. Patients for whom SVR12 results or HbA1c data at baseline and SVR12 were missing or who did not achieve SVR12 were excluded. All patients received SOF/VEL treatment in accordance with Taiwan's national insurance reimbursement criteria and regional guidelines [20, 21, 22]. The present study was conducted in accordance with the principles of the Declaration of Helsinki, and written informed consent was obtained from all participants. The ethics committee of Kaohsiung Medical University Hospital approved this study.
Laboratory and Histological Analyses
2.2
Biochemical analyses were conducted using a multichannel autoanalyzer (Hitachi Inc., Tokyo, Japan). HCV antibody levels were measured with a third‐generation enzyme immunoassay (Abbott Laboratories, North Chicago, IL, USA). Additionally, HCV RNA was tested using real‐time polymerase chain reaction (Abbott Molecular, Des Plaines IL, USA, or Roche Diagnostics, Branchburg, NJ, USA) with a detection limit of 15 IU/mL. HCV genotypes were determined using assays from Roche Diagnostics (Roche Molecular Diagnostics, California, US) or Abbott Molecular (Abbott Molecular, Illinois, US), depending on the individual participating site. SVR was defined as undetectable HCV RNA (< 12 IU/mL) at 12 weeks after treatment. The fibrosis‐4 (FIB‐4) index value was calculated using the formula: {age (years) × aspartate aminotransferase (AST, units/l)}/{(platelets109/L) × (alanine transaminase [ALT, units/l])1/2}. Liver cirrhosis was diagnosed through histology, transient elastography, or evidence of portal hypertension or cirrhosis. Finally, fatty liver was assessed by trained physicians using ultrasonography. HbA1c levels were measured at baseline and at 12 weeks after treatment.
Statistical Analysis
2.3
Statistical analyses were conducted using SPSS 25 (IBM, Armonk, NY, USA). Frequencies were compared using the χ ^2^ test with Yates' correction or Fisher's exact test. Group means were compared using an analysis of variance and Student's t‐test, and changes in HbA1c levels were analyzed using paired t‐tests and McNemar's test. Stepwise logistic regression was employed to identify factors associated with HbA1c reduction, with consideration of covariates with a p‐value of < 0.1 in a univariate analysis. All analyses were two‐sided, and a p‐value of < 0.05 was considered significant. A significant decrease in HbA1c was defined as the 75th percentile of the change in HbA1c levels before and after treatment within the study population.
Results
3
Patient Demographics
3.1
Data were collected from the TACR platform for the period between August 2019 and December 2022. Among the 9187 patients with CHC who completed SOF/VEL treatment, 380 without SVR results, 6542 without HbA1c data at both baseline and SVR12, 71 on ribavirin treatment, and 14 who had experienced DAA treatment were excluded. Consequently, 2180 patients with available treatment outcomes were included, that is, 695 patients with DM and 1485 without DM (Figure 1).
Flow chart of patient enrollment. BL, baseline; DAA, direct‐acting antiviral; DM, diabetes mellitus; HbA1c, glycated hemoglobin; HCV, hepatitis C virus; RBV, ribavirin; SOF/VEL, sofosbuvir/velpatasvir; SVR, sustained viral response; SVR12, undetectable HCV RNA concentration at a 12‐week posttreatment follow‐up.
The mean age and body mass index (BMI) of the cohort were 61.0 years and 24.8 kg/m^2^, respectively. In total, 48.8% of the patients were men (n = 1063), and 12% were people who inject drugs (PWID; n = 261). Liver cirrhosis was present in 14.4% of the patients (n = 314), of whom 1.1% had decompensated cirrhosis (n = 23). A total of 94 patients (4.3%) had a history of hepatocellular carcinoma (HCC). The most common viral genotype was GT2 (n = 1001, 45.9%), followed by GT1 (n = 838, 38.4%). The mean pretreatment HCV RNA level was 5.87 log_10_ IU/mL, and the baseline mean estimated glomerular filtration rate (eGFR) was 88.0 mL/min/1.73m^2^. Most patients (n = 2120, 97.3%) were treatment‐naive. The patients' average pretreatment HbA1c level was 6.09%. Among the 2180 patients, 99.2% (n = 2162) achieved SVR12 (Table 1).
The patients with diabetes were older (65.0 vs. 59.1 years, p < 0.001) and had higher BMI (26.1 vs. 24.3 kg/m^2^, p < 0.001), serum creatinine levels (1.30 vs. 0.89 mg/dL, p < 0.001), and HCV RNA levels (5.98 vs. 5.82 log_10_ IU/mL, p < 0.001) as well as lower total bilirubin levels (0.76 vs. 0.83 mg/dL, p < 0.001), albumin levels (4.12 vs. 4.24 mg/dL, p < 0.001), and eGFRs (79.5 vs. 92.0 mL/min/1.73m^2^, p < 0.001) values than those without diabetes did. They also had a higher incidence of hypertension (61.4% vs. 30.7%, p < 0.001), liver cirrhosis (19.1% vs. 12.2%, p < 0.001), HCC (7.2% vs. 3.0%, p < 0.001), and use of dialysis (5.2% vs. 0.7%). The mean pretreatment HbA1c levels were 7.33% in the patients with DM and 5.5% in those without DM (p < 0.001; Table 1).
Changes in HbA1c Levels Within Subgroups After DAA Treatment
3.2
Among the 2180 patients, 2162 achieved SVR, and 18 did not. In the patients who achieved SVR, HbA1c levels significantly decreased from 6.08% ± 1.34% at baseline to 5.95% ± 1.07% at SVR12 (p < 0.001), with a mean reduction of 0.13% ± 0.92%. A significant reduction in posttreatment HbA1c levels was noted across all SVR subgroups, with the exception of those with a history of non‐DM with cirrhosis (5.26% ± 0.47% vs. 5.34% ± 0.52%, p = 0.002), those with a history of non‐DM without cirrhosis (5.53% ± 0.41% vs. 5.54% ± 0.51%, p = 0.791), and patients with DM with pretreatment HbA1c levels less than the baseline average (5.87% ± 0.45% vs. 6.08% ± 0.99%, p = 0.001; Table 2).
In the DM group, HbA1c levels significantly decreased from 7.32% ± 1.72% at baseline to 6.87% ± 1.34% at SVR12 (p < 0.001), whereas no significant change in HbA1c levels was observed in the non‐DM group (5.50% ± 0.43% at baseline vs. 5.51% ± 0.51% at SVR, p = 0.189). The reduction in HbA1c levels was greater in the patients with DM with cirrhosis than in those with DM without cirrhosis (0.62% ± 1.76% vs. 0.41% ± 1.43%; Table 2). Moreover, in patients with DM who had pretreatment HbA1c levels greater than or equal to the baseline average (HbA1c: 6.5%), a significant reduction in HbA1c levels was observed (p < 0.001). By contrast, no significant reduction in HbA1c levels was observed among the patients with DM who had pretreatment HbA1c levels less than the baseline average (Table 2).
Improvements in HbA1c Levels After DAA Treatment Across Pretreatment HbA1c Level Categories
3.3
Categorical changes in HbA1c levels after DAA administration are presented in Table 3. Significant reductions in HbA1c levels were observed across different pretreatment level categories in patients with pre‐DM (n = 687) or DM (n = 464). Among patients with DM, 114 individuals (24.6%) who had baseline HbA1c levels exceeding 6.5 successfully reached an HbA1c level below 6.5 at SVR12. Among patients with pre‐DM, 168 (24.5%) individuals who initially had baseline HbA1c levels between 5.7 and 6.4 improved to HbA1c levels below 5.7 at SVR12. However, after SOF/VEL therapy, 111 (9.6%) of all patients exhibited increased HbA1c levels, and 460 (67%) patients with pre‐DM and 182 (39.2%) with DM exhibited no significant changes in HbA1c levels (Table 3).
Significant reductions in HbA1c levels were observed among patients with DM across various pretreatment HbA1c categories. Specifically, the mean reductions in HbA1c levels were 0.17 ± 0.74 for patients with baseline HbA1c levels ranging from 6.5 to 7.5, 0.34 ± 1.21 for those with baseline HbA1c levels between 7.6 and 8.5, and 2.20 ± 2.10 for patients with baseline HbA1c levels > 8.5 (p < 0.01). However, among patients with pre‐DM (HbA1c levels between 5.7 and 6.4), no significant improvement in HbA1c levels was observed (0.02 ± 0.59, p = 0.33; Figure 2).
Line chart depicting the time‐course change in HbA1c levels versus the baseline in patients with DM. X‐axis, baseline, undetectable HCV RNA concentration at a 12‐week posttreatment follow‐up (SVR 12); Y‐axis, percentage with baseline A1c 6.5–7.5, A1c 7.6–8.5, or A1c > 8.5.
Factors Associated With Significant Reductions in HbA1c Levels
3.4
The magnitude of HbA1c level reductions varied among the studied subpopulations. Hence, we conducted a further analysis to identify the factors associated with significant HbA1c reductions in the cohort of 2162 HCV patients who achieved SVR. Patients who exhibited significant reductions in HbA1c levels had a higher age (62.1 vs. 60.6 years, p = 0.02) and higher BMI (25.5 vs. 24.5 kg/m^2^, p < 0.01). These patients also had an increased prevalence of hypertension (51.8% vs. 36.9%, p < 0.01) and exhibited elevated baseline levels of serum creatinine (1.11 vs. 0.99 mg/dL, p = 0.03), AST (64.1 vs. 54.5 U/L, p < 0.01), ALT (78.5 vs. 64.6 U/L, p < 0.01), triglycerides (123.3 vs. 106.3 mg/dL, p < 0.01), fasting glucose (136.2 vs. 107.1 mg/dL, p < 0.01), and HbA1c (7.1% vs. 5.7%, p < 0.01). Additionally, these individuals had a higher prevalence of DM (60.7% vs. 21.9%, p < 0.01), cirrhosis (17.6% vs. 13.2%, p = 0.01), and advanced chronic kidney disease (CKD; 4.5% vs. 2.4%, p < 0.01) than did the patients who did not exhibit significant HbA1c level reductions (Table 4). The results of a multivariate analysis indicated that fasting glucose levels (odds ratio [OR]/confidence interval [CI]: 1.01/1.00–1.01, p < 0.01) and DM (OR/CI: 3.73/2.73–5.10, p < 0.01) were significantly associated with HbA1c level reductions (Table 5).
TABLE 4: Univariate analysis of the factors associated with significant HbA1c level reductions a .
TABLE 5: Factors associated with significant HbA1c level reductions. a
Discussion
4
The findings of this study reveal a significant improvement in HbA1c levels after HCV eradication through SOF/VEL treatment among all patients who achieved SVR12. In patients with DM who achieved SVR, a significant reduction in HbA1c levels was observed across all subgroups. Furthermore, the reduction in HbA1c levels was more pronounced in patients with higher pretreatment HbA1c levels.
DM can be diagnosed using HbA1c levels, fasting plasma glucose levels, or oral glucose tolerance tests. HbA1c is particularly valuable for DM screening because of its high sensitivity and specificity [16, 17]. HCV infection increases the risk of pre‐DM and DM during the initiation of the insulin signaling pathway, comparing individuals with and without infection [23, 24]. Several factors predictive of DM development have been examined, including high BMI, male sex, and advanced liver fibrosis [25]. Liver cirrhosis can lead to hyperinsulinemia, which subsequently induces glucose intolerance [26]. Our previous study demonstrated that patients with high pretreatment glucose levels and liver cirrhosis may benefit more from HCV eradication in terms of reductions in 2‐h plasma glucose (2HPG) levels [7]. In the present study, HbA1c level reductions were more pronounced in patients with higher pretreatment HbA1c levels and in patients with DM and cirrhosis, consistent with the findings of another study [27]. Factors associated with significant reductions in HbA1c levels include high BMI and male sex, as reported in another study [25]. Furthermore, the results of a multivariate analysis revealed that the factors independently associated with significantly reduced HbA1c levels were fasting glucose levels (OR/95% CI: 1.01/1.00–1.01, p < 0.01) and DM (OR/CI: 3.70/2.70–5.06, p < 0.01).
Although glucose levels may be reduced following HCV eradication, the findings reported in the literature remain inconclusive [11, 12] because HCV infection is one of several risk factors for DM. These risk factors are complex and comprise both nonmodifiable factors, such as family history, age, ethnicity, and genetics, and modifiable factors, such as weight, physical inactivity, diet, high blood pressure, cholesterol levels, and smoking [28], which can exacerbate the symptoms of DM. In the present study, most patients with DM exhibited a significant reduction in HbA1c levels at SVR. However, 111 (9.6%) patients with pre‐DM or DM experienced increased HbA1c levels, and 460 (67%) patients with pre‐DM and 182 (39.2%) with DM exhibited no significant changes in HbA1c levels following SOF/VEL therapy. This variability may explain the inconsistent results in the literature.
Most studies have reported improvements in DM management either at the end of therapy or in the months immediately following treatment in patients with DM. A systematic review and meta‐analysis highlighted significant reductions in HbA1c and fasting plasma glucose levels after DAA treatment in patients with established DM [29]. However, Li et al. observed that although successful HCV treatment in patients with T2DM leads to a notable reduction in HbA1c levels shortly after therapy, these improvements are not maintained over the long term. Within less than 3 years of achieving SVR, HbA1c levels rebound to those similar to the levels of untreated patients or those for whom treatment failed, and some patients exhibit levels higher than those they exhibited before treatment [12]. Therefore, the sustainability of the reduction in HbA1c levels resulting from HCV eradication remains a matter of controversy. In consideration of this, large prospective cohort studies that incorporate thorough analyses of potential confounding factors—such as smoking status, steatosis severity, changes in BMI, physical activity levels, and adherence to antidiabetic therapy—are urgently required to evaluate the durability of these improvements.
In the present study, 99.2% of the patients achieved SVR12 after SOF/VEL treatment, which is consistent with the findings of an earlier study [15]. Additionally, in another study involving a different DAA regimen, patients with elevated pretreatment HbA1c levels appeared to experience more pronounced glycemic improvements after HCV eradication, aligning with the current findings [30]. Our prior nationwide investigations in Taiwan have also revealed that patients with CKD exhibited a greater likelihood of renal function recovery after HCV eradication with DAAs [8, 31]. In the cohort in the present study, 114 (24.6%) of 464 patients with DM who had baseline HbA1c levels of > 6.5% achieved posttreatment HbA1c levels of < 6.5% shortly after receiving DAA therapy, which is an ideal level consistent with the objective of diabetes control. Both successful HCV eradication and HbA1c level reductions can reduce the risk of DM‐related complications among individuals with T2DM, including progression to end‐stage renal disease, acute coronary syndrome, and retinopathy [32].
These findings underscore the hepatic and extrahepatic benefits of SOF/VEL treatment. Early eradication of HCV in patients with DM, particularly those with higher baseline HbA1c levels or cirrhosis, increases glycemic control and reduces the prevalence of extrahepatic complications associated with DM. Consequently, promptly identifying HCV‐positive patients with DM and initiating antiviral therapy to prevent fibrotic progression and reduce the risk of DM‐related extrahepatic complications is essential.
This study has several limitations, including its short observational period. However, we enrolled a large cohort of patients from multiple centers throughout Taiwan that reflected real‐world situations, and our findings demonstrate that even a slight reduction in HbA1c levels shortly after viral eradication has clinical significance. Additionally, because the data were derived from a registry rather than controlled clinical trials, we used a standardized database platform to mitigate reporting bias and confirm the results.
In conclusion, the elimination of HCV with SOF/VEL significantly reduced HbA1c levels, especially in patients with DM with higher pretreatment HbA1c levels and cirrhosis. The findings of this study reveal that treating HCV can alleviate both hepatic and extrahepatic symptoms, underscoring the importance of involving non‐hepatology specialists in HCV care.
Conflicts of Interest
Ming‐Lung Yu: Research support (grant) from BMS, Gilead, Merck, and Roche Diagnostics; consultant of AbbVie, BMS, Gilead, Roche, and Roche Diagnostics; speaker of AbbVie, BMS, Eisai, Gilead, Roche, and Roche Diagnostics. Wan‐Long Chuang: Advisory board member for AbbVie, BMS, Gilead, PharmaEssentia, Roche, and Vaccitech; speaker for AbbVie, BMS, Gilead, and Roche. Chia‐Yen Dai/Chung‐Feng Huang: Speaker for AbbVie, BMS, Gilead, Merck, and Roche. Yi‐Hsiang Huang: Research grants from Gilead Sciences and AstraZeneca, honoraria from AstraZeneca, Gilead Sciences, Eisai, and Roche, advisory role for AstraZeneca, Eisai, and Roche. All other authors declare no conflicts of interest.
The reference list from the paper itself. Each links out to its DOI / PubMed record.
- 1Polaris Observatory HCV Collaborators , S. Blach , N. A. Terrault , et al., “Global Change in Hepatitis C Virus Prevalence and Cascade of Care Between 2015 and 2020: A Modelling Study,” Lancet Gastroenterology & Hepatology 7, no. 5 (2022): 396–415.35180382 10.1016/S 2468-1253(21)00472-6 · doi ↗ · pubmed ↗
- 2Hepatitis C [Internet]. [cited 2024 Jul 28], https://www.who.int/news‐room/fact‐sheets/detail/hepatitis‐c.
- 3C. Huang , T. Jang , S. Yu , et al., “Patient‐Centered and Integrated Outreach Care for Chronic Hepatitis C Patients With Serious Mental Illness in Taiwan,” Kaohsiung Journal of Medical Sciences 40, no. 1 (2024): 86–93.37942784 10.1002/kjm 2.12780 PMC 11895585 · doi ↗ · pubmed ↗
- 4P. N. T. Thu , D. H. Van , M. N. T. Quynh , et al., “Metabolic, Renal, and Hematological Changes in Chronic Hepatitis C Patients Achieving Rapid Virologic Response After 12 Weeks of Direct‐Acting Antiviral Treatment: A Prospective Cohort Study,” P Lo S One 18, no. 9 (2023): e 0290235.37656689 10.1371/journal.pone.0290235 PMC 10473482 · doi ↗ · pubmed ↗
- 5L. Serfaty , “Metabolic Manifestations of Hepatitis C Virus Diabetes Mellitus, Dyslipidemia,” Clinics in Liver Disease 21, no. 3 (2017): 475–486.28689587 10.1016/j.cld.2017.03.004 · doi ↗ · pubmed ↗
- 6C. Huang , C. Dai , M. Yeh , et al., “Cure or Curd: Modification of Lipid Profiles and Cardio‐Cerebrovascular Events After Hepatitis C Virus Eradication,” Kaohsiung Journal of Medical Sciences 36, no. 11 (2020): 920–928.32643842 10.1002/kjm 2.12275 PMC 11896403 · doi ↗ · pubmed ↗
- 7T. Jang , Y. Lin , P. Liang , et al., “Amelioration of Glucose Intolerance Through Directly Acting Antiviral Agents in Chronic Hepatitis C Cirrhotic Patients Without Overt Diabetes,” Kaohsiung Journal of Medical Sciences 38, no. 9 (2022): 897–906.35670210 10.1002/kjm 2.12563 PMC 11896566 · doi ↗ · pubmed ↗
- 8S. Wang , C. Huang , T. Chang , et al., “Real‐World Efficacy and Safety of Universal 8‐Week Glecaprevir/Pibrentasvir in Patients With Chronic Hepatitis C With Early Chronic Kidney Disease or Pre‐End‐Stage Renal Disease: Insights From a Nationwide Hepatisis C Virus Registry in Taiwan,” Kaohsiung Journal of Medical Sciences 41, no. 2 (2025): e 12929.39829106 10.1002/kjm 2.12929 PMC 11827544 · doi ↗ · pubmed ↗