Comparative analysis of chloroplast genomes and transcriptomics reveals the adaptation of Glycyrrhiza to salt stress
Mingxiang Huang, Tianxiang Zhang, Yuansheng Duan, Guifeng Zhang, Wei Hong, Yongjun Shu

TL;DR
This study explores how Glycyrrhiza plants adapt to salt stress by analyzing their chloroplast genomes and gene activity, revealing insights into their salt tolerance and medicinal value.
Contribution
The study provides new insights into the genetic and transcriptomic basis of salt tolerance in Glycyrrhiza through comparative chloroplast genome and transcriptome analyses.
Findings
Chloroplast genes in Glycyrrhiza respond to salt stress at different developmental stages.
Genes like psbA and rrn23 show increased editing efficiency under salt stress.
Chloroplast genome analysis reveals genetic diversity and phylogenetic relationships in Glycyrrhiza.
Abstract
Glycyrrhiza is a perennial leguminous plant with salt tolerance, and its roots and rhizomes possess extremely significant medicinal value. The proper salinity can facilitate the growth of Glycyrrhiza and increase its content of medicinal ingredients. However, excessive salinity can negatively affect growth and medicinal component contents. The salt tolerance mechanism has not yet been fully elucidated, especially the information of chloroplast genome is in short supply. Present research investigated the genetic diversity of Glycyrrhiza by conducting comparative genomic, adaptive evolutionary, haplotype, population structure, and phylogenetic analyses of the chloroplast genes. Transcriptome analysis revealed that the chloroplast genes of different Glycyrrhiza varieties respond to salt stress at different stages and that these responsive genes are associated predominantly with the…
Genes, proteins, chemicals, diseases, species, mutations and cell lines named across the full text — each resolved to its canonical identifier and authoritative record.
Click any figure to enlarge with its caption.
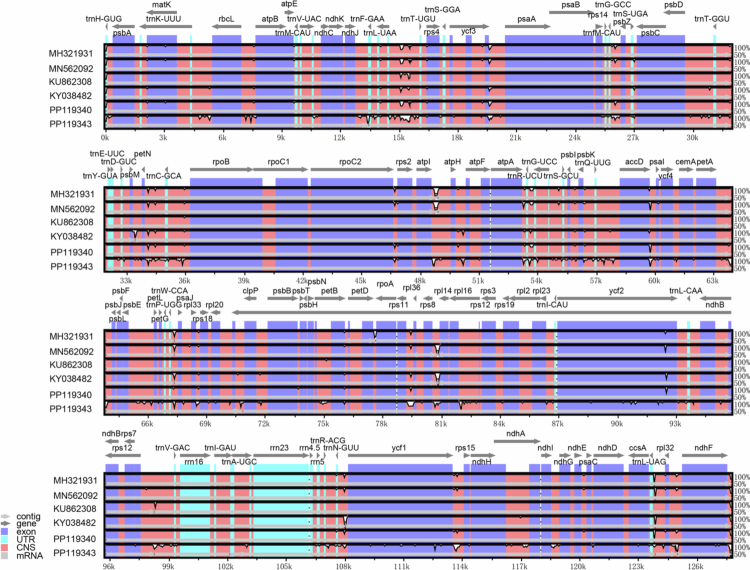 Figure 1
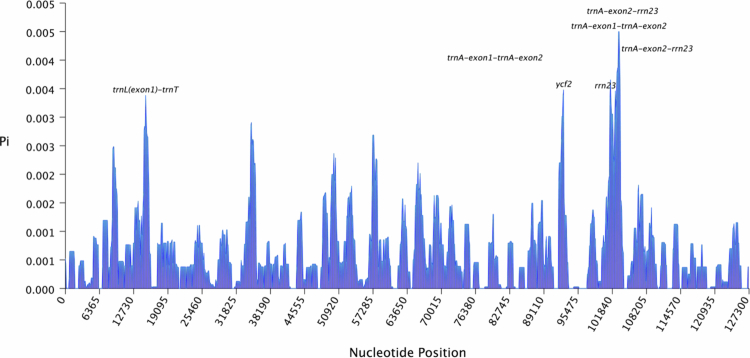 Figure 2
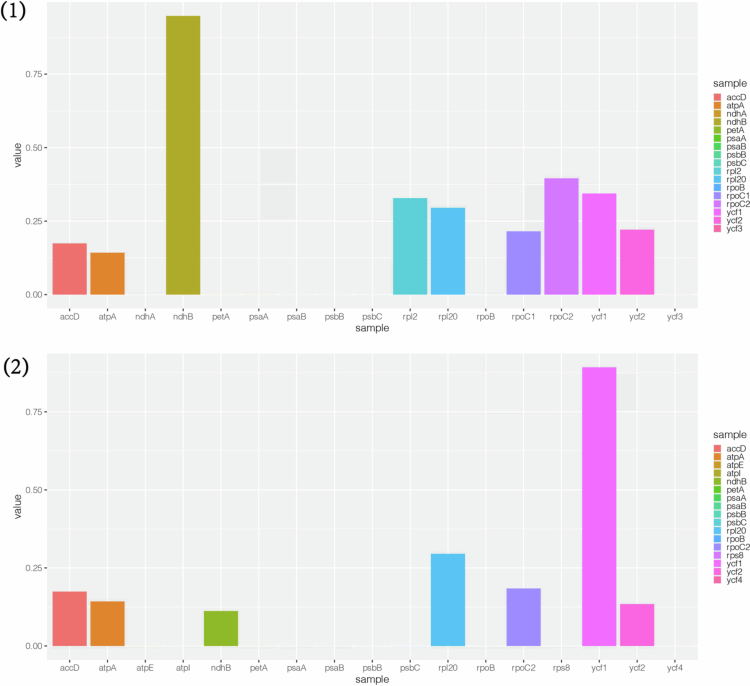 Figure 3
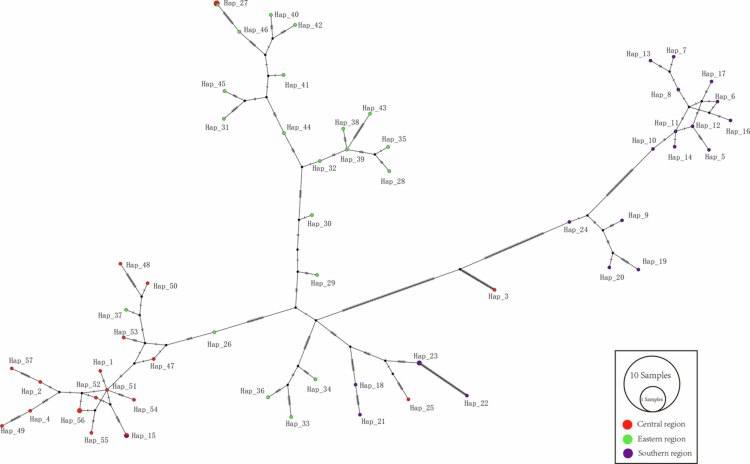 Figure 4
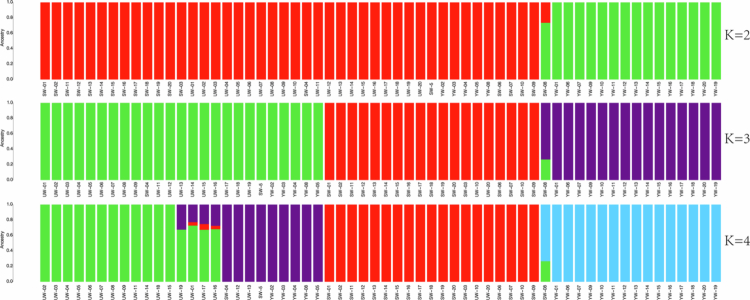 Figure 5
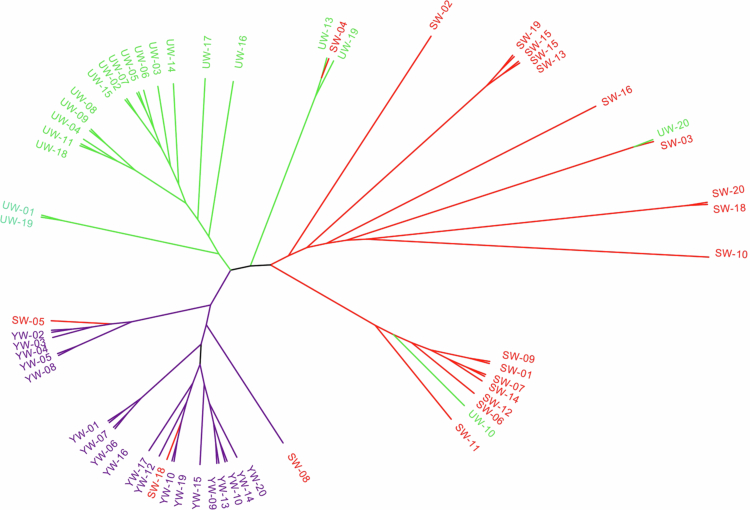 Figure 6
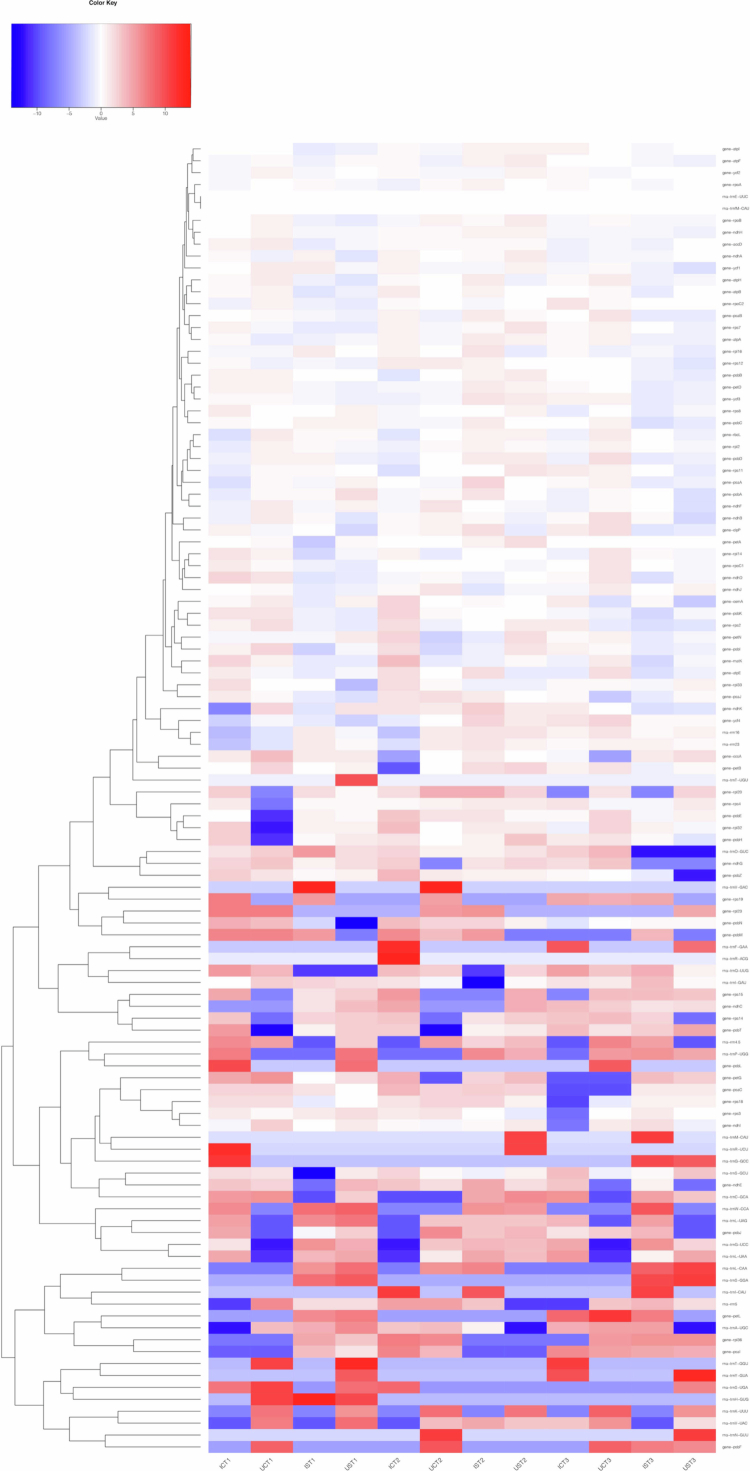 Figure 7
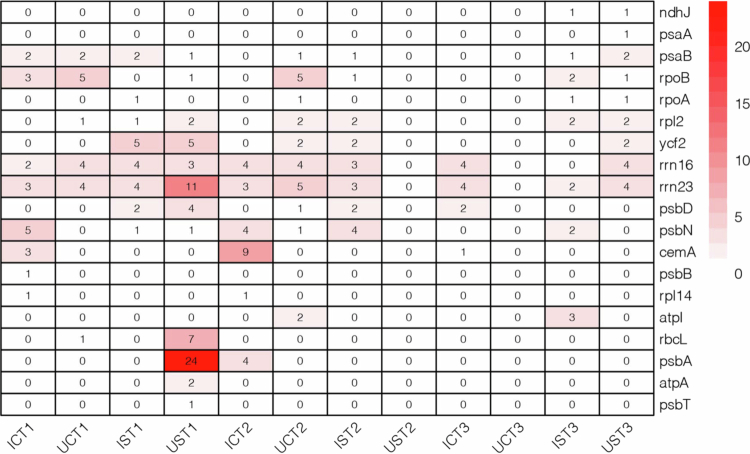 Figure 8
- —Innovative Project for Postgraduate Students of Harbin Normal University
- —National Teaching Innovation Team Research Project for Traditional Chinese Medicine Major
Peer Reviews
No public reviews on file for this paper yet. If you reviewed it on a platform where reviews are public (OpenReview, ICLR, NeurIPS, ICML), you can paste yours below so the community can read it here.
Videos
No videos yet. Explain this paper in a talk, walkthrough, or lecture? Add one.
Taxonomy
TopicsPharmacological Effects of Natural Compounds · Ginseng Biological Effects and Applications · Plant-based Medicinal Research
Introduction
Glycyrrhiza, a perennial legume with significant medicinal value, is widely distributed in northwestern China. The dried roots and rhizomes of Glycyrrhiza uralensis, Glycyrrhiza glabra, and Glycyrrhiza inflata are often used as medicines.1Glycyrrhiza has a wide range of pharmacological effects, including anti-inflammatory, antibacterial, antiviral, antitumor, and multiple organ protective effects.2^,^3 It also demonstrates considerable potential for applications in both medical and animal feed fields.4^,^5 In addition to their pharmacological properties, Glycyrrhiza species are notable for their ability to survive in extreme environments, particularly under conditions of high salinity, drought, and intense light. This unique ecological adaptability makes them valuable model resources for studying plant salt tolerance mechanisms.6
In recent years, soil salinization has become increasingly severe, posing a significant threat to the natural distribution and sustainable utilization of plant resources. In China, Glycyrrhiza species are distributed primarily in saline–alkaline desert grasslands in arid and semiarid regions of the northwest.7 Although these species exhibit a certain degree of salt tolerance, for example, Glycyrrhiza inflata and Glycyrrhiza uralensis can thrive in saline‒alkaline soils. Notably, over the past two decades, the synergistic effects of overexploitation and environmental degradation have led to a marked decline in both the population density and biomass of Glycyrrhiza.8 Therefore, identifying genes associated with salt tolerance in Glycyrrhiza is crucial to ensure the sustainable utilization of this resource in salinized environments. Current research has made significant progress in elucidating the molecular mechanisms and physiological responses related to salt tolerance in Glycyrrhiza.8-10 Dong et al. systematically investigated the regulatory effects of exogenous glycine betaine (GB) on the physiological characteristics of Glycyrrhiza seedlings under salt stress and revealed that GB treatment significantly enhances the antioxidant capacity and osmotic regulation of these seedlings.10 Using high-throughput transcriptome sequencing technology, Jia et al. identified key salt tolerance-related genes, such as SAPK2, LAC3, and AHK2, which are involved in regulating ion absorption and root growth and development.8 However, research on the chloroplast genome of Glycyrrhiza remains significantly limited, greatly restricting a comprehensive understanding of salt tolerance mechanisms at the organelle level.
Chloroplasts are semiautonomous organelles that evolved from ancestral cyanobacteria through endosymbiosis, featuring a double-membrane structure with an internal thylakoid membrane system and stroma.11 Chloroplasts are not only the primary site for photosynthesis and Calvin cycle metabolism but also central hubs for plant stress responses.12,13 Among various abiotic stresses, salt stress significantly inhibits plant growth and development by disrupting ion homeostasis.14 The chloroplast genome, which is typically 120−160 kb in size and encodes approximately 100−130 genes, is highly sensitive to environmental stresses.15 Under salt stress, the electron transport chain becomes compromised, leading to increased accumulation of reactive oxygen species (ROS). When ROS levels exceed the scavenging capacity of antioxidant systems, they trigger cascading effects, including protein denaturation and DNA damage, ultimately impairing chloroplast integrity and the photosynthetic machinery.13,14 Moreover, the chloroplast genome has become an important tool for studying plant phylogenetics and molecular evolution due to its structural conservation, maternal inheritance, low evolutionary rate and limited recombination. 16,17
Recent breakthroughs in population chloroplast genomics include phylogenetic and population genetic analyses of 1,579 Brassica napus that elucidated multiple origin patterns of its chloroplast genome.18 However, systematic investigations of the population genetic structure, haplotype diversity, and adaptive evolution characteristics of the Glycyrrhiza chloroplast genome are lacking. Research has focused primarily on the genome assembly and annotation of different Glycyrrhiza varieties. For instance, Wu et al. conducted comparative and phylogenomic analyses of six Glycyrrhiza chloroplast genomes, revealing features such as the loss of inverted repeats, and performed preliminary analyses of selection pressure on genes.19 Jiang et al. characterized the transcriptome and complete chloroplast genome of Glycyrrhiza inflata and conducted comparative analyses with those of Glycyrrhiza uralensis and Glycyrrhiza glabra.20 Therefore, systematic studies of the chloroplast genomes of Glycyrrhiza varieties are needed to elucidate their population genetic structure and adaptive evolutionary patterns, which are crucial for understanding the genetic diversity and salt tolerance mechanisms of Glycyrrhiza varieties.
In this study, the chloroplast genomes of six different Glycyrrhiza varieties were collected and analyzed using comparative genomics to investigate their structural characteristics. In addition, 60 publicly available Glycyrrhiza chloroplast genome datasets were integrated to explore patterns of genomic variation. Based on haplotype analysis, phylogenetic, and population genetic structure evaluation, the genetic diversity of Glycyrrhiza chloroplast genomes was comprehensively characterized. Furthermore, transcriptome sequencing technology was employed to elucidate the regulatory patterns of chloroplast gene expression under salt stress conditions. Based on these datasets, this study aims to explore the phylogenetic history and evolutionary history of Glycyrrhiza and to identify key functional genes under positive selection along with their adaptive evolutionary mechanisms. These findings provide a foundation for a deeper understanding of the genetic diversity and phylogenetic evolution of Glycyrrhiza.
Materials and methods
Divergence analysis of the whole chloroplast genes of the genus Glycyrrhiza
The chloroplast genomes of six Glycyrrhiza varieties (MH321931, MN562092, KY038482, KU862308, PP119340, and PP119343) were collected from the NCBI database (https://www.ncbi.nlm.nih.gov/) (accessed on 5 August 2024). The mVISTA online software (https://genome.lbl.gov/vista/index.shtml) (accessed on 5 September 2024)21 was utilized to conduct a sequence comparative analysis, with MN199032 as the reference chloroplast genome. In the shuffle-LAGAN model, the six varieties were compared. The minimum and maximum values of the y-axis were set from 50% to 100%, and the sliding window size was set to 100 bp.
SNP analysis of chloroplast genes in Glycyrrhiza uralensis
The original sequence data of 60 Glycyrrhiza DNA resequencing datasets were collected from the SRA database (https://www.ncbi.nlm.nih.gov/sra) (PRJNA730103; accessed on 17 August 2024). The fastq-dump tool from the SRA Toolkit (https://ftp-trace.ncbi.nlm.nih.gov/sra/sdk/2.9.6/) (accessed on 27 August 2024) was used to extract the fastq files of the DNA sequencing data. Quality control and adapter trimming of the raw reads were performed using Trimmomatic (version 0.3.2).22 The filtered reads from the 60 resequenced datasets were independently mapped to the MN199032 chloroplast genome using Burrows-Wheeler Aligner software (version 0.7.17).23 The resulting alignment files in SAM format were converted into BAM (the binary version of SAM) format using (version 0.7.17).24 The addOrReplaceReadGroups tool of GATK (version 4.4.0.0)25 was used to add read groups, and then the MarkDuplicates tool was employed to remove duplicates. Joint genotyping of the gVCF files was conducted using the HaplotypeCaller tool, after which the GenotypeGVCFs tool was used to convert the gVCF files into VCF format. SNPs and INDELs were subsequently filtered using the SelectVariants function. The alignment of the Glycyrrhiza chloroplast genomes was carried out with MAFFT (version 7.526)26 using default parameters. Nucleotide diversity (Pi) values were calculated using DnaSP 627 with a step size of 200 bp and a window length of 1,000 bp to assess sequence variation. Based on the sequence alignment, Ka and Ks substitution rates, along with Ka/Ks ratios for all chloroplast genes, were estimated using KaKs_Calculator 3.0.28
Haplotype analysis
Using MN199032 as the reference, the chloroplast genomes of Glycyrrhiza were constructed with BCFtools (version 1.19.2) based on the variant sites identified in 60 Glycyrrhiza uralensis samples. Multiple sequence alignment of Glycyrrhiza nucleotide sequences was performed using MAFFT (version 7.526).26 Haplotype numbers were determined using DnaSP 6 software.27 Furthermore, haplotype diversity was assessed, and a haplotype network was constructed using POPART (version 1.7).29
Population structure analysis
SNP filtering was performed using VCFtools (version 0.1.16)30 with the following parameters: missing rate < 50% and minor allele frequency > 0.05. VCF-formatted files were converted to PHYLIP format using PLINK (version 7.505).31 Multiple sequence alignment was conducted on the PHYLIP-formatted files using MAFFT software (version 7.526).26 In IQ-TREE2 (version 2.0)32, the bootstrap value was set to 1000 to construct the maximum likelihood (ML) phylogenetic tree. The resulting tree file was visualized using FigTree (version 1.4.4).33 Population structure analysis of SNPs from 60 Glycyrrhiza samples was conducted using ADMIXTURE (version 1.3.0), with the number of genetic clusters (K) set to range from 2 to 10. Visualization for K = 2, K = 3, and K = 4 was performed in R.34
Analysis of RNA-Seq and RNA editing efficiency
Twelve RNA-seq datasets were obtained from the SRA database (https://www.ncbi.nlm.nih.gov/sra) (PRJNA977447; accessed on 17 August 2024). Clean reads from these samples were mapped to the MN199032 chloroplast genome using Salmon (version 2.0.1).35 Transcript abundance was quantified in transcripts per million (TPM) using default parameters and visualized with R packages. For the 12 samples, raw sequencing reads were mapped to the MN199032 chloroplast genome via the Burrows–Wheeler Aligner (version 0.7.17).23 High-quality SNPs were obtained through standard GATK (version 4.4.0.0) pipeline filtering. RNA editing sites were detected from SNPs using the REDO software (version 1.0), and the results were visualized using R packages.36
Results
Comparative analysis of chloroplast genes in the genus Glycyrrhiza
To better compare the variation in chloroplast genomes among different Glycyrrhiza varieties, we conducted a whole-genome comparative analysis using mVISTA software21 (https://genome.lbl.gov/vista/index.shtml) (accessed on 5 September 2024). The chloroplast genome sequence MN199032 was used as the reference, alongside six chloroplast genomes of Glycyrrhiza varieties, including MH321931, MN562092, KY038482, KU862308, PP119340, and PP119343 (Figure 1, Table S1). Sequence variation in non-coding regions was primarily concentrated in the 15–27, 30–36, 46–60, 66–69, 79–81, 108, and 124 kb regions, while coding regions of genes such as rps4, accD, petB, ycf1, ycf2, and ndhF also presented detectable sequence differences. Overall, the high conservation of coding regions alongside variable noncoding regions suggests that such genomic structural differences may influence gene expression and photosynthetic efficiency, potentially contributing to the adaptation of Glycyrrhiza to saline environments.
Comparative analysis of chloroplast genes in six Glycyrrhiza varieties. Note: With the chloroplast genome sequence of MN199032 (Glycyrrhiza uralensis) as a reference, the complete chloroplast genome sequences of the Glycyrrhiza varieties were examined. The transcriptional orientation of genes is depicted by gray arrows and bold black lines. Exonic regions are marked with purple rectangles, untranslated regions (UTRs) with light blue bars, and conserved noncoding sequences (CNS) with red bars. mRNA-corresponding segments are shown as gray bars, while white areas display sequence variations among all compared chloroplast genomes. The x-axis indicates nucleotide positions along the chloroplast genome, and the y-axis represents the sequence homology percentage, scaled from 50% to 100%.
Adaptive evolution of the chloroplast genomes in Glycyrrhiza uralensis
Resequencing data from 60 genomes of Glycyrrhiza uralensis collected from the central, eastern, and southern regions of Xinjiang Province, China,6 were analyzed to calculate the nucleotide diversity (Pi) values of these chloroplast genomes (Table S2). The results revealed that intergenic regions presented relatively higher nucleotide diversity compared to coding regions did. Significantly higher Pi values (>0.005) were particularly observed in the trnA-exon2-rrn23 and trnA-exon1-trnA-exon2 regions (Figure 2). To investigate the adaptive evolution of Glycyrrhiza, the Ka/Ks ratios of protein-coding genes were analyzed in 60 Glycyrrhiza uralensis chloroplast genomes, along with six Glycyrrhiza varieties involved in the chloroplast genome comparison (Figure 3). The visualized results revealed that the Ka/Ks ratios for all the genes were less than 1, indicating the dominance of purifying selection. These findings suggest a high degree of conservation in the evolutionary processes of Glycyrrhiza chloroplast genes. The variability of non-coding regions, in conjunction with the high conservation of functional genes, constitutes a characteristic feature of the Glycyrrhiza chloroplast genome, which may enhance adaptation to saline environments by modulating photosynthesis and gene expression.
Nucleotide diversity (Pi) of the chloroplast genomes of 60 Glycyrrhiza uralensis accessions. Note: The horizontal axis represents the nucleotide position, and the vertical axis indicates the nucleotide diversity at each site. The analysis was performed with a 200 bp step size and a 1000 bp window length.
(1) Evolutionary values of the Ka/Ks ratio in 60 Glycyrrhiza uralensis. (2) Evolutionary values of the Ka/Ks ratios of the 6 Glycyrrhiza varieties. Note: The Ka/Ks ratios for all genes of 60 Glycyrrhiza uralensis and 6 Glycyrrhiza varieties were less than 1.
Haplotype analysis of chloroplast genes
The chloroplast genomes of 60 Glycyrrhiza uralensis plants were used for haplotype analysis, resulting in the identification of 57 haplotypes (Figure 4; Table S3). Based on geographical distribution, the Glycyrrhiza uralensis population was divided into three groups. The classification of haplotypes largely aligned with the geographical distribution. The central region comprised 18 haplotypes, the eastern region included 21 haplotypes, and the southern region contained 20 haplotypes. However, several haplotypes, such as Hap_27 and Hap_15, were shared across regions, indicating potential gene flow and hybridization among populations from different regions. The haplotype analysis revealed that Hap_37, typically associated with the central region, was specific to the eastern region, whereas Hap_3 and Hap_25, assigned to the southern region, were also found in the central region. The diversity and interregional distribution patterns of the chloroplast haplotypes suggest that gene flow and local adaptation may have jointly shaped the population structure of Glycyrrhiza uralensis and that such genetic diversity may enhance its adaptive capacity under saline stress conditions.
The haplotype network was constructed based on the variant sites of 60 Glycyrrhiza uralensis genomes. Note: The colors used in the figure are as follows: red represents varieties from the central region, green represents varieties from the eastern region, and purple represents varieties from the southern region. In the haplotype network structure, each node represents a distinct haplotype, with its size proportional to the number of individuals sharing that haplotype. The connecting lines between nodes indicate relationships between haplotypes. The color scheme of the nodes in the network is consistent with that in the phylogenetic tree, ensuring visual coherence.
Analysis of population genetic structure
Population structure refers to the varying degrees of genetic relatedness among subgroups within a species [36]. Cross-validation (CV) error values were calculated for K values between 2 and 10 during the admixture-based population structure analysis of Glycyrrhiza uralensis. The optimal number of ancestral components was determined by identifying the K value with the minimum CV error. The figure illustrates the genetic composition of the population for K values ranging from 2 to 4 (Figure 5). The Glycyrrhiza uralensis population was assigned to three major clades, with the minimum CV error observed at K = 3. Notably, the eastern group includes two varieties from the central region, and the central group includes two varieties from the eastern region. All southern varieties are grouped together, which is largely consistent with the results from the haplotype analysis and phylogenetic tree construction. This interpopulation genetic admixture may reflect historical germplasm exchange and ecological migration processes, which have contributed to the accumulation of important genetic foundations for the survival and adaptation of Glycyrrhiza uralensis in saline environments.
Population structure analysis of the chloroplast genomes of 60 Glycyrrhiza uralensis based on SNPs. Note: The colors used in the figure are as follows: red represents varieties from the central region, green represents varieties from the eastern region, and purple represents varieties from the southern region. In fact, UW represents varieties from the eastern regions, SW represents varieties from the central region, and YW represents varieties from the southern region.
Phylogenetic tree based on SNPs
The 60 chloroplast genomes of Glycyrrhiza uralensis were compared with the chloroplast genome of MN199032, resulting in the identification of 422 SNPs and the construction of a maximum likelihood (ML) phylogenetic tree based on the constant sites (Figure 6). The phylogenetic results based on SNP sites are basically consistent with the results from haplotype analysis and population origin. The phylogenetic tree is divided into three primary branches, representing the central, eastern, and southern regions. UW−20 and UW−10 from the eastern region were assigned to the central genetic clade, while SW−04 from the central region clustered with the eastern lineage. Notably, the central accessions SW−05, SW−08, and SW−18 were grouped within the southern clade. The distribution of these SNPs is highly consistent with the previous haplotype and population structure analyses. Variation in the chloroplast genome not only maintains regional genetic differentiation but also promotes overall genetic diversity through gene flow, thereby enhancing the adaptation of Glycyrrhiza to saline environments.
The phylogenetic tree was constructed based on the SNPs of the genomes of 60 Glycyrrhiza uralensis from Xinjiang Province, China. Note: The central varieties are represented by red, the eastern varieties are represented by green, and the southern varieties are represented by purple.
Responses of chloroplast genes to salt stress in Glycyrrhiza
Chloroplasts are sites where photosynthesis and various biochemical reactions occur and are highly sensitive to salt stress.37 Chloroplasts have evolved intricate adaptive mechanisms to acclimate to salt stress. Twelve transcriptome datasets of the chloroplast genomes were analyzed from the Glycyrrhiza uralensis and Glycyrrhiza inflata varieties (Figure 7). The genes psal, trnA-UGC, rpl36, petL, trns-GGA, trnL-CAA and ndhC in Glycyrrhiza uralensis and Glycyrrhiza inflata rapidly responded to salt stress, with significant upregulation observed at 0.5 d. The expression levels of trnN-GUU, psbF, and trnG-GCC were significantly downregulated at 0.5 d and 15 d but were upregulated at 30 d. This pattern suggests that the expression of these genes was inhibited in the early stages, but as time progressed, their expression gradually recovered and increased by 30 d, likely reflecting plant adaptation or recovery mechanisms in response to external conditions. Genes such as rnl-UAA, trnG-UCC, psbJ, and trnL-UAG were significantly upregulated in the early stages of salt stress in Glycyrrhiza uralensis, while in Glycyrrhiza inflata, these genes were upregulated only in the middle stage of salt stress.
Heatmap of chloroplast gene expression in Glycyrrhiza inflata and Glycyrrhiza uralensis under salt stress. Note: IST1–3 represent Glycyrrhiza inflata subjected to salt stress for 0.5 d, 15 d, and 30 d, respectively, while ICT1–3 denote Glycyrrhiza inflata under control conditions for the same time points. Similarly, UST1–3 correspond to Glycyrrhiza uralensis exposed to salt stress for 0.5 d, 15 d, and 30 d, whereas UCT1–3 indicate Glycyrrhiza uralensis maintained under control conditions at the same time intervals.
The data from twelve transcriptomes were used to analyze RNA editing events in chloroplasts (Figure 8; Table S4). A total of 19 genes undergoing editing events were identified, with C-to-T editing being the most prevalent in chloroplast genomes. During the early stage of salt stress, 12 editing events were detected in Glycyrrhiza uralensis, whereas only 6 editing events were observed in the negative control group. Among the genes subjected to RNA editing, psbA exhibited the highest number of editing sites,24 followed by rrn23, with 11 sites. These findings suggest that RNA editing in Glycyrrhiza uralensis facilitates a rapid response during the early stage of salt stress, potentially contributing to the repair capacity of the photosystem, ribosome assembly and protein synthesis. Chloroplast genes in Glycyrrhiza exhibit time-dependent dynamic regulation, with genes initially suppressed during the early stages gradually upregulated, indicating the activation of pathways related to photosynthesis, protein synthesis, and energy metabolism in response to salt stress. Meanwhile, RNA editing events increase significantly in the early stages of salt stress, potentially facilitating photosystem repair and ribosome assembly, thereby enhancing the rapid response and adaptation of Glycyrrhiza under salt stress.
The RNA editing efficiency of chloroplast genes under salt stress was analyzed in Glycyrrhiza inflata and Glycyrrhiza uralensis. Note: The experimental groups were defined as follows: IST1−3 represent Glycyrrhiza inflata subjected to salt stress for 0.5 d, 15 d, and 30 d, respectively; ICT1−3 denotes Glycyrrhiza inflata under control conditions for the same time points. Similarly, UST1−3 correspond to Glycyrrhiza uralensis exposed to salt stress at 0.5 d, 15 d, and 30 d, while UCT1−3 refer to Glycyrrhiza uralensis maintained under control conditions for the corresponding durations.
Discussion
As an important tool for studying plant evolution and phylogeny, the chloroplast genome revealed a balance between conservation and variation through comparative analysis of the six Glycyrrhiza varieties in this study. The chloroplast genomes of all six varieties were approximately 127 kb in size, indicating a highly conserved genomic structure, which is consistent with findings from previous studies on the chloroplast genomes of various plant species.38 Genomic variations were primarily concentrated in non-coding regions, a pattern commonly observed in comparative analyses of plant chloroplast genomes. This study identified multiple highly variable noncoding regions in Glycyrrhiza, particularly in certain intronic regions that presented significant polymorphisms. Nucleic acid diversity analysis revealed seven variable regions, including five intergenic regions and two genic regions. These regions may play crucial roles in regulating the expression of neighboring genes, and their variations could serve as regulatory reservoirs, enabling plants to respond rapidly to abiotic stress through epigenetic or posttranscriptional regulatory mechanisms.39 Although coding regions generally remained conserved, significant interspecific divergence was observed in genes such as accD, ycf1 and ycf2. These genes may have undergone species-specific selective pressures, and their variation patterns reflect the adaptive evolution of Glycyrrhiza to diverse ecological environments. Variable regions of the chloroplast genome can serve as candidate markers for plant DNA barcoding, enabling rapid species identification. In Taxus, the accD gene and the rrn16–rrn23 intergenic spacer have been confirmed as effective and specific barcodes for distinguishing species.40 Studies have shown that the ycf2 and ycf1 genes exhibit significant variation among different species, with structural variation and even complete loss observed in Passiflora.41 This suggests the possible existence of alternative translation systems and motor protein complexes that compensate for the loss of these genes. The functional redundancy of the ycf1 gene allows it to accumulate a certain degree of genetic variation, fully demonstrating the plasticity of the chloroplast genome during evolution. This study further revealed the unique variation patterns of these variable genes in Glycyrrhiza, providing new insights into the adaptive evolution of the chloroplast genome.
Ka/Ks analysis was performed on the chloroplast genomes of 60 Glycyrrhiza uralensis varieties and six different Glycyrrhiza varieties. The results revealed that the Ka/Ks ratios of all protein-coding genes were less than 1, indicating strong purifying selection acting on the chloroplast genomes of Glycyrrhiza. Notably, the ndhB gene in Glycyrrhiza uralensis and the ycf1 gene across the six Glycyrrhiza varieties presented ratios close to the neutral selection threshold, suggesting that these genes may play important roles in adaptive evolution. The ndhB complex, as a key component of the chloroplast electron transport chain, plays a crucial role in cyclic electron flow, thereby regulating photosynthetic efficiency.42 Additionally, ndhB is closely associated with plant responses to abiotic stress. The elevated Ka/Ks ratio of ndhB may indicate that this gene is adapting to environmental pressures or has undergone functional changes driven by natural selection, providing an evolutionary basis for physiological regulation in plants.13 Ka/Ks analysis revealed that while the chloroplast genomes of Glycyrrhiza are under strong purifying selection overall, potential functional variations in the ndhB and ycf1 genes offer important insights into the adaptive evolution of Glycyrrhiza. These findings provide valuable clues for further exploration of the molecular evolution of key functional genes and the mechanisms underlying the adaptive evolution of Glycyrrhiza.
Among the 60 chloroplast genomes of Glycyrrhiza uralensis, a total of 57 haplotypes were identified, indicating high genetic diversity within the population. Based on haplotype network analysis, the varieties were divided into three distinct groups. These groups showed a significant correlation with geographical distribution, leading to their classification into three regions: eastern Glycyrrhiza, southern Glycyrrhiza, and central Glycyrrhiza. The phylogenetic tree constructed using SNPs from Glycyrrhiza was consistent with previous studies based on nuclear genomes, validating the robustness of these markers.6 The chloroplast genome has a conserved structure and a moderate mutation rate, making its SNP markers potentially highly versatile for closely related or widely distributed species16,17 Given that the chloroplast genome is maternally inherited, its variation patterns can trace maternal lineage history and reveal evolutionary dynamics more rapidly than nuclear genome data.
Salt stress affects plant growth and development through multiple physiological mechanisms. It can lead to structural damage in chloroplasts, dysfunction of the photosynthetic electron transport chain, disruption of cellular osmotic regulation, and disturbances in reactive oxygen species metabolism.43^,^44 Taking Glycyrrhiza inflata and Glycyrrhiza uralensis as examples, studies have shown that after 0.5 d of salt stress treatment, the expression levels of multiple genes in their chloroplast genomes, such as psaA, trnA-UGC, rpl36 and petL, are significantly upregulated, suggesting that these genes may be involved in the early response to salt stress. Research has shown that the protein encoded by the psaA gene helps ferns adapt to the new photosynthetic environment following the rise of angiosperms.45 Moreover, studies on rice have demonstrated that the overexpression of the rpl6 gene, which encodes a large ribosomal subunit protein, significantly enhances plant tolerance to 150–200 mM salt stress.46 Based on sequence and functional similarity, the homologous rpl36 gene may play a similar role in salt tolerance in Glycyrrhiza varieties. Additionally, genes involved in photosynthetic electron transport, such as petM and petL, also exhibit salt stress-responsive characteristics.47 Notably, petL is particularly significantly upregulated early in Glycyrrhiza uralensis, suggesting that this species may rapidly adjust the expression of electron transport chain-related genes to cope with salt stress. Interestingly, different Glycyrrhiza varieties exhibit temporal variations in their gene responses to salt stress. For instance, the trnL-UAA and psbJ genes were significantly upregulated in Glycyrrhiza uralensis as early as 0.5 d, whereas their upregulation in Glycyrrhiza inflata was delayed until 15 d. This difference in response speed may be one of the key factors contributing to the variation in salt tolerance between the two species. Moreover, the expression of certain genes, such as psbF, displays dynamic patterns—downregulated in the early stages (0.5 d and 15 d) but upregulated later (30 d)—reflecting the phased regulatory strategy of Glycyrrhiza in response to salt stress.
RNA editing serves as a crucial posttranscriptional regulatory mechanism in chloroplast genomes, which precisely modulates chloroplast development and physiological functions through specific base modifications that alter RNA coding sequences.48 This mechanism significantly enhances the phenotypic plasticity of plant genomes, representing a vital molecular basis for environmental adaptation.49 The results of the present study revealed that salt stress induced RNA editing in 19 chloroplast genes in Glycyrrhiza uralensis, with C-to-T being the predominant type. A twofold increase in editing sites was detected during the early stress phase (0.5 d; 12 sites in the treatment group vs. 6 in the control group), including 24 high-density editing sites in psbA and 11 editing sites in rrn23. In mature chloroplasts, the light-dependent formation of ribosome-psbA mRNA complexes not only accelerated the synthesis of the D1 protein, a key factor in photosystem II (PSII) repair, but also substantially increased global translational efficiency through systemic regulation.50 Transcriptome profiling further demonstrated sustained upregulation of photosystem-related psaL and psbJ genes throughout the salt stress response.
This study revealed that different Glycyrrhiza varieties presented significant differences in chloroplast gene expression and RNA editing patterns under salt stress. These temporal and intensity variations likely reflect the evolution of salt tolerance in each variety. Rapidly upregulated genes and early RNA editing events may provide molecular support for photosystem repair and photosynthetic homeostasis, thereby increasing the survival capacity of these species under salt stress. These findings not only reveal the functional dynamics of Glycyrrhiza chloroplast genomes in response to salt stress but also provide important insights into the evolutionary mechanisms underlying interspecies differences in salt tolerance.
Conclusion
This study conducted a comparative analysis of the chloroplast genomes of different Glycyrrhiza varieties, with the main findings summarized as follows: (1) the chloroplast genomes are generally conserved, with seven hypervariable regions identified; (2) genes such as ndhB and ycf1 may exhibit signatures of adaptive evolution; (3) RNA editing, particularly in psbA and rrn23, increases significantly during the early stages of salt stress, facilitating photosystem repair; and (4) different Glycyrrhiza varieties display distinct gene expression patterns under salt stress, reflecting potential differences in salt tolerance. These results provide candidate genes and molecular markers for the molecular breeding of salt-tolerant Glycyrrhiza and offer a theoretical basis for the identification and improvement of related functional genes.
Supplementary Material
Supplementary materialTable S4 Statistics on RNA editing sites in Glycyrrhiza.
Supplementary materialTable S3 Statistical analysis of haplotype numbers in sixty Glycyrrhiza uralensi.
Supplementary materialTable S2 Information of sixty Glycyrrhiza uralensis.
Supplementary materialTable S1 Information of seven Glycyrrhiza varieties.
The reference list from the paper itself. Each links out to its DOI / PubMed record.
- 1Shang Z, Liu C, Qiao X, Ye M. Chemical analysis of the Chinese herbal medicine licorice (Gan-Cao): an update review. J Ethnopharmacol. 2022;299:115686. doi: 10.1016/j.jep.2022.115686.36067839 · doi ↗ · pubmed ↗
- 2Hosseinzadeh H, Nassiri-Asl M. Pharmacological effects of Glycyrrhiza spp. and its bioactive constituents: update and review. Phytother Res. 2015;29(12):1868–1886. doi: 10.1002/ptr.5487.26462981 · doi ↗ · pubmed ↗
- 3Yo YT, Shieh GS, Hsu KF, Wu CL, Shiau AL. Licorice and licochalcone-A induce autophagy in LN Ca P prostate cancer cells by suppression of Bcl-2 expression and the m TOR pathway. J Agric Food Chem. 2009;57(18):8266–8273. doi: 10.1021/jf 901054 c.19711916 · doi ↗ · pubmed ↗
- 4Liu W, Huang S, Li Y, Wu P, Wang Q, Zheng X, Zhang K. Glycyrrhizic acid from licorice down-regulates inflammatory responses via blocking MAPK and PI 3K/Akt-dependent NF-κB signalling pathways in TPA-induced skin inflammation. Med Chem Comm. 2018;9(9):1502–1510. doi: 10.1039/C 8MD 00288 F.30288224 PMC 6148683 · doi ↗ · pubmed ↗
- 5Dang H, Zhang T, Li Y, Zhuang L, Pu X. Population evolution, genetic diversity and structure of the medicinal legume, Glycyrrhiza uralensis and the effects of geographical distribution on leaves nutrient elements and photosynthesis. Front Plant Sci. 2022;12:708709. doi: 10.3389/fpls.2021.708709.35069610 PMC 8782460 · doi ↗ · pubmed ↗
- 6Luiz AC. Beyond conservation: the landscape of chloroplast genome rearrangements in angiosperms. New Phytol. 2025;247(6):2571–2580. doi: 10.1111/nph.70364.40613318 PMC 12371153 · doi ↗ · pubmed ↗
- 7Li Q, Wang X, Yan K, Liang Z, Xia P. Based on multiple environmental factors to explore the habitat distribution of Licorice (Glycyrrhiza uralensis) in different time and space. Biochem Syst Ecol. 2022;5:104490. doi: 10.1016/j.bse.2022.104490. · doi ↗
- 8Xu Y, Lu JH, Zhang JD, Liu D, Wang Y, Niu Q, Huang D. Transcriptome revealed the molecular mechanism of Glycyrrhiza inflata root to maintain growth and development, absorb and distribute ions under salt stress. BMC Plant Biol. 2021;21(1):599. doi: 10.1186/s 12870-021-03342-6.34915868 PMC 8675533 · doi ↗ · pubmed ↗