Beyond BRCA deficiency: Clinical and molecular predictors of survival in patients with BRCA-deficient tubo-ovarian high-grade serous carcinoma
Dale Garsed, Tibor Zwimpfer, Sian Fereday, Ahwan Pandey, Dinuka Ariyaratne, Madawa Jayawardana, Laura Twomey, Céline Laumont, Catherine Kennedy, Adelyn Bolithon, Nicola Meagher, Katy Milne, Phineas Hamilton, Jennifer Alsop, Antonis Antoniou, George Au-Yeung, Matthias Beckmann

TL;DR
This study explores why some patients with BRCA-deficient ovarian cancer have poor survival, identifying genomic and immune factors that influence outcomes.
Contribution
The study reveals that HRD and specific genomic alterations like NF1 loss or PIK3CA amplification influence survival in BRCA-deficient HGSC patients.
Findings
BRCA1-deficient tumors with higher HRD scores were associated with longer survival.
BRCA2-deficient tumors with NF1 loss had better survival, while PIK3CA/RAD21 amplification led to worse outcomes.
Residual disease after surgery had less impact on survival in BRCA mutation carriers compared to non-carriers.
Abstract
BRCA-associated homologous recombination deficiency (HRD) is present in ~ 50% of high-grade serous carcinomas (HGSC) and predicts sensitivity to platinum-based therapy. However, there is little understanding of why some patients with BRCA-deficient tumors experience unexpectedly poor outcomes. We profiled 154 tumors, enriched for patients with BRCA-deficient tumors that experienced short overall survival (≤ 3 years, n = 42), using whole-genome, transcriptome, and methylation analyses. All but one BRCA-deficient tumor exceeded an accepted HRD genomic scarring threshold. However, patients with BRCA1-deficient HGSC with a more elevated HRD score survived significantly longer. Patients with BRCA2-deficient HGSC and loss of NF1 survived twice as long as those without NF1 loss, whereas PIK3CA or RAD21 amplification defined BRCA2-deficient HGSC with exceptionally short survival.…
Genes, proteins, chemicals, diseases, species, mutations and cell lines named across the full text — each resolved to its canonical identifier and authoritative record.
Click any figure to enlarge with its caption.
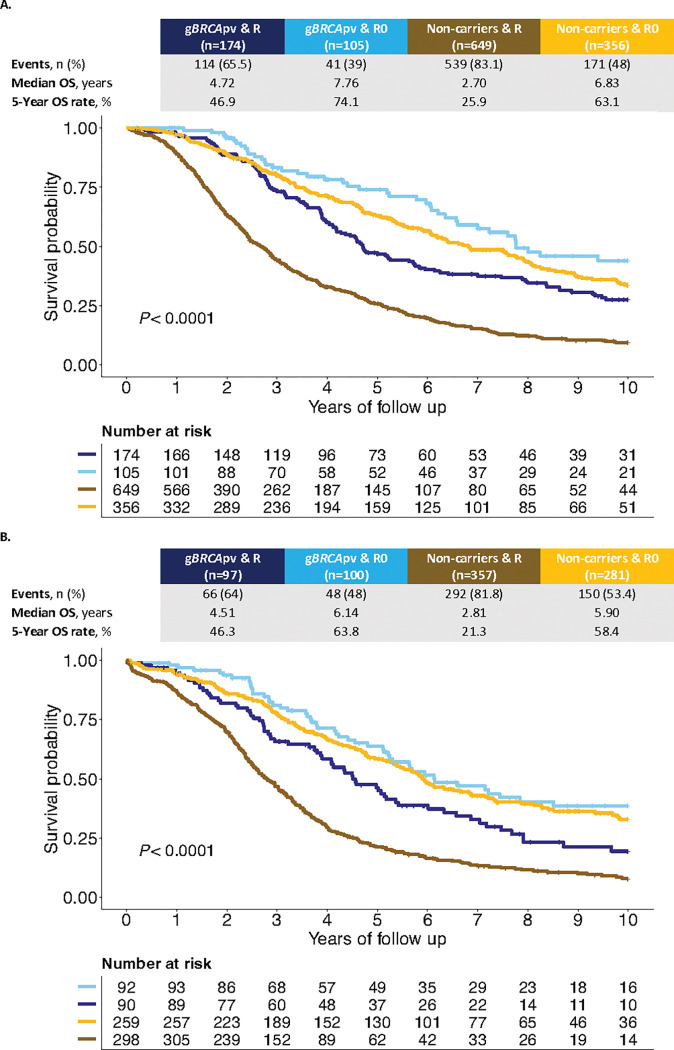 Figure 1
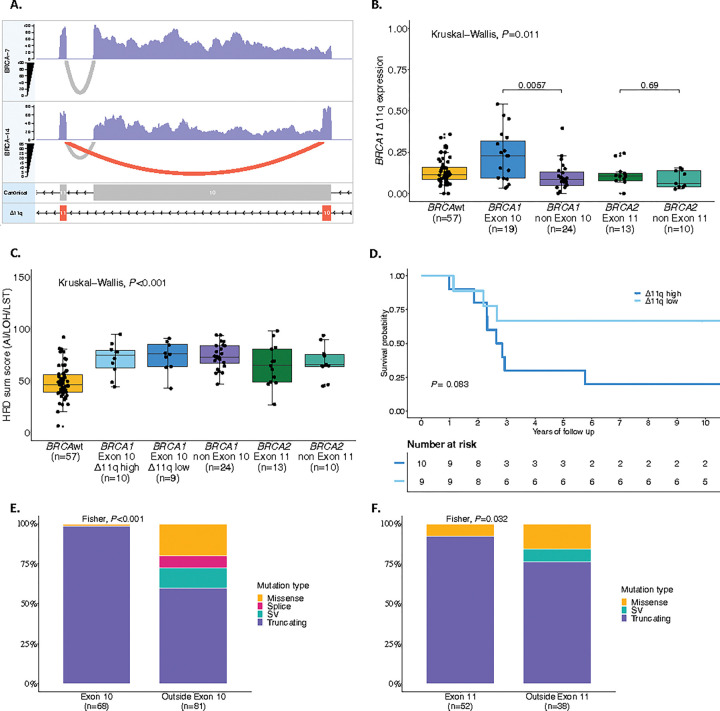 Figure 2
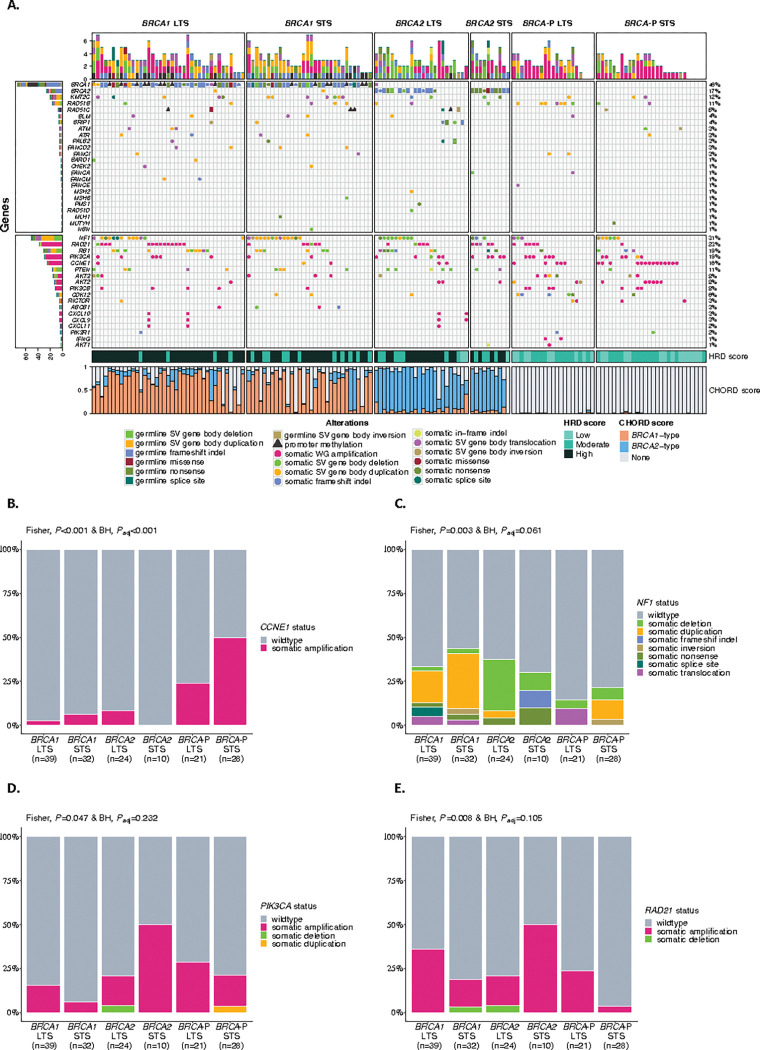 Figure 3
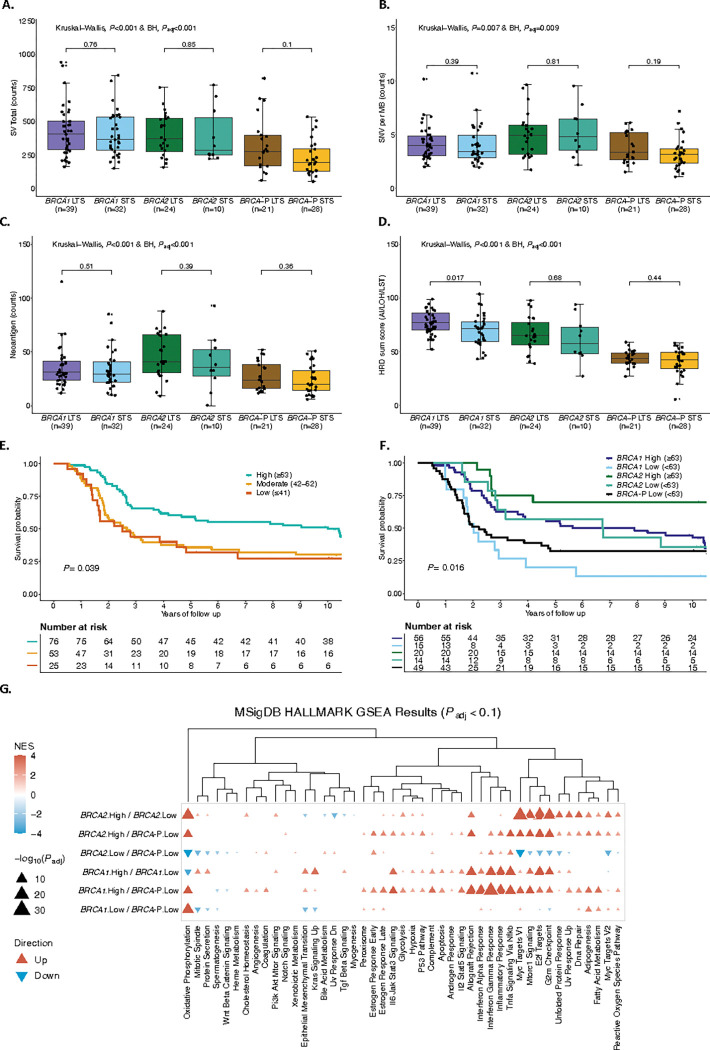 Figure 4
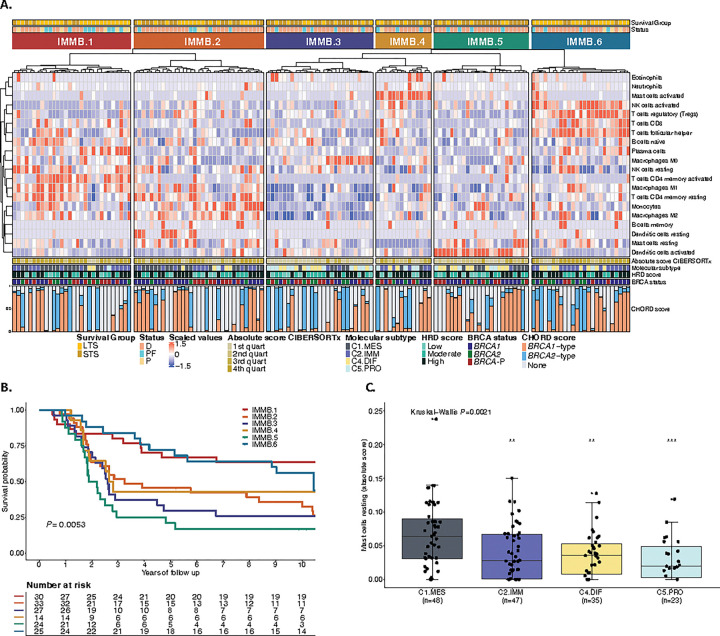 Figure 5
Peer Reviews
No public reviews on file for this paper yet. If you reviewed it on a platform where reviews are public (OpenReview, ICLR, NeurIPS, ICML), you can paste yours below so the community can read it here.
Videos
No videos yet. Explain this paper in a talk, walkthrough, or lecture? Add one.
Taxonomy
TopicsPARP inhibition in cancer therapy · BRCA gene mutations in cancer · Ovarian cancer diagnosis and treatment
INTRODUCTION
The identification of clinical and molecular determinants of survival in patients with cancer has the dual benefits of finding biomarkers that may guide patient management or provide novel therapeutic opportunities. Until relatively recently, the identification of prognostic biomarkers in ovarian cancer has been confounded by a lack of appreciation of the distinctly different molecular characteristics of the various histologic subtypes that make up epithelial ovarian cancer^1^. Evaluating histologically homogenous sets of ovarian tumors has been critical in deciphering the prognostic importance of proteins such as p53^2,3^ and WT1^4^, and identifying genetic risk loci^5–12^.
High-grade serous carcinoma (HGSC) is the most common histotype, accounting for approximately 70% of ovarian cancer deaths in Western countries^13–16^. Homologous recombination-mediated DNA repair deficiency (HRD) is frequent in HGSC and is most often associated with mutations in BRCA1 and BRCA2^17–19^. Approximately fifty percent of HGSC are regarded to have HRD, a feature that can be inferred through specific patterns of genomic scarring in tumor cells^13,20–25^. HRD leads to genomic instability and tumorigenesis, providing a vulnerability in tumor cells with increased sensitivity to double-strand DNA breaks that can be exploited therapeutically^26–28^. As a result, platinum-based chemotherapy and poly (ADP-ribose) polymerase inhibitor (PARPi) maintenance therapy are generally more effective in patients with HRD tumors^28–33^.
While HRD status is informative, accurate prediction of treatment response and survival in HGSC cannot be simply determined by the presence or absence of mutations in genes associated with HR DNA repair. The initial survival advantage for carriers of pathogenic germline BRCA1 variants (gBRCA1pv) diminishes over time, with fewer gBRCA1pv-carriers surviving 10 years after diagnosis than either gBRCA2pv-carriers or non-carriers^33–35^. Factors associated with survival outcome in HGSC include residual disease following cytoreductive surgery^16,36–38^, the molecular subtype of the tumor^39^, age at diagnosis^40^, and the extent of T- and B-cell infiltration into tumors^41,42^. In germline pathogenic variant carriers, the location of mutations within BRCA1 or BRCA2 or the retention of the wildtype allele in the tumor can result in a hypomorphic phenotype associated with resistance to platinum-based therapy^43–47^. Furthermore, revertant mutations restoring BRCA1 and BRCA2 function contribute to acquired resistance to platinum-based therapy and PARPis, impacting treatment response and patient outcomes^48–50^.
Comparing patients who represent the extremes of survival outcomes may provide increased sensitivity to identify prognostic biomarkers that are relevant to a wider patient population^51^. Using this approach, we have recently shown that plasma cell infiltration and other molecular changes, including co-loss of BRCA and the tumor suppressor RB1, are associated with especially long-term survival in HGSC^22,52,53^. The current study evaluates BRCA-deficient HGSC by first focusing on gBRCApv-carriers and then expanding to include somatic mutations and promoter methylation in BRCA1/2, and other key HR genes, as well as evaluating tumor HRD status. We focus on patients with either poor or favorable survival outcomes, harnessing the value of analyzing patients with exceptional survival outcomes while comparing cohorts that are as similar as possible in other respects.
RESULTS
Association of residual disease with prognosis is attenuated in gBRCApv-carriers
Pathogenic germline BRCA variants (gBRCApv) were identified in 20% of patients in the Australian Ovarian Cancer Study (AOCS) cohort (n = 282/1389) (Table 1, Supplementary Tables S1 and S2). In applying a survival model, there was evidence that the proportional hazards assumption did not hold (P < 0.001), thus an Accelerated Failure Time (AFT) model^54^ was used with results reported as Time Ratios (TR; see Methods), where TR > 1 indicates longer time to progression or death, and a TR < 1 indicates shorter survival or time to progression. Patients with gBRCApvs exhibited improved overall survival (OS; TR: 1.53, 95% CI: 1.33–1.76, P < 0.001) and progression-free survival (PFS; TR: 1.34 95% CI: 1.28–1.53, P < 0.001) compared with non-carriers (Supplementary Tables S3 and S4).
We considered whether clinical characteristics differed by germline BRCA status and found a statistically significant interaction with residual disease status (P-interaction = 0.011; Supplementary Table S3). Using this interaction term, we found that the negative effect of residual disease after cytoreductive surgery on OS was less pronounced in gBRCApv-carriers (TR: 0.87, 95% CI: 0.72–1.06, P = 0.162) than in non-carriers (TR: 0.51, 95% CI: 0.44–0.59, P < 0.001; Fig. 1a, Table 2). The importance of residual disease for survival in non-carriers was confirmed in the independent OTTA cohort (n = 1004, gBRCApv-carriers = 221, 22%; Fig. 1b, Extended Data Figs. 1 and 2a).
We examined the relationship of residual disease and BRCA status to known immune and molecular features associated with survival, including tumor-infiltrating lymphocytes (TIL)^42,55^, RB1 loss^22,52,56^, and transcriptional molecular subtypes^39^. Non-carriers with residual disease had an inverse association with high CD8 + TIL density (P = 0.016), with 38.3% of tumors classified as having low or no TIL (Extended Data Fig. 2b, Supplementary Table S5). This group also showed an inverse association with the C4/differentiated (C4.DIF) molecular subtype (P = 0.010; Extended Data Fig. 2b). We observed an association between the C1/mesenchymal (C1.MES) molecular subtype and residual disease as previously reported^57^, but this was only statistically significant among non-carriers (P = 0.005). RB1 loss was associated with gBRCApv-carriers without residual disease (P < 0.001; Extended Data Fig. 2b).
Although no statistically significant interaction between neoadjuvant chemotherapy (NACT) and BRCA status was observed (P-interaction = 0.12; Supplementary Table S3), there was evidence of heterogeneity of effect in these subgroups. Among participants who did not receive NACT, gBRCApv-carriers showed a survival benefit compared to non-carriers (TR: 1.60, 95% CI: 1.37–1.87, P < 0.001; Supplementary Table S6, Extended Data Fig. 3). In contrast, the overall survival benefit in gBRCApv-carriers versus non-carriers was not statistically significant in the NACT group (TR: 1.39 and 1.17, 95% CI: 0.75–2.60 and 0.62–2.21, P = 0.298 and P = 0.634 respectively, compared to non-carriers who did not receive NACT).
gBRCApv location and type are associated with survival and therapy response
Mutations located in various functional domains of BRCA1 and BRCA2 have been associated with differences in survival and responses to PARPi in ovarian cancer^43,44^. The mutation type and location of gBRCApvs was ascertained for 240 of the patients in the AOCS cohort from their clinical records and/or previous sequencing analyses^22,56,58,59^ (Extended Data Figs. 4a,b and Supplementary Table S2). Following adjustment for FIGO stage, residual disease status, primary site, age, and first-line treatment, patients with gBRCA1pvs in exon 10 had a statistically significant improved OS and PFS (TR: 1.54 and 1.49, 95% CI: 1.19–2.00 and 1.16–1.91, P < 0.001 and P = 0.002, respectively ), but the association was attenuated for those with variants outside exon 10 (TR: 1.21 and 1.18, 95% CI: 0.97–1.51 and 0.96–1.46, P = 0.09 and P = 0.12, respectively) compared to non-carriers (Table 3). More specifically, pathogenic variants in the DNA binding domain (DBD) of BRCA1, located in exon 10, were associated with an OS and PFS benefit compared to non-carriers (TR: 1.60 and 1.58, 95% CI: 1.14–2.25 and 1.15–2.18, P = 0.005 and P = 0.006, respectively; Table 3). In contrast, the OS and PFS benefit was not statistically significant for patients with pathogenic variants in the Really Interesting New Gene (RING) (TR: 1.28 and 1.15, 95% CI: 0.87–1.90 and 0.82–1.61, P = 0.216 and P = 0.419, respectively) and C-terminal domains of BRCA1 (BRCT) (TR: 1.35 and 1.43, 95% CI: 0.83–2.20 and 0.90–2.26, P = 0.222 and P = 0.126, respectively), located outside of exon 10.
Patients with BRCA1 variants in exon 10 have been reported to have poorer outcomes^46^ due to expression of an alternative splice isoform called BRCA1-delta11q (Δ11q) that bypasses almost all of exon 10 of BRCA1 (historically referred to as exon 11). To explore this further, we assessed BRCA1 isoform expression in our multi-omics cohort (n = 154) using the bulk RNA sequencing reads spanning the exon 10 to exon 11 junction (Fig. 2a, Supplementary Tables S7 and S8, Supplementary Information). The Δ11q isoform was widely expressed regardless of *BRCA-*status, but patients with BRCA1 variants in exon 10 had significantly higher proportions of Δ11q transcripts relative to canonical transcripts (P = 0.011; Fig. 2b). Patients with BRCA1 variants in exon 10 were classified as having high (n = 10) or low (n = 9) BRCA1 Δ11q expression, according to the median. Patients with high Δ11q expression had a shorter survival (median OS 2.74 years) compared to those with low Δ11q expression (median OS not reached), although this was not statistically significant (P = 0.083) and was not associated with differences in the HRD sum score (Figs. 2c,d and Supplementary Table S9).
Overall, patients with gBRCA2pv had an improved OS compared to non-carriers, regardless of mutation location (Table 3). The only exception was the small group (n = 13) with pathogenic variants in the DNA binding domain (DBD) of BRCA2, located outside of exon 11, who did not show a statistically significant OS or PFS benefit compared to non-carriers (TR: 0.79 and 0.81, 95% CI: 0.39–1.63 and 0.43–1.51, P = 0.528 and P = 0.506, respectively).
The type of mutation in BRCA1 and BRCA2 also plays a predictive role in response to PARPi therapy in ovarian cancer^43^. In our analysis, pathogenic variants in BRCA1 exon 10 and BRCA2 exon 11 were more likely to be truncating (98.6% and 92.3%) than those outside these exons (60% and 76.3%, P < 0.001 and P = 0.032 respectively; Figs. 2e,f). BRCA1 and BRCA2 domains associated with prolonged survival were more likely to have truncating variants than missense or splice site variants (P < 0.001 and P = 0.067, respectively; Extended Data Figs. 4c,d).
NF1 gene alterations are associated with improved survival in BRCA2-deficient HGSC
To identify genomic features associated with short survival in HRD tumors, we compared tumor genomes and transcriptomes between short (OS ≤ 3 years, STS) and long-term (OS > 3 years, LTS) survival groups (Fig. 3a). Tumor genomes were classified as either BRCA1-deficient, BRCA2-deficient or BRCA-proficient, which incorporated germline and somatic alterations in BRCA1 and BRCA2, as well as other well-defined HR genes, and tumor HRD status as determined by a mutational signature-based classifier (CHORD, Classifier of HOmologous Recombination Deficiency)^60^ (Supplementary Information and Supplementary Tables S10-S12). CCNE1 amplifications (gene level copy number ≥ 7) were associated with BRCA-proficiency, and particularly the short-survival *BRCA-*proficient group (50%, Padj<0.001; Fig. 3b). BRCA-proficient tumors had less genomic scarring and were associated with an older age at diagnosis compared to BRCA1-deficient and BRCA2-deficient tumors (Extended Data Figs. 5a,b). Gene methylation has been identified as a prognostic factor in HGSC^61^, but no significantly differentially methylated genes with corresponding up- or down-regulated gene expression were observed between STS and LTS groups in BRCA1- and BRCA2-deficient tumors (Supplementary Table S13 and Supplementary Information).
Alterations in NF1 were most common in BRCA-deficient tumors, regardless of survival group (BRCA1 STS 43.8%, BRCA1 LTS 33.3%, BRCA2 STS 30%, BRCA2 LTS 37.5%, BRCA-P STS 21.4%, BRCA-P LTS 14.3%, Padj=0.061; Fig. 3c and Supplementary Table S14). Notably, gene breakage caused by large-scale deletions was enriched in BRCA2-deficient tumors in the LTS group. We hypothesized that not all alteration types equivalently disrupt gene function. Indeed, only 54.2% (26/48) of NF1 alterations showed a locus-specific loss of heterozygosity (LOH) suggesting a loss-of-function (Supplementary Table S14 and Supplementary Information). Concordantly, NF1 mRNA expression varied in tumors according to the type of NF1 alteration and was particularly depleted in those with locus-specific LOH (P < 0.0001; Extended Data Fig. 6a). Patients with tumors that harbored loss-of-function NF1 alterations showed an improved survival compared to non-loss-of-function NF1 alterations (median OS 11.92 years vs 5.17 years, P = 0.032; Extended Data Fig. 6b). In particular, the combination of both BRCA2-deficiency and loss-of-function NF1 alteration (n = 11) was associated with the best survival outcome (median OS 16.96 years), almost twice as long as those with BRCA2-deficient tumors with no loss-of-function NF1 alteration (median OS 8.84 years; Extended Data Fig. 6c and Supplementary Table S9).
NF1 protein expression was assessed by IHC in a larger cohort enriched for long-term survivors (n = 658; Extended Data Fig. 1). NF1 protein loss was observed in 13.37% (n = 88/658) of patients and was associated with improved survival compared to retained NF1 expression (median OS 4.70 vs. 3.58 years, P = 0.028; Extended Data Fig. 7a). Although there were few patients with NF1 protein loss and germline BRCA1 (n = 21) or BRCA2 (n = 6) pathogenic variants, NF1 loss was associated with better survival in gBRCA2pv-carriers (median OS 8.05 years NF1 loss vs. 5.72 years NF1 retained) but not in gBRCA1pv-carriers (median OS 4.74 years NF1 loss vs. 4.69 years NF1 retained; Extended Data Fig. 7b). NF1 loss also was associated with a longer survival among non-carriers (median OS 5.01 years NF1 loss vs. 3.36 years NF1 retained; Extended Data Fig. 7b).
In the independent OTTA cohort with NF1 mRNA expression and survival data available (n = 5666), low NF1 expression (lowest quantile) was associated with improved survival compared to high expression (2nd to 5th quantiles) (median OS 4.19 vs. 3.56 years, P < 0.0001; Extended Data Figs. 1 and 7c). Consistent with the other cohorts, gBRCA2pv-carriers with low NF1 expression (n = 36) showed an improved survival (median OS 6.42 years NF1 low vs. 5.66 years NF1 high), while there was no effect in gBRCA1pv-carriers (median OS 5.41 years NF1 low vs. 5.65 years NF1 high, Extended Data Fig. 7d).
PIK3CA and RAD21 amplifications are associated with short survival in BRCA2-deficient HGSC
We found an enrichment of PIK3CA and RAD21 gene amplifications in BRCA2-deficient tumors in patients with short compared to long survival (PIK3CA: 5/10, 50% vs 4/24, 16.7%, Padj=0.232 and RAD21: 5/10, 50% vs 4/24, 16.7%, Padj=0.105, respectively; Fig. 3d,e). Co-occurrence of RAD21 and PIK3CA amplification was observed in 8.8% (3/34) patients with BRCA2-deficiency (Supplementary Tables S15 and S16). PIK3CA and RAD21 mRNA expression was highly correlated with copy number (P < 0.0001), and tumors with gene amplification (≥ 7 copies) had a significantly higher expression (P < 0.001 and P = 0.02, respectively) (Extended Data Fig. 8a,b and Supplementary Tables S17 and S18). Patients with combined BRCA2-deficiency and PIK3CA amplification (n = 9, median OS 2.89 years) or RAD21 amplification (n = 9, median OS 2.89 years) had a significantly worse prognosis compared to patients with BRCA2-deficient tumors without PIK3CA amplification (n = 25, median OS 11.92 years) or RAD21 amplification (n = 25, median OS 11.53 years; Extended Data Fig. 8c,d and Supplementary Table S9).
PI-3 kinase pathway activity is thought to contribute to tolerance to genome doubling and PIK3CA amplification in whole-genome duplicated tumors is a frequent event in HRD end-stage HGSC^49,62^. The STS BRCA2-deficient group was characterized by high ploidy (Padj=0.0073) and whole-genome duplication (Padj=0.0404), in contrast to BRCA1-deficient and BRCA-proficient tumors where the LTS groups tended to have higher ploidy (Extended Data Fig. 5a). The association between PIK3CA and survival by BRCA status was further corroborated in the OTTA cohort, where gBRCA2pv carriers with high PIK3CA RNA expression (highest quantile) had shorter survival relative to their counterparts with low expression (median OS 4.09 vs 7.43 years, P < 0.0001; Extended Data Fig. 8e). By contrast, gBRCA1pv carriers with high PIK3CA RNA expression showed improved survival (median OS 7.67 vs 5.23 years).
Elevated HRD scarring is prognostic for survival in BRCA-deficient HGSC
High tumor mutation burden has been shown to be associated with long-term survival in ovarian cancer^22^. However, we found that tumor mutation burden and predicted neoantigen counts were equivalent in BRCA1-deficient and BRCA2-deficient tumors between STS and LTS groups (Fig. 4a-c, Extended Data Fig. 5a, and Supplementary Table S19). Among various genomic features that were compared between these groups (Extended Data Fig. 5a), the HRD score^27^ was elevated in BRCA1-deficient tumors with long survival times compared to those with short survival times (P = 0.017; Fig. 4d). HRD score is a measure of genomic scarring associated with impaired HR repair, suggesting a more profound inactivation of the HR pathway in patients with good outcome. Retention of the wildtype allele with absence of locus specific LOH has been reported to influence outcomes in gBRCApv-carriers in ovarian and breast cancer^63–66^. However, in our cohort there was only one gBRCA2pv carrier without loss of the wildtype allele (patient BRCA_9; Supplementary Table S11 and Supplementary Information). Concordantly this tumor was HR-proficient with an HRD score of 27 (HRP ≤ 42 HRD sum score) and CHORD score of 0 (HRP ≤ 0.5 CHORD score), and the patient had short OS (< 3 years).
We observed a dynamic range in HRD scores, even among tumors with pathogenic BRCA mutations, suggesting a non-equivalence of alterations. The cutoff of the HRD score has been debated, with 42 mainly used in recent clinical trials^67–71^, and a more stringent threshold of 63 has been proposed for ovarian cancer^72^. Indeed, patients whose tumors had a high HRD score (≥ 63) had longer OS (median OS 10 years) compared to those with HRD scores of 42–62 (median OS 2.66 years) and ≤ 41 (median OS 2.5 years), regardless of BRCA-status (P = 0.039; Fig. 4e and Supplementary Table S9). Applying a threshold of 63 to divide samples into high and low HRD, all BRCA-proficient tumors had a low HRD score. Furthermore, patients with BRCA1- and BRCA2-deficient tumors and HRD scores ≥ 63 had longer OS compared to patients with lower HRD scores (median OS 6.76 vs. 2.01 years and 11.88 vs. 6.73 years, respectively; Fig. 4f and Supplementary Table S9). Notably, patients with BRCA1-deficient tumors with HRD scores < 63 had similar OS to patients with BRCA-proficient tumors (median OS 2.01 years vs 2.21 years).
Gene set enrichment analysis^73^ (GSEA; Methods) revealed distinct patterns of pathway regulation based on HRD scores and BRCA status in patients with HGSC. Specifically, pathway activation in BRCA1- and BRCA2-deficient patients with low HRD (< 63) closely resembled those of BRCA-proficient patients (Fig. 4g). In contrast, BRCA1-deficient patients with high (≥ 63) HRD scores showed an upregulation of several pathways, including interferon-gamma and inflammatory response. These pathways are primarily involved in host defense and immune surveillance^74^, underscoring their potential role in modulating the tumor microenvironment and influencing immune response in patients with BRCA1-deficient tumors.
CD8 + PD-1 + T cells are prognostic for survival in gBRCApv-carriers
We considered whether BRCA-deficient cases with shorter survival would have fewer mutation-associated neoantigens to drive anti-tumor responses, but there was no difference in neoantigen counts between the STS and LTS groups for both BRCA1 and BRCA2 (P = 0.51 and P = 0.39, respectively; Fig. 4c). Tumor samples from 143 HGSC gBRCApv-carriers were analyzed by multi-color immunofluorescence to determine the epithelial and stromal immune cell densities and their associations with survival groups (Extended Data Fig. 1). Aside from intraepithelial B cells and CD4 + T cells (OR = 1.0), all other immune cell subsets had a positive association with survival (OR < 1.0; Supplementary Table S20). Only intrastromal and intraepithelial CD8 + PD-1 + T cells were significantly more abundant in gBRCApv-carriers with LTS compared to those with STS (P = 0.043 and P = 0.029, respectively; Supplementary Table S20).
The mesenchymal features c-KIT and mast cells are associated with poor outcome in HGSC
Immune cell abundance was estimated in 154 HGSC tumor samples using CIBERSORTx^75^. Unsupervised clustering of the inferred immune cell densities identified six groups of patients (Fig. 5a, and Supplementary Table S21) associated with differential survival outcomes (P = 0.0053; Fig. 5b). The IMMB.1 (n = 30) and IMMB.6 (n = 25) clusters had exceptionally long survival (median OS 14.87 and 10.45 years, respectively; Supplementary Table S9). The group with the shortest survival (cluster IMMB.5, n = 24, median OS 2.03 years) was enriched with activated dendritic cells and resting mast cells, a feature associated with the C1.MES subtype (P = 0.0021; Fig. 5c). Multivariable Cox regression analysis showed that resting mast cells (HR: 1.26, 95% CI 1.06–1.5, P = 0.009) were the immune cell type most strongly associated with short survival (Extended Data Fig. 9a). BRCA1-deficient tumors in patients with STS had increased expression of the mast cell growth factor receptor c-KIT (CD117) compared to those with LTS (P = 0.003, Padj=0.101; Extended Data Fig. 9b). Patients with high c-KIT tumor expression had significantly shorter OS than those with low c-KIT tumor expression, regardless of BRCA and HRD status (HR: 1.71, 95% CI 1.16–2.53, P = 0.0071; Extended Data Fig. 9c). The C1.MES subtype showed higher expression of c-KIT, together with an upregulation of the epithelial mesenchymal transition (EMT) pathway, compared to the C2.IMM subtype (Padj<0.001) (Extended Data Fig. 9d,e).
DISCUSSION
Our study highlights the complexity of survival determinants in patients with HGSC, demonstrating that it is the intersection of multiple factors, including surgical residual disease, immune response, and somatic gene alterations, which may influence outcome rather than BRCA mutation status alone. This interplay was particularly apparent in the diminished adverse impact of surgical residual disease in gBRCApv-carriers compared to non-carriers. Previous reports have suggested that surgery in a BRCA-deficient setting may have a lesser impact on survival in both first-line and platinum-sensitive setting^33,47,76^, indicating that it may be particularly important to achieve complete resection of BRCA-proficient tumors. In addition, an exploratory analysis of the PAOLA-1/ENGOT-ov25 trial^77^ showed that patients with BRCA-proficient tumors classified as higher risk (FIGO stage III with primary cytoreductive surgery and residual disease, or NACT; FIGO stage IV) had notably worse PFS compared to lower-risk patients, while this difference was less pronounced in patients with BRCA-deficient tumors. These results emphasize the importance of primary cytoreductive surgery with complete resection for non-carriers, who may also benefit more from secondary cytoreductive surgery in contrast to gBRCApv-carriers^78^. Equally, it may be that the positive effect of optimal cytoreduction is not as apparent in BRCA carriers, due to the chemotherapy (platinum) sensitivity associated with BRCA-deficiency.
In the current study, the association between NACT and survival appeared to differ by gBRCApv status, with a potential attenuation of survival benefit among gBRCApv-carriers who received NACT. However, the subgroup analyses by gBRCApv status and treatment type were likely underpowered, limiting definitive conclusions regarding potential interactions. Given the rapid increase in the uptake of NACT in recent years^79^, it will be important to determine if patients with BRCA-deficient tumors may be negatively impacted by NACT^80^. The acquisition of BRCA reversion mutations is frequent^48–50^, and it is plausible that reversion events may be more common where chemotherapy commences with a large tumor volume from which resistant clones could emerge under selection^58^. This is especially important in the PARPi era, where the early development of platinum resistance could negatively impact on the potential benefit gained from PARPi treatment. While the impact of NACT on outcomes according to BRCA status is not yet known, it is becoming increasingly important to more rapidly determine the BRCA and broader HR status of a patient’s tumor at diagnosis to make the most informed decisions at primary treatment.
Our study highlights the spectrum of HRD scores seen in patients with BRCA-deficient tumors. While all but two exceeded a threshold (> 42) required for classification as HRD, the improved OS and PFS seen with a more stringent threshold (≥ 63) shows that HRD should not be considered a binary classification but rather appears to be a continuous variable. This finding is consistent with a previous analysis of 537 HGSC cases from The Cancer Genome Atlas which showed that patients with HRD scores ≥ 63 were associated with better survival outcomes, while those with intermediate (42–62) and low (≤ 42) HRD scores had overlapping survival curves^72^. It is important to mention that in our study, samples were collected over nearly 20 years, a timeframe that encompasses changes in treatment practices, making it challenging to determine how evolving therapies, particularly the introduction of PARPi, may have influenced outcomes. It is notable that the HRD score threshold of 42 was originally established to predict response to neoadjuvant platinum-containing chemotherapy in patients with breast cancer^81^, which tends to have less genomic scarring compared to ovarian cancer^27,72^. As HRD scores ≥ 63 strongly predicted better outcomes in BRCA-deficient HGSC, our findings support the prognostic value of HRD score thresholds. However, it is premature to conclude that a higher threshold should alter therapy selection. To establish this, a comprehensive analysis of maintenance PARPi trials, incorporating HRD scores, would be necessary to confirm their predictive role in guiding treatment decisions. Furthermore, it would be ideal to extend this investigation to include other relevant genomic alterations identified in trial samples to refine patient stratification further. This refinement would help identify patients for whom no maintenance therapy or additional targeted therapy may be more appropriate, while avoiding potentially ineffective treatments for those with lower HRD scores, thereby personalizing therapy to maximize efficacy and minimize unnecessary side effects.
Our analyses corroborated Labidi-Galy et al.’s findings that pathogenic variants in the RAD51-BD of BRCA2^44^ and the DBD of BRCA1^43^ are associated with improved outcomes in HGSC. By contrast, alterations outside BRCA1 exon 10, particularly in the BRCT and RING regions, are not associated with a significantly improved survival compared to non-carriers and in some cases may confer platinum and PARPi resistance^45^. While BRCA1 exon 10 mutations have been associated with improved outcomes in multiple studies, including ours, there is evidence that tumors may express the BRCA1-Δ11q splice isoform, which bypasses exon 10 mutations and results in a shorter but partially functional protein that is permissive of treatment resistance^43,46^. In a relatively small sample size for which we had RNA-seq data (n = 19 BRCA1 exon 10 mutated tumors), we found that patients with a pathogenic BRCA1 variant in exon 10 and high Δ11q expression had a shorter survival. We were unable to measure Δ11q expression during or following treatment. This is important because Δ11q expression may increase or fluctuate under the selective pressure of treatment, which would influence treatment response and survival outcomes.
CD8 + PD1 + T cells are associated with improved outcomes in ovarian cancer^82^, contributing to enhanced anti-tumor immunity. In our analysis, the presence of these cells in tumors were prognostic for survival in gBRCApv-carriers, although to a lesser extent. This suggests that while cytotoxic T-cell activity remains important in BRCA-deficient tumors, additional factors may influence survival. Given the established association between BRCA and HR status and increased TMB^22^, it is possible that immune exhaustion, suppressive signaling or tumor-intrinsic immune resistance pathways may counteract the expected immunogenicity. Intriguingly, BRCA1-deficient tumors with high HRD scores had evidence of enhanced immune-related gene transcription. In addition, while our study did not include cigarette smoking in the survival models, smoking has been identified as a potential factor influencing survival in gBRCApv-carriers^83^, which may also influence the immune response. Further research into markers of T-cell exhaustion and other immune regulators is needed to better understand the differential immune responses in these patients.
NF1 gene loss-of-function emerged as a good prognostic factor in BRCA2-deficient HGSC. Loss-of-function of NF1 is common in epithelial ovarian cancer with a prevalence of 12–31%^13,20,22,58,84,85^. NF1 inactivation by gene breakage or mutations may contribute to initial good prognosis but later chemoresistance in patients with HGSC and BRCA-deficiency^84^. This is consistent with recent findings that deleterious NF1 mutations are associated with improved PFS in ovarian cancer^20^ and low mRNA expression of NF1 predicts longer overall survival^22^. In contrast, PIK3CA amplification and high mRNA expression were associated with shorter survival in patients with BRCA2-deficient HGSC. As a major regulator of the phosphoinositide 3-kinase (PI3K) pathway, PIK3CA activation promotes cell proliferation and survival, especially in genomically unstable cancers^49,62^. Its amplification may enhance tolerance to genome doubling and contribute to the aggressive nature of BRCA2-deficient tumors. The contrasting survival outcomes between PIK3CA amplification and NF1 loss-of-function underscore the heterogeneity of HGSC tumors, highlighting the need for personalized therapeutic strategies, even within the BRCA2-deficient subgroup.
METHODS
Ethics statement
Written informed consent or an approved waiver of consent was obtained at each participating study site for patient recruitment and the use of samples and linked clinical information (Supplementary Table S22). Investigations were performed after approval by local human research ethics/institutional review board committees at each site. This study was conducted in accordance with the principles of Good Clinical Practice, the Declaration of Helsinki and local regulations.
Study population
This retrospective, multi-center study included patients diagnosed with HGSC between 2002 and 2019. The Australian Ovarian Cancer Study (AOCS) cohort (n = 1389) included all stages (FIGO I-IV), and the Multidisciplinary Ovarian Cancer Outcomes Group (MOCOG) cohort (n = 154) was restricted to advanced stage disease (FIGO III and IV; Table 1, Extended Data Fig. 1, and Supplementary Table S22). Patients were categorized based on OS into short (< 3 years) and long (≥ 3 years) OS groups (Supplementary Information). For multi-omics analysis, 154 patients had fresh-frozen tumor obtained during primary cytoreductive surgery and matched blood samples, or were previously analyzed^22,58^. Findings were validated in an independent HGSC cohort (n = 5875) from the Ovarian Tumor Tissue Analysis Consortium (OTTA) for which gBRCApv status was available.
Molecular data
Single-nucleotide polymorphism (SNP) arrays
Tumor and matched normal DNA was analyzed with the Infinium OmniExpress-24 BeadChip arrays as described previously^22^. The concordance of normal and tumor DNA was assessed using HYSYS^86^. Tumor DNA samples with estimated tumor cellularity > 40% (determined by qPure^87^ and ASCAT^88^) were considered appropriate for whole genome sequencing and methylation arrays.
Whole genome sequencing (WGS)
For WGS, libraries were generated from tumor and matched normal genomic DNA from peripheral blood mononuclear cells with a minimum base coverage of 60x and 30x, respectively. FASTQ files were assessed for sequencing quality using FASTQC (v0.11.8) and, for contaminants using FastQ Screen^89^ (v0.11.4). Adapters, N-content and low-quality bases were trimmed using fastq-mcf (v1.05). Sequenced data was mapped to the human genome reference GRCh37 b37 using the aligner BWA mem^90^ (v.0.7.17-r1188). Aligned BAM files per lane were then sorted, merged and duplicates marked using Picard Tools (v.2.17.3). Further processing of the aligned files included base recalibration using GATK BaseRecalibrator (v4.0.10.1). Coverage calculation was performed using GATK DepthOfCoverage (v3.8–1-0-gf15c1c3ef). GATK HaplotypeCaller (v.4.0.10.1) was used on germline BAMs to generate Genomic Variant Call Format (GVCF) files which were used as the Panel of Normals (PoN) in the Mutect2 somatic variant calling workflow. Tumor purity and ploidy were estimated using FACETS^91^.
RNA-sequencing (RNA-seq)
Extracted RNA from tumor tissue samples underwent RNA-seq, with initial quality control checks on raw FASTQ files performed using FastQC^89^ (v0.11.8). Adapter, poly (A) tails, N content and low quality base trimming was done using fastq-mcf (v1.05), and contamination was assessed using FastQ Screen^89^ (v(0.11.4). Reads were then mapped to the human reference GRCh37.92 using the STAR^92^ (v2.6.0b) two-pass method. The mapped reads were then sorted using Picard Tools (v2.17.3). Counts were generated using HTSeq^93^ (v0.10.0) on the GRCh37.92 Ensembl release gene annotation. Raw count data was then subsetted to protein coding genes and lowly expressed genes were removed using the following strategy. First, raw counts were converted to CPM (counts per million) and only protein coding genes with a CPM of greater than 0.5 in at least 10 samples were retained. The resulting raw count matrix was then normalized using the trimmed mean of M values (TMM) method using edgeR^94^ (v3.28.1). Batch effects were removed using limma’s^95^ (v3.48.2) removeBatchEffect function. Batch effect removal was done by applying batch correction on the library type (stranded/unstranded) while preserving the survival group (long/short).
Methylation arrays
The generation and processing of methylation array data was performed as previously described by Garsed et al.^22^. Briefly, initial quality control was performed by QuantiFluor (Promega). Subsequently, 500 ng tumor DNA was converted using the EZ DNA Methylation kit (Zymo Research) and analyzed using the Infinium MethylationEPIC BeadChip arrays. The R package minfi^96^ (v1.32.0) was then used for quality control assessment and processing of the methylation data as previously described^22^.
Immunofluorescence (IF) data
Tissue microarrays (TMAs) were constructed from formalin-fixed paraffin-embedded (FFPE) blocks of tumor tissue and stained by IF with two panels of antibodies against immune markers of interest. Panel 1 detected CD3, CD8, CD20, FOXP3 and CD79; panel 2 detected CD3, CD8, PD-1, PD-L1 and CD68. Both panels also detected pan-cytokeratin to identify tumor epithelium. Automated cell scoring, including separation of epithelial and stromal regions, was performed using QuPath (v0.2m2), with extensive manual training and validation. CD4 + T cells were defined as CD3 + CD8− cells, as previously^97^.
Immunohistochemistry (IHC):
Sections of 4 μm thickness were cut from previously constructed TMAs of FFPE tumor samples. Deparaffinized sections were stained with the C-terminal NF1 antibody (clone NFC, SIGMA #MABE1820; St. Louis, MO, USA) using our previously described protocol on a DAKO Omnis platform: 30 min of pre-treatment heat-induced antigen retrieval in Tris-EDTA buffer, pH = 9.0; primary antibody incubation for 1h at dilution 1/50, 10 min of a mouse linker, and 30 min for the peroxidase labelled Dako EnVision + polymer-based detection system (Dako protocol 1 h-10M-30, Agilent, Santa Clara, CA, USA)^85^. Samples were scored as follows: inactivated (loss of expression with retained internal control), normal retained expression, subclonal loss, uninterpretable (loss of tumor expression but no internal control present), and exclude (no tumor in core) (Supplementary Information).
mRNA expression data by NanoString
Tumor mRNA expression data for genes of interest (NF1, PIK3CA, c-KIT, and RB1) and transcriptional molecular subtypes in the OTTA cohort were determined using NanoString, as previously described^98,99^.
Measurements
Variant detection and annotation
Variant calling was performed for:
germline base substitution and INDEL variants by VarDictJava^100^ (v1.5.7 with –r = 2 –Q = 10 –f = 0.1).somatic base substitution and INDEL variants using four separate variant callers as follows: by Mutect2^101^ (v4.0.11.0 with defaults), VarDictJava^100^ (v1.5.7 with –r = 2 –Q = 10 –V = 0.05 –f = 0.01), Strelka2^102^ (v2.9.9 with defaults), and VarScan2^103^ (SAMtools^104^) v1.9 for mpileup and VarScan2 v2.4.3 with -min-coverage 7 -min-var-freq = 0.05 -min-freq-for-hom = 0.75 -p-value = 0.99 -somatic-p-value = 0.05 -strand-filter = 0). Variant calls were decomposed and normalized using vt^105^ GATKs ReadBackPhasing tool (v3.8–1-0-gf15c1c3ef with -phaseQualityThresh = 10 – enableMergePhasedSegregatingPolymorphismsToMNP -min_base_quality_score = 10 -min_mapping_quality_score = 10 -maxGenomicDistanceForMNP = 2) was applied on the passing variants per tool to combine contiguous SNVs to MNVs (multi-nucleotide variants). GATK’s CombineVariants (v3.8–1-0-gf15c1c3ef with -genotypeMergeOptions UNIQUIFY -priority Strelka2, Mutect2, VarScan2, VarDictJava) was used to merge the variant calls from all four callers into a consensus variant call set. The resulting variant call format (VCF) file was once again decomposed and normalized using vt. Forward and reverse strand counts for the reference and alternate alleles were calculated using bam-readcount (v0.8.0). Finally, all variants were annotated for Duke and DAC blacklisted regions. Any variants that were passed in at least two callers, had at least one variant read in each strand, and were not in the database of FrequentLy mutAted GeneS (FLAGS)^106^ or the Duke and DAC blacklist regions were deemed high-confidence.structural variants (SV) using four separate callers Manta^107^ + BreakPointInspector (v1.5.0), GRIDSS^108^ (v2.0.1), Smoove (v0.2.2) and SvABA^109^ (v134). The SV calls were split into germline and somatic VCFs per caller. The findBreakpointsOverlaps method of the R library StructuralVariantAnnotation (v1.3.1) with a value of 10 for the ‘maxgap’ parameter was used to intersect common breakpoints between the callers. SVs were annotated to constituent types (duplication, deletion, inversion or translocation) using a simple annotation script provided by the GRIDSS tool. High-confidence SVs were categorized as those called by two or more callers. 4. copy number variations (CNV) detection by FACETS^91^ and cnv_facets (v0.13.0) as described previously^22^. The detected variants were filtered for variants with a high probability of pathogenicity as described in detail before^22^.
Mutation burden and downsampling
We downsampled the higher coverage tumor BAM files using Picard DownsampleSam (v2.17.3) to achieve balanced median coverage sequencing batches, to compare mutation burden across samples with inconsistent coverage^22^. The median coverage of the International Cancer Genome Consortium (ICGC) tumors was 52.15x, the MOCOG tumors was 77.81x and the short survival BRCA dataset tumors was 64.98x. So, to get the same median coverage across the three batches we downsampled the MOCOG and short survival BRCA dataset tumors to the ICGC median by specifying downsampling fractions of 0.67 and 0.8 respectively. See Supplementary Table S19 for details on the tumor sample coverage before and after downsampling and the number of SNVs, MNVs, indels and SVs called after downsampling.
Neoantigen prediction
Neoantigen prediction was performed as previously reported by Garsed et al.^22^. Briefly, HLA-VBSeq^110^ (v11_22_2018) was used to generate HLA types which were then used to identify and construct neoantigen using pVACtools^111^ pVACseq (v1.3.5).
Homologous recombination deficiency (HRD)
HRD status was determined using 1) scarHRD^112^, which uses loss of heterozygosity (LOH), telomeric allelic imbalance (TAI), and large scale state transition (LST) in tumor genomes to generate a HRD sum score, and 2) CHORD (Classifier of Homologous Recombination Deficiency)^60^, which uses specific base substitution, indel and structural rearrangement signatures detected in tumor genomes to generate BRCA1-type and BRCA2-type HRD scores.
RNA-seq data analysis
Raw count data was subsetted to protein coding genes and lowly expressed genes were removed using the following strategy. First, raw counts were converted to CPM (counts per million) and only protein coding genes with a CPM of greater than 0.5 in at least 10 samples were retained. The resulting raw count matrix was then normalized using the trimmed mean of M values (TMM) method using edgeR^94^ (v3.28.1). Batch effects were removed using limma’s^95^ (v3.48.2) removeBatchEffect function. Batch effect removal was done by applying batch correction on the library type (stranded/unstranded) while preserving the survival group (long-term/short-term).
RNA differential expression and pathway analysis by grouping
Groupings
For differential expression and pathway analysis, various groupings were used alone or in combination, namely 1) BRCA-deficiency status, 2) HRD groups, survival groups, and 3) molecular subtypes (Supplementary Information).
Differential expression analysis
To identify differentially expressed protein-coding genes between the comparison groups of interest, DESeq2 (v1.26.0)^113^ was applied. Raw counts were filtered to remove low expressed genes prior to analysis and batch effects were accounted for in the model^22^.
Gene Set Enrichment Analysis (GSEA)
FGSEA v1.15.1 was used to calculate gene set enrichment across the comparison groups. P-values obtained from DESeq2 were transformed to signed P-values and then sorted and fed into FGSEA to generate enrichment scores and FDR-adjusted P-values across the Hallmark gene sets in the MSigDB database49 (v7.4) via its function fgseaMultilevel (minSize = 15, maxSize = 500, gseaParam = 0, eps = 0)^22^.
CIBERSORTx
CIBERSORTx analysis was performed as previously described^22^. Briefly, CIBERSORTx^75^ with the LM22 matrix was used on RNA-seq data for immune cell deconvolution. Immune clusters were then generated with k-means clustering of the generated absolute cell abundances using ConsensusClusterPlus^114^ (Supplementary Information).
Immunofluorescence
Data were categorized based on epithelial content, measured directly by pan-cytokeratin positivity and cell morphology (assessed by automated image analysis). Epithelium-negative, cellular (i.e., non-necrotic) tumor regions were defined as stroma. Immunomarker density (D; cells/mm^2^) for a given marker was calculated separately for epithelial and stromal compartments. For cases with multiple cores, the epithelial area was taken as the sum of all their individual TMA epithelial areas and similarly for the stromal area. We categorized marker D values into quartiles (separately for epithelial and stromal markers) to provide categorical comparisons for ease of interpretation of the odds ratios (ORs). Conditional logistic regression models were fitted for the long survival group vs short survival group. Logistic regression analyses were performed with the quartile values (scored as 1, 2, 3, 4). Immune clusters were then generated by k-means clustering of the immune cell type densities using ConsensusClusterPlus^114^.
Statistical analyses
Continuous variables were compared between groups using the Kruskal-Wallis test and the difference between proportions of categorical data were assessed using the Chi-squared or Fisher’s exact test. Correlations between continuous variables were assessed using Spearman correlation. Benjamini-Hochberg adjusted P-values are reported as Padj to account for multiple testing. Median PFS and OS were estimated using the Kaplan-Meier method and survival distribution were compared using the log-rank (Mantel-Cox) test.
For the AOCS cohort, univariable and multivariable survival analyses were performed using Accelerated Failure Time (AFT) models^54^ with a log-logistic distribution to evaluate associations between clinical and molecular variables and time-to-event outcomes. Results were reported as Time Ratios (TR) with 95% confidence intervals (CI), where a TR > 1 indicates longer time to progression or death, and a TR < 1 indicates shorter survival. Wald tests were used to compute P-values for individual covariates and interaction terms. Age at diagnosis was modelled using restricted cubic splines with three knots to allow for potential non-linear effects. Model assumptions were assessed using quantile-quantile plots of deviance residuals and Cox-Snell residuals to evaluate overall model fit. The Akaike Information Criterion (AIC) was used to compare alternative parametric distributions and confirm the suitability of the log-logistic model^115^.
For survival analyses of the OTTA cohort, Cox proportional hazards models were applied. Left truncation was used to account for delayed study enrolment at some sites, and follow-up time was right-censored at 10 years from diagnosis to minimize the influence of non-ovarian cancer-related deaths. P-values from Cox models correspond to Wald and log-rank tests. The proportional hazards assumption was assessed using the Grambsch-Therneau test based on scaled Schoenfeld residuals and further evaluated through graphical inspection of Schoenfeld residual plots^115,116^.
All statistical tests were two sided and considered significant when P < 0.05 or Padj <0.1. All analyses were performed using the statistical software R version 4.1.3^117^.
Supplementary Material
Supplementary Files
This is a list of supplementary files associated with this preprint. Click to download.
The reference list from the paper itself. Each links out to its DOI / PubMed record.
- 1Hollis R. L. Molecular characteristics and clinical behaviour of epithelial ovarian cancers. Cancer Lett 555, 216057 (2023). 10.1016/j.canlet.2023.21605736627048 · doi ↗ · pubmed ↗
- 2Ahmed A. A. Driver mutations in TP 53 are ubiquitous in high grade serous carcinoma of the ovary. J Pathol 221, 49–56 (2010). 10.1002/path.269620229506 PMC 3262968 · doi ↗ · pubmed ↗
- 3Kobel M. p 53 and ovarian carcinoma survival: an Ovarian Tumor Tissue Analysis consortium study. J Pathol Clin Res 9, 208–222 (2023). 10.1002/cjp 2.31136948887 PMC 10073933 · doi ↗ · pubmed ↗
- 4Kobel M. Ovarian carcinoma subtypes are different diseases: implications for biomarker studies. P Lo S Med 5, e 232 (2008). 10.1371/journal.pmed.005023219053170 PMC 2592352 · doi ↗ · pubmed ↗
- 5Dareng E. O. Polygenic risk modeling for prediction of epithelial ovarian cancer risk. Eur J Hum Genet 30, 349–362 (2022). 10.1038/s 41431-021-00987-735027648 PMC 8904525 · doi ↗ · pubmed ↗
- 6Barnes D. R. Large-scale genome-wide association study of 398,238 women unveils seven novel loci associated with high-grade serous epithelial ovarian cancer risk. med Rxiv (2024). 10.1101/2024.02.29.24303243 · doi ↗
- 7Winham S. J. Investigation of Exomic Variants Associated with Overall Survival in Ovarian Cancer. Cancer Epidemiol Biomarkers Prev 25, 446–454 (2016). 10.1158/1055-9965.EPI-15-024026747452 PMC 4779669 · doi ↗ · pubmed ↗
- 8Permuth J. B. Exome genotyping arrays to identify rare and low frequency variants associated with epithelial ovarian cancer risk. Hum Mol Genet 25, 3600–3612 (2016). 10.1093/hmg/ddw 19627378695 PMC 5179948 · doi ↗ · pubmed ↗