Potential pharmacological quality control markers in the traditional Japanese medicine Hangeshashinto: identifying anti-inflammatory ingredients through a cell-based bioassay and multicomponent analysis
Ryota Imai, Yuta Muraki, Akinori Nishi, Katsuya Ohbuchi

TL;DR
This study identifies eight potential quality control markers in the traditional Japanese medicine Hangeshashinto that may help improve its anti-inflammatory effects.
Contribution
The study introduces an integrated method combining cell-based bioassays and multicomponent analysis to identify pharmacological quality markers in a traditional medicine.
Findings
101 HST samples consistently inhibited IL-1β–induced PGE2 production in human oral keratinocytes.
Eight ingredients showed strong correlations with anti-inflammatory activity and exhibited PGE2-inhibitory potential.
The identified components may serve as novel quality control markers for HST.
Abstract
The traditional Japanese medicine Hangeshashinto (HST) is a multicompound drug used for stomatitis. The identification of HST’s active ingredients is essential for understanding its mechanism of action and establishing pharmacological quality control markers, but remains unclear due to its multicomponent drug. To systematically explore anti-inflammatory ingredients in HST using a combined approach involving a cell-based bioassay and multicomponent analysis, and to identify potential quality marker compounds. A cell-based bioassay modeling stomatitis was established using human oral keratinocytes (HOK), with interleukin (IL)-1β–induced prostaglandin E2 (PGE2) as an inflammatory indicator. The PGE2 inhibitory effects of quality-controlled 101 HST manufacturing lots were compared. Multicomponent analysis was performed on the 101 HST samples, correlating the intensity of 121 component…
Genes, proteins, chemicals, diseases, species, mutations and cell lines named across the full text — each resolved to its canonical identifier and authoritative record.
Click any figure to enlarge with its caption.
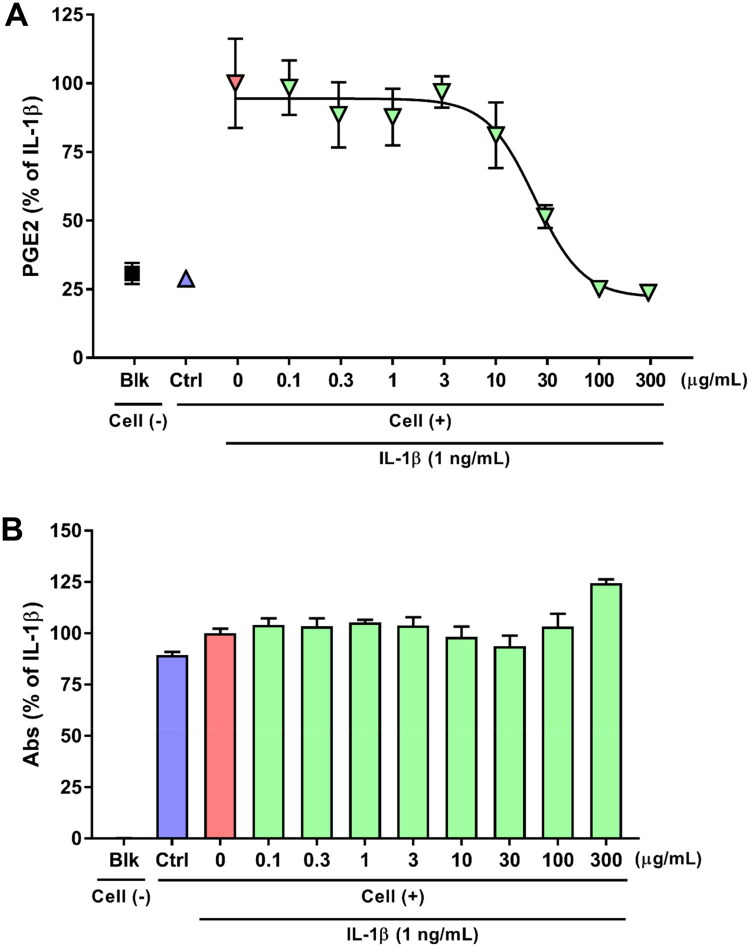 Figure 1
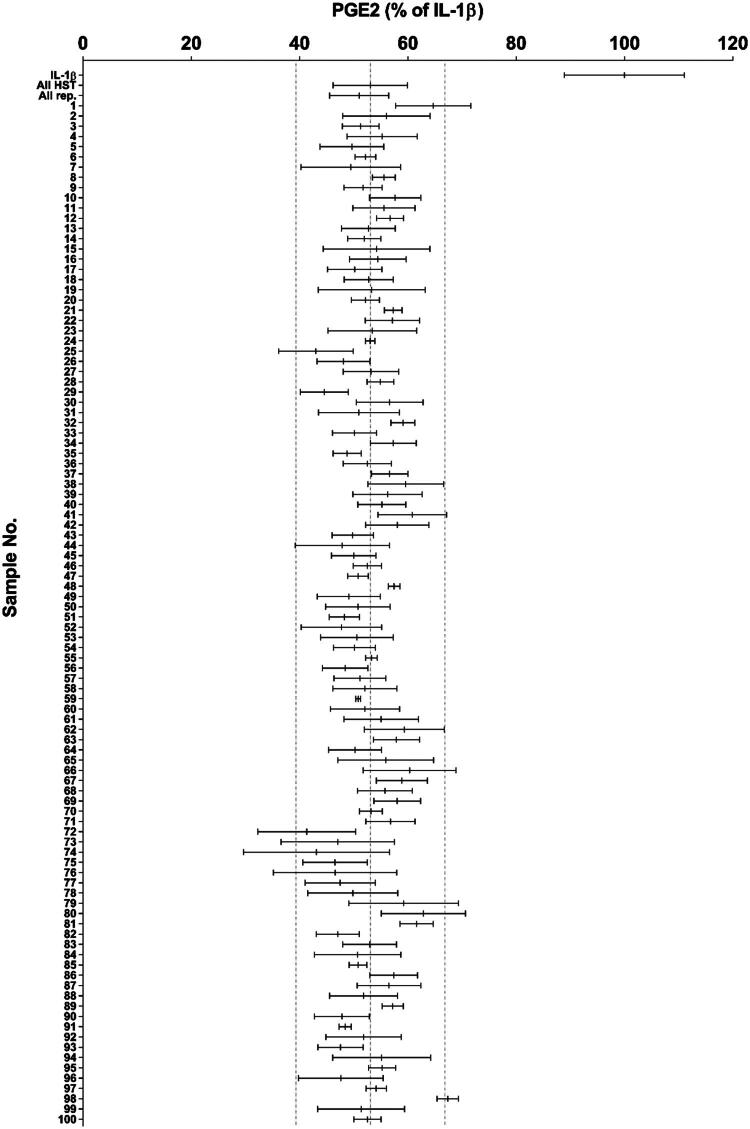 Figure 2
| Sample No. | PGE2 (%) | SD |
|---|---|---|
| IL-1β | 100.00 | 11.08 |
| All HST | 53.08 | 4.63 |
| All rep. | 51.01 | 5.46 |
| 1 | 64.69 | 6.96 |
| 2 | 56.03 | 8.07 |
| 3 | 51.29 | 3.37 |
| 4 | 55.25 | 6.48 |
| 5 | 49.67 | 5.87 |
| 6 | 52.15 | 1.91 |
| 7 | 49.48 | 9.21 |
| 8 | 55.59 | 2.11 |
| 9 | 51.73 | 3.49 |
| 10 | 57.67 | 4.73 |
| 11 | 55.59 | 5.73 |
| 12 | 56.72 | 2.48 |
| 13 | 52.71 | 4.97 |
| 14 | 51.96 | 3.05 |
| 15 | 54.23 | 9.84 |
| 16 | 54.45 | 5.23 |
| 17 | 50.19 | 5.01 |
| 18 | 52.78 | 4.54 |
| 19 | 53.34 | 9.86 |
| 20 | 52.16 | 2.58 |
| 21 | 57.29 | 1.64 |
| 22 | 57.14 | 5.00 |
| 23 | 53.46 | 8.20 |
| 24 | 53.05 | 0.89 |
| 25 | 43.02 | 6.89 |
| 26 | 48.12 | 4.89 |
| 27 | 53.18 | 5.14 |
| 28 | 54.92 | 2.46 |
| 29 | 44.58 | 4.42 |
| 30 | 56.64 | 6.17 |
| 31 | 50.98 | 7.49 |
| 32 | 59.10 | 2.21 |
| 33 | 50.15 | 4.06 |
| 34 | 57.32 | 4.24 |
| 35 | 48.79 | 2.59 |
| 36 | 52.52 | 4.47 |
| 37 | 56.64 | 3.38 |
| 38 | 59.60 | 7.00 |
| 39 | 56.25 | 6.39 |
| 40 | 55.20 | 4.42 |
| 41 | 60.82 | 6.33 |
| 42 | 58.06 | 5.84 |
| 43 | 49.81 | 3.82 |
| 44 | 47.89 | 8.71 |
| 45 | 50.01 | 4.13 |
| 46 | 52.53 | 2.62 |
| 47 | 50.82 | 1.89 |
| 48 | 57.47 | 1.06 |
| 49 | 49.10 | 5.84 |
| 50 | 50.80 | 5.95 |
| 51 | 48.28 | 2.80 |
| 52 | 47.74 | 7.44 |
| 53 | 50.61 | 6.70 |
| 54 | 50.15 | 3.87 |
| 55 | 53.30 | 1.07 |
| 56 | 48.43 | 4.19 |
| 57 | 51.15 | 4.81 |
| 58 | 52.06 | 5.90 |
| 59 | 50.84 | 0.45 |
| 60 | 52.09 | 6.39 |
| 61 | 55.06 | 6.88 |
| 62 | 59.37 | 7.39 |
| 63 | 57.90 | 4.26 |
| 64 | 50.23 | 4.90 |
| 65 | 55.90 | 8.85 |
| 66 | 60.32 | 8.55 |
| 67 | 58.90 | 4.72 |
| 68 | 55.77 | 5.04 |
| 69 | 58.03 | 4.32 |
| 70 | 53.18 | 2.10 |
| 71 | 56.79 | 4.55 |
| 72 | 41.33 | 9.02 |
| 73 | 47.04 | 10.46 |
| 74 | 43.14 | 13.50 |
| 75 | 46.56 | 5.93 |
| 76 | 46.57 | 11.38 |
| 77 | 47.49 | 6.48 |
| 78 | 49.85 | 8.30 |
| 79 | 59.23 | 10.10 |
| 80 | 62.87 | 7.79 |
| 81 | 61.61 | 3.07 |
| 82 | 47.06 | 3.95 |
| 83 | 52.95 | 4.96 |
| 84 | 50.72 | 7.99 |
| 85 | 50.82 | 1.64 |
| 86 | 57.40 | 4.40 |
| 87 | 56.52 | 5.88 |
| 88 | 51.81 | 6.26 |
| 89 | 57.20 | 1.97 |
| 90 | 47.83 | 5.07 |
| 91 | 48.42 | 1.13 |
| 92 | 51.84 | 6.97 |
| 93 | 47.57 | 4.19 |
| 94 | 55.17 | 9.04 |
| 95 | 55.27 | 2.51 |
| 96 | 47.64 | 7.81 |
| 97 | 54.17 | 1.91 |
| 98 | 67.38 | 1.97 |
| 99 | 51.39 | 8.02 |
| 100 | 52.56 | 2.50 |
| Peak No. | tR (min) | Polarity | | Fragmentor | Identification | CAS No. |
|---|---|---|---|---|---|---|
| 1 | 1.27 | Negative | 719.2 | 150V | ||
| 2 | 2.82 | Positive | 107.1 | 150V | ||
| 3 | 3.95 | Negative | 367.1 | 150V | ||
| 4 | 4.61 | Positive | 257.1 | 150V | Glucoliquiritin | 93446-18-5 |
| 5 | 4.71 | Negative | 303.2 | 150V | 2,3,5,6,7-pentahydroxyflavanone | 80366-15-0 |
| 6 | 4.94 | Negative | 549.4 | 150V | ||
| 7 | 5.12 | Positive | 342.3 | 150V | Magnoflorine | 2141-09-5 |
| 8 | 5.14 | Positive | 219.2 | 150V | ||
| 9 | 5.31 | Positive | 595.4 | 150V | Vicenin II | 23666-13-9 |
| 10 | 5.41 | Positive | 369.2 | 150V | 3-O-Feruloylquinic acid | 62929-69-5 |
| 11 | 6.08 | Positive | 565.4 | 150V | Schaftoside | 51938-32-0 |
| 12 | 6.1 | Positive | 303.1 | 150V | ||
| 13 | 6.68 | Negative | 417.1 | 150V | Liquiritin | 551-15-5 |
| 14 | 6.8 | Negative | 549.4 | 150V | Liquiritin apioside | 74639-14-8 |
| 15 | 6.84 | Positive | 549.3 | 150V | ||
| 16 | 7.05 | Positive | 549.3 | 150V | ||
| 17 | 7.38 | Positive | 322.3 | 150V | Groenlandicine | 38691-95-1 |
| 18 | 7.33 | Positive | 549.3 | 150V | ||
| 19 | 7.45 | Positive | 324.3 | 150V | ||
| 20 | 7.53 | Positive | 549.3 | 150V | ||
| 21 | 7.64 | Positive | 352.3 | 150V | ||
| 22 | 7.67 | Negative | 581.5 | 150V | ||
| 23 | 7.76 | Positive | 549.3 | 150V | Chrysin 6-C-glucoside 8-C-arabinoside | 185145-34-0 |
| 24 | 7.83 | Positive | 549.3 | 150V | ||
| 25 | 8.04 | Negative | 433.3 | 150V | Choerospondin | 81202-36-0 |
| 26 | 8.14 | Negative | 415.3 | 150V | ||
| 27 | 8.2 | Negative | 459.4 | 150V | ||
| 28 | 8.49 | Positive | 320.3 | 150V | Coptisine | 3486-66-6 |
| 29 | 8.62 | Positive | 336.3 | 150V | Epiberberine | 6873-09-2 |
| 30 | 8.78 | Positive | 338.3 | 150V | ||
| 31 | 8.78 | Positive | 477.2 | 150V | ||
| 32 | 9.04 | Negative | 549.4 | 150V | Isoliquiritin apioside | 120926-46-7 |
| 33 | 8.95 | Positive | 289.1 | 150V | ||
| 34 | 9.03 | Positive | 347.4 | 150V | ||
| 35 | 9.24 | Negative | 417.1 | 150V | Isoliquiritin | 5041-81-6 |
| 36 | 9.36 | Positive | 447.0 | 150V | Baicalin | 21967-41-9 |
| 37 | 9.41 | Negative | 962.1 | 150V | 20-O-Glucoginsenoside Rf | 68406-27-9 |
| 38 | 9.55 | Negative | 255.1 | 150V | Liquiritigenin | 578-86-9 |
| 39 | 9.7 | Negative | 932.0 | 150V | Notoginsenoside R1 | 80418-24-2 |
| 40 | 9.79 | Positive | 507.2 | 150V | ||
| 41 | 9.89 | Positive | 336.3 | 150V | Berberine | 2086-83-1 |
| 42 | 9.97 | Positive | 352.3 | 150V | ||
| 43 | 10.02 | Negative | 695.6 | 150V | ||
| 44 | 10.12 | Negative | 891.7 | 150V | ||
| 45 | 10.23 | Negative | 946.1 | 150V | Ginsenoside Re | 52286-59-6 |
| 46 | 10.23 | Negative | 845.3 | 150V | Ginsenoside Rg1 | 22427-39-0 |
| 47 | 10.42 | Negative | 299.1 | 150V | ||
| 48 | 10.52 | Negative | 269.1 | 150V | ||
| 49 | 10.62 | Negative | 859.7 | 150V | Chrysin-7-O-Glucuronide | 35775-49-6 |
| 50 | 10.74 | Positive | 461.2 | 150V | Oroxyloside | 36948-76-2 |
| 51 | 10.77 | Negative | 842.0 | 150V | ||
| 52 | 10.87 | Positive | 517.3 | 150V | ||
| 53 | 10.96 | Negative | 445.3 | 150V | ||
| 54 | 11.17 | Positive | 461.2 | 150V | Wogonoside | 51059-44-0 |
| 55 | 11.39 | Negative | 823.9 | 150V | ||
| 56 | 11.47 | Positive | 491.2 | 150V | ||
| 57 | 11.66 | Negative | 1000.0 | 150V | ||
| 58 | 11.81 | Negative | 895.9 | 150V | ||
| 59 | 11.85 | Negative | 821.8 | 150V | ||
| 60 | 11.97 | Positive | 271.0 | 150V | ||
| 61 | 12.06 | Negative | 984.0 | 150V | Licoricesaponin A3 | 118325-22-7 |
| 62 | 12.15 | Negative | 799.9 | 150V | Ginsenoside A1 | 69884-00-0 |
| 63 | 12.24 | Negative | 879.9 | 150V | ||
| 64 | 12.25 | Positive | 271.0 | 150V | Baicalein | 491-67-8 |
| 65 | 12.33 | Negative | 837.8 | 150V | ||
| 66 | 12.38 | Negative | 1028.1 | 150V | ||
| 67 | 12.43 | Negative | 1107.4 | 150V | Ginsenoside Rb1 | 41753-43-9 |
| 68 | 12.43 | Negative | 576.8 | 150V | ||
| 69 | 12.49 | Negative | 1150.2 | 150V | ||
| 70 | 12.47 | Negative | 431.4 | 150V | ||
| 71 | 12.49 | Positive | 257.1 | 150V | Isoliquiritigenin | 961-29-5 |
| 72 | 12.56 | Negative | 1078.2 | 150V | Ginsenoside Rc | 11021-14-0 |
| 73 | 12.54 | Positive | 369.2 | 150V | ||
| 74 | 12.61 | Negative | 956.1 | 150V | Ginsenoside Ro | 34367-04-9 |
| 75 | 12.68 | Negative | 1078.2 | 150V | Ginsenoside Rb2 | 11021-13-9 |
| 76 | 12.68 | Negative | 819.2 | 150V | ||
| 77 | 12.69 | Negative | 837.8 | 150V | Licoricesaponin G2 | 118441-84-2 |
| 78 | 12.73 | Negative | 1120.2 | 150V | ||
| 79 | 12.81 | Negative | 864.0 | 150V | ||
| 80 | 12.99 | Negative | 821.2 | 150V | Glycyrrhizic acid | 1405-86-3 |
| 81 | 12.96 | Negative | 946.1 | 150V | Ginsenoside Rd | 52705-93-8 |
| 82 | 13.03 | Negative | 988.1 | 150V | ||
| 83 | 13.24 | Negative | 807.9 | 150V | ||
| 84 | 13.34 | Positive | 261.3 | 150V | ||
| 85 | 13.39 | Negative | 821.8 | 150V | ||
| 86 | 13.38 | Positive | 285.0 | 150V | Wogonin | 632-85-9 |
| 87 | 13.48 | Negative | 823.9 | 150V | ||
| 88 | 13.52 | Positive | 315.1 | 150V | ||
| 89 | 13.57 | Positive | 277.1 | 150V | [6]-Gingerol | 23513-14-6 |
| 90 | 13.58 | Negative | 373.2 | 150V | Skullcapflavone II | 55084-08-7 |
| 91 | 13.64 | Negative | 805.9 | 150V | ||
| 92 | 13.8 | Positive | 369.2 | 150V | Glycycoumarin | 94805-82-0 |
| 93 | 13.91 | Positive | 353.2 | 150V | ||
| 94 | 14.03 | Negative | 353.3 | 150V | ||
| 95 | 14.14 | Positive | 341.3 | 150V | ||
| 96 | 14.3 | Positive | 367.3 | 150V | Neoglycyrol | 23013-84-5 |
| 97 | 14.45 | Positive | 385.2 | 150V | ||
| 98 | 14.57 | Negative | 371.3 | 150V | ||
| 99 | 14.77 | Positive | 425.4 | 150V | ||
| 100 | 14.8 | Positive | 305.4 | 150V | [8]-Gingerol | 23513-08-8 |
| 101 | 14.87 | Positive | 383.3 | 150V | ||
| 102 | 14.96 | Negative | 485.6 | 150V | Ceanothic acid | 21302-79-4 |
| 103 | 15.28 | Positive | 277.1 | 150V | [6]-Shogaol | 555-66-8 |
| 104 | 15.1 | Negative | 369.3 | 150V | Glyasperin D | 142561-10-2 |
| 105 | 15.28 | Positive | 425.4 | 150V | ||
| 106 | 15.46 | Positive | 398.5 | 150V | Diacetoxy-6-gingerdiol | 143615-75-2 |
| 107 | 15.59 | Negative | 353.3 | 150V | ||
| 108 | 15.64 | Negative | 421.4 | 150V | Isoangustone A | 129280-34-8 |
| 109 | 15.77 | Positive | 421.3 | 150V | ||
| 110 | 15.81 | Positive | 423.3 | 150V | ||
| 111 | 15.93 | Positive | 333.5 | 150V | [10]-Gingerol | 23513-15-7 |
| 112 | 15.99 | Positive | 471.5 | 150V | 18b-Glycyrrhetinic acid | 471-53-4 |
| 113 | 16.19 | Positive | 305.4 | 150V | [8]-Shogaol | 36700-45-5 |
| 114 | 16.25 | Positive | 439.5 | 150V | ||
| 115 | 17.53 | Positive | 331.4 | 150V | ||
| 116 | 17.25 | Positive | 333.5 | 150V | [10]-Shogaol | 36752-54-2 |
| 117 | 17.25 | Positive | 439.5 | 150V | Betulinic acid | 472-15-1 |
| 118 | 17.47 | Negative | 253.2 | 150V | Palmitoleic acid | 373-49-9 |
| 119 | 17.61 | Positive | 347.4 | 150V | ||
| 120 | 17.68 | Negative | 279.3 | 150V | Linoleic acid | 60-33-3 |
| 121 | 17.87 | Negative | 453.5 | 150V | Oleanonic acid | 17990-42-0 |
| Peak no. | Identification | Compound name | Correlation coefficient | |
|---|---|---|---|---|
| 11 | IC | Schaftoside | −0.45 | 2.63 × 10⁻⁶ |
| 23 | IC | Chrysin 6-C-glucoside 8-C-arabinoside | −0.43 | 9.22 × 10⁻⁶ |
| 15 | EC | Chrysin 6-C-glucoside 8-C-arabinoside (isomer1) | −0.39 | 4.41 × 10⁻⁵ |
| 2 | EC | 2-acetoxy-3-methoxybenzoic acid | −0.35 | 3.68 × 10⁻⁴ |
| 7 | IC | Magnoflorine | −0.35 | 3.72 × 10⁻⁴ |
| 113 | IC | [8]-Shogaol | −0.35 | 3.73 × 10⁻⁴ |
| 18 | EC | Chrysin 6-C-glucoside 8-C-arabinoside (isomer3) | −0.34 | 4.20 × 10⁻⁴ |
| 16 | EC | Chrysin 6-C-glucoside 8-C-arabinoside (isomer2) | −0.34 | 4.27 × 10⁻⁴ |
| 103 | IC | [6]-Shogaol | −0.34 | 5.20 × 10⁻⁴ |
| 66 | EC | Hydroxy-licoricesaponin D3 | −0.33 | 7.22 × 10⁻⁴ |
| 92 | IC | Glycycoumarin | −0.33 | 8.68 × 10⁻⁴ |
| 111 | IC | [10]-Gingerol | −0.33 | 9.07 × 10⁻⁴ |
| 96 | IC | Neoglycyrol | −0.32 | 9.28 × 10⁻⁴ |
| 3 | EC | 1-O-Feruloylquinic acid | −0.32 | 1.04 × 10⁻³ |
| 116 | IC | [10]-Shogaol | −0.31 | 1.37 × 10⁻³ |
| 100 | IC | [8]-Gingerol | −0.31 | 1.42 × 10⁻³ |
| 94 | EC | Gancaonin C | −0.31 | 1.64 × 10⁻³ |
| 20 | EC | Chrysin 6-C-glucoside 8-C-arabinoside (isomer4) | −0.31 | 1.84 × 10⁻³ |
| 93 | EC | Gancaonin A | −0.30 | 2.15 × 10⁻³ |
| 98 | EC | Licoriphenone | −0.30 | 2.72 × 10⁻³ |
- —TSUMURA & CO. supported the study through a research fund.
Peer Reviews
No public reviews on file for this paper yet. If you reviewed it on a platform where reviews are public (OpenReview, ICLR, NeurIPS, ICML), you can paste yours below so the community can read it here.
Videos
No videos yet. Explain this paper in a talk, walkthrough, or lecture? Add one.
Taxonomy
TopicsTraditional Chinese Medicine Analysis · Pharmacological Effects of Natural Compounds · Ginseng Biological Effects and Applications
Introduction
Traditional Japanese Kampo medicine, comprising multiple herbal formulations, is approved by the Ministry of Health, Labor, and Welfare, covered by national health insurance programs in Japan, and widely prescribed as a major therapeutic modality in modern clinical practice (Motoo et al. 2011; Kono et al. 2015; Arai and Kawahara 2019). In recent years, the various pharmacological effects of multicomponent Kampo medicines have been elucidated, and identification of the primary active ingredients responsible for their therapeutic effects has been progressing. For example, regarding Kampo medicines such as Daikenchuto, Rikkunshito, and Yokukansan, their primary active ingredients and targets have been identified, and their multi-effect mechanisms are becoming increasingly explainable from a pharmacological perspective (Ikarashi and Mizoguchi 2016; Mizoguchi and Ikarashi 2017a, 2017b; Inokuchi et al. 2021; Yamada et al. 2021; Namiki et al. 2022; Yamaguchi et al. 2023; Kainuma et al. 2024). Furthermore, beyond the mere identification of active ingredients, research on the characteristics of the multicomponent pharmaceuticals—such as studies employing multicomponent analysis and omics technologies—has advanced significantly (Nishi et al. 2017; Yamamoto 2022). In any case, challenges remain in scientifically explaining and verifying the effects of multi-component drugs, and it is essential to elucidate how the active ingredients exert their pharmacological effects within the body.
Kampo medicines, which play an essential role in healthcare, must be provided as high-quality pharmaceuticals. Their quality is tightly regulated, and the medicine is produced in accordance with Japanese good manufacturing practice. The quality of constituent herbs is influenced by environmental factors, including climate, temperature, and soil conditions. Strict control of the many ingredients in crude drug material is recognized as challenging (Yamamoto 2022). To address this, the Japanese Pharmacopeia specifies quality marker ingredients detectable through physicochemical tests to standardize each Kampo medicine (Ministry of Health, Labour and Welfare 2021). These quality markers are typically selected for being characteristic, abundant, stable, and easy to quantify in crude drugs (Arai and Kawahara 2019), and their relationship to pharmacological action remains unclear in many cases. Identifying the primary active ingredients involved in specific pharmacological activities is crucial not only for discovering new mechanisms of action in multicomponent Kampo medicines but also for utilizing the identified active ingredients as candidate quality markers to enable future pharmacologically evidence-based quality design of Kampo medicines. Kampo medicines are expected to act via multiple targets owing to their complex composition. Thus, phenotypic assays that assess cellular responses are considered more suitable than single-target assays for evaluating pharmacological effects.
The traditional Japanese medicine Hangeshashinto (HST), composed of seven crude drugs (Pinellia tuber, Scutellaria root, processed ginger, Glycyrrhiza, jujube, ginseng, and Coptis rhizome), is prescribed for acute and chronic gastroenteritis, diarrhea or soft stools, dyspepsia, gastroptosis, neurological gastritis, stomach weakness, hangover, belching, heartburn, stomatitis, and neurosis. Clinical studies have shown that HST improves stomatitis caused by anticancer drugs (Matsuda et al. 2015). A foundational study reported that HST suppresses interleukin (IL)-1β–induced prostaglandin E2 (PGE2) production in human oral keratinocytes (HOKs) (Kono et al. 2014). Regarding its mechanism, its ingredients baicalin and berberine inhibit cyclooxygenase (COX)-2 gene expression while wogonin inhibits both COX-2 expression and p38/JNK phosphorylation, whereas [6]-gingerol and [6]-gingerol inhibit enzymes involved in PGE2 production (Kono et al. 2014). Among these, baicalin and berberine are defined as quality control markers for HST in the Japanese Pharmacopeia (Ministry of Health, Labour and Welfare 2021). However, other anti-inflammatory ingredients have also been reported. Standardizing not only baicalin and berberine but also additional active ingredients is important for ensuring HST’s anti-inflammatory efficacy against stomatitis. Comprehensive evaluation of these ingredients requires establishing a phenotype-focused cell-based assay that can aggregate the responses of multiple compounds, and to objectively select active ingredients to be researched.
In this study, to solve the problem of searching for active ingredients in HST, which has been selected by hypothesis-driven methods, we developed a cell-based bioassay using HOK cells to model oral inflammation, objectively explored for active ingredients using a data-driven approach. In cancer therapy-induced stomatitis, the mechanism has been proposed whereby inflammatory cytokines released from immune cell activation (IL-1β is a representative inflammatory cytokine) damage the oral epithelium (Lalla et al. 2010). Biopsies taken from patients undergoing chemotherapy indicate that COX-2 activity is increased in oral mucosal (Logan et al. 2007), suggesting an increase in PGE2 within the oral cavity of the patients. Furthermore, many studies have demonstrated that HST inhibits COX-2 and PGE2 (Kase et al. 1997; 1998; 1999; Kitamura et al. 2014; Kono et al. 2014; Matsuda et al. 2015; Kato et al. 2016; Kamide et al. 2017; Miyashita et al. 2018), PGE2 was selected as an inflammatory indicator, anticipating the establishment of a cell-based bioassay with low variability. Based on these reports, we selected IL-1β as the stimulant and PGE2 as the inflammatory indicator, establishing a valid bioassay that can be extrapolated to clinical settings. Using this cell-focused assay employing PGE2 as an inflammatory indicator, the anti-inflammatory activities of 101 HST manufacturing lots, standardized by quality marker ingredients (i.e., baicalin, berberine, and glycyrrhizic acid), were compared. Furthermore, we performed a multicomponent analysis of 121 peaks using targeted liquid chromatography–mass spectrometry (LC-MS) analysis and correlated these results with anti-inflammatory activity to identify ingredients potentially responsible for anti-inflammatory effects.
Materials and methods
Reagents
HST extract powder (Table S1) was obtained from TSUMURA & CO. (Tokyo, Japan) and manufactured by spray-drying a hot water extract of a mixture comprising seven crude drugs: Pinellia tuber (5.0 g), Scutellaria root (2.5 g), processed ginger (2.5 g), Glycyrrhiza (2.5 g), jujube (2.5 g), ginseng (2.5 g), and Coptis rhizome (2.5 g). TSUMURA & CO. also supplied all other Kampo extract powders (Table S2), which were manufactured by spray-drying hot water extracts of crude drug mixtures based on amounts specified in the Japanese Pharmacopeia. The representative HST (rep., Lot# 392107100) was selected by evaluating the quantities of quality marker ingredients (i.e., baicalin, berberine, and glycyrrhizic acid). We chose this lot because the contents of these ingredients were close to the overall mean and within the range of variation (mean ± 1.65 SD) observed among the manufacturing lots produced between 2018 and 2020. Plant materials were authenticated via morphology and marker compound analyses following the Japanese Pharmacopeia methods and company standards. The quality of all Kampo extracts was standardized based on Good Manufacturing Practices defined by the Japanese Ministry of Health, Labor, and Welfare.
Diclofenac sodium (DCF; Cat No.: 043–22851) was purchased from Fujifilm Wako Pure Chemical (Osaka, Japan). Baicalin, baicalein, [6]-shogaol, [6]-gingerol, and magnoflorine were obtained from TSUMURA & CO. Schaftoside (Cat No.: HY-N0703), [8]-shogaol (Cat No.: HY-N2435), [10]-shogaol (Cat No.: HY-N2434), and [10]-gingerol (Cat No.: HY-N0448) were purchased from MedChemExpress (NJ, USA). Chrysin 6-C-glucoside 8-C-arabinoside (Cat No.: CFN92285) and neoglycyrol (Cat No.: CFN90792) were obtained from Wuhan ChemFaces Biochemical (Hubei, China). Cayman Chemical (MI, USA) supplied [8]-gingerol (Cat No.: 11841), Fisher Scientific International (NH, USA) provided 2-acetoxy-3-methoxybenzoic acid (Cat No.: 10712693), and Sigma-Aldrich (STL, USA) supplied glycycoumarin (Cat No.: SML3107). All other chemicals were purchased from commercial sources.
Cell culture
Primary HOKs (species: human, Lot No.: 17787 (Mycoplasma was not detected in this lot), Cat No.: 2610) were purchased from ScienCell Research Laboratories (CA, USA). HOK cells were cultured in Oral Keratinocyte Medium (Cat No.: 2611; ScienCell Research Laboratories) supplemented with 1% Oral Keratinocyte Growth Supplement (Cat No.: 2652; ScienCell Research Laboratories), 1% Penicillin/Streptomycin Solution (Cat No.: 0503; ScienCell Research Laboratories), and 10% heat-inactivated Fetal Bovine Serum (FBS; Lot No. 2353776RP, Cat No.: 16140-071; Thermo Fisher Scientific, MA, USA) using Poly-L-Lysine-coated dishes (Cat No.: 4020-040; AGC Techno Glass, Shizuka, Japan). HOK cells were maintained at 37 °C in a 5% CO_2_ incubator during all experiments.
PGE2 measurements
All assays were performed using fifth-passage HOK cells. Semi-confluent cells were detached using 0.25% Trypsin/EDTA Solution (Cat No.: 0103; ScienCell Research Laboratories), neutralized using Trypsin Neutralization Solution (Cat No.: 0113; ScienCell Research Laboratories), and collected. Cells were seeded into 96-well Poly-L-Lysine–coated plates (Cat No.: MS-0096L; Sumitomo Bakelite, Tokyo, Japan) at 4–8 × 10^4^ cells/well in Oral Keratinocyte Medium containing 2% FBS (100 μL/well).
After overnight incubation, cells were washed with phosphate-buffered saline and treated with test reagents (100 μL/well) immediately after adding human IL-1β (Cat No.: AF-200-1B; PeproTech, NJ, USA) diluted in serum-free complete medium with or without 0.2% dimethyl sulfoxide (DMSO; 100 μL/well). Vehicle-only treatments were used for blank wells, and control wells contained cells without test compounds. The final volume in each well was 200 μL. Test reagents and IL-1β solutions reached final concentrations upon mixing in each well. Supernatants were collected 24 h after treatment. DCF was diluted in serum-free complete medium with or without 0.2% DMSO. HST and other Kampo extract powders were suspended in serum-free medium and centrifuged, after which the supernatants were diluted for use as test reagents. All single ingredients were dissolved in DMSO and further diluted with serum-free medium. DMSO concentration in assays was adjusted to 0.2%. Vehicles were selected appropriately for each experiment.
PGE2 concentrations in supernatants were measured using an enzyme immunoassay (EIA) kit (Cat No.: 514010; Cayman Chemical) according to the manufacturer’s instructions. Supernatants were first diluted 10-fold with EIA kit buffer, and absorbance was read at 405–420 nm using a Multiskan GO microplate reader (Thermo Fisher Scientific).
To correct for interpolation and interday variability, an internal standard was included in each assay. The PGE2 production rate for each treatment was calculated using the following formula: [(measured value/mean IL-1β value on the same plate) × 100/mean inhibition rate of representative sample (or positive control) on the same plate] × mean inhibition rate of all representative samples (or positive controls).
Cell viability assay
After supernatants were collected for PGE2 analysis, HOK cell viability was assessed using a Cell Counting Kit-8 (CCK-8; Cat No.: CK04; Dojindo Laboratories, Kumamoto, Japan). A 10% CCK-8 solution in Oral Keratinocyte Medium was added to each well (100 μL/well) and incubated for 2 h at 37 °C. Absorbance at 450 nm was measured using the Multiskan GO microplate reader. Absorbance for each treatment was normalized using IL-1β–treated cells as 100%.
Multicomponent analysis
HST extraction method
HST powder (∼0.2 g; actual range: 0.1975–0.2024 g) was weighed into a screw-top centrifuge tube, and 20 mL of purified water was added. The mixture was shaken at 250 rpm for 30 min, followed by centrifugation at 3,000 rpm for 5 min. The supernatant was then transferred to a glass vial and centrifuged again at 7,000 rpm for 5 min to prepare the sample solution.
Component selection
To analyze HST components, analyte peaks were selected from the crude drugs comprising HST (one sample per drug). Each extract was analyzed using a liquid chromatography–charged aerosol detector (LC-CAD), and peaks with content ≥ 0.3 mg/g were selected. The peak selection criterion was set with reference to guideline for International Council for Harmonization of Technical Requirements for Pharmaceuticals for Human Use (ICH) Q3A (R2) (International Council for Harmonisation of Technical Requirements for Pharmaceuticals for Human Use 2006), when the maximum daily dose exceeds 2 g/day, constituents with a content of ≥0.03% (0.3 mg/g) are subject to reporting. We therefore adopted this value as the cutoff for peak selection. Subsequently, each peak was then further analyzed via LC-MS to identify target ions. The 0.3 mg/g threshold was uniformly applied across all crude drugs. To calculate the content of each compound, peak intensities were compared to that of the glycyrrhizic acid target peak, and peak selection was performed automatically through computational processing to ensure consistency. Glycyrrhizic acid was chosen as the reference compound because it is a major, nonvolatile component found in many Kampo formulations, including HST.
Component identification and estimation
HST’s constituent crude drugs were analyzed via liquid chromatography time-of-flight mass spectrometry (LC-TOF-MS; Agilent 1,290 Infinity II LC, Agilent Technologies, CA, USA) coupled to a SCIEX TripleTOF 4600 mass spectrometer (SCIEX, MA, USA). Target components were estimated by comparing the MS spectra, exact masses, retention times, and base species information for each peak with data from the Dictionary of Natural Products. Component identities were confirmed via comparison with reference standards.
Conditions for LC-MS analysis of HST extract
LC analysis was performed on the Agilent Infinity 1,290 system equipped with a ZORBAX Eclipse Plus C18 column (100 × 2.1 mm, 1.8 μm) at 40 °C. Mobile phase A consisted of 0.1% formic acid in water; mobile phase B comprised acetonitrile:water:formic acid (100:10:0.1, v/v/v). Chromatographic separation was performed using the following gradient: 0.0–0.5 min, 5.0% B (isocratic; 0.6 mL/min); 0.5–10.0 min, 5.0%–30.0% B (linear gradient; 0.6 mL/min); 10.0–17.0 min, 30.0%–99.5% B (linear gradient; 0.6 mL/min); 17.0–18.5 min, 99.5% B (isocratic; 0.6–1.0 mL/min); 18.5–18.6 min, 99.5%–5.0% B (linear gradient; 1.0–0.6 mL/min); and 18.6–20.0 min, 5.0% B (isocratic; 0.6 mL/min). The injection volume was 2.0 μL. The LC system was coupled to an Agilent MSD XT 6135 mass analyzer via an electrospray ionization source, optimized with the following parameters: dry gas temperature, 350 °C; gas flow rate, 12.0 L/min; nebulizer pressure, 55 psi; capillary voltage, 3,500 V (positive/negative).
Quantitative analysis
Preparation of HST extract solution
Three lots of HST powder (Lot# 372200900, 382092900, and 392165800) were provided by TSUMURA & CO. and used for quantitative analysis. Each HST powder (∼30 mg; actual range: 29.90–31.10 mg) was weighed into a 2 mL microcentrifuge tube, and 1.5 mL of 75% ethanol solution (ethanol:purified water = 3:1, v/v) was added. The mixture was shaken at 1,600 rpm for 30 min, followed by centrifugation at 2,000 × g for 3 min. The supernatant was then transferred to a glass vial and centrifuged at 7,000 rpm for 5 min to prepare the sample solution for quantitative analysis.
Preparation of standard solutions
Eight compounds, [6]-gingerol, [8]-gingerol, [10]-gingerol, [6]-shogaol, [8]-shogaol, [10]-shogaol, neoglycyrol, and glycycoumarin were used as reference standards for quantification. Each reference standard (∼0.5 mg; actual range: 0.45–0.55 mg) was weighed into a 10 mL volumetric flask, dissolved, and diluted to volume with 75% ethanol solution to prepare Standard Solution I. Subsequently, 1.58 mL of Standard Solution I was transferred into a 5 mL volumetric flask and diluted to volume with 75% ethanol to obtain Standard Solution II. This serial dilution process was repeated in the same manner to prepare Standard Solutions III, IV, and V, using 1.58 mL of the preceding solution for each step.
Conditions for LC-MS analysis of HST extract solution and standard solutions
LC-MS analysis was performed on the Agilent Infinity 1290 system equipped with a ZORBAX Eclipse Plus C18 column (100 × 2.1 mm, 1.8 μm) at 40 °C. Mobile phase A consisted of 0.1% formic acid in water; mobile phase B comprised acetonitrile:water:formic acid (100:10:0.1, v/v/v). Chromatographic separation was performed using the following gradient: 0.0–0.5 min, 5.0% B (isocratic; 0.6 mL/min); 0.5–10.0 min, 5.0%–30.0% B (linear gradient; 0.6 mL/min); 10.0–17.0 min, 30.0%–99.5% B (linear gradient; 0.6 mL/min); 17.0–18.5 min, 99.5% B (isocratic; 0.6–1.0 mL/min); 18.5–18.6 min, 99.5%–5.0% B (linear gradient; 1.0–0.6 mL/min); and 18.6–20.0 min, 5.0% B (isocratic; 0.6 mL/min). The injection volume was 2.0 μL. The LC system was coupled to an Agilent MSD XT 6135 mass analyzer via an electrospray ionization source, optimized with the following parameters: dry gas temperature, 350 °C; gas flow rate, 12.0 L/min; nebulizer pressure, 55 psi; capillary voltage, 3,500 V (positive/negative).
Data analysis
Eight reference standards were analyzed at five concentration levels (seven data points in total), consisting of Standard Solution I (50.0 µg/mL, injected at 0.3, 0.4, and 0.5 µL corresponding to 15.0, 20.0, and 25.0 ng, respectively), and Standard Solutions II–V at 16.0, 5.0, 1.6, and 0.5 µg/mL (each injected at 0.5 µL, corresponding to 8.0, 2.5, 0.8, and 0.25 ng, respectively). Calibration curves were generated using the weighted least-squares method (weights = reciprocal of the unbiased variance). Either a linear or quadratic regression model was applied, and the regression model showing the higher coefficient of determination (R^2^) was adopted. Before quantification, it was confirmed that the peak intensities of the HST extract samples (Lot# 372200900, 382092900, and 392165800) were within the upper and lower limits of the calibration curves. Subsequently, the contents of each marker compound in these lots were calculated.
Statistical analysis
Data are presented as means ± standard deviations (SDs). IC_50_ values were calculated through fitting to a four-parameter logistic model using Prism 7 (GraphPad Software, CA, USA). Pearson’s correlation coefficients between pharmacological activity and multicomponent profiles, and analysis of variance of pharmacological activity of 101 HST samples were calculated using R statistical software (version 4.4.2; R Foundation for Statistical Computing, Vienna, Austria).
Results
Cell-based bioassay
To develop a cell-based assay for anti-inflammatory activity, cell density (0.5, 1.0, 2.0, and 4.0 × 10^4^ cells/well), assay duration (2, 6, and 24 h), and IL-1β concentration (1, 3, 10, and 30 ng/mL) were altered and PGE2 production measured (Figure S1). PGE2 production levels were dependent on three variables (Figures S1A, S1B), with the following optimal assay conditions selected: 4.0 × 10^4^ cells/well, 24 h of incubation, and 1 ng/mL IL-1β. DCF, a COX-1/2 inhibitor and representative anti-inflammatory agent, was used to validate the assay. DCF suppressed PGE2 production in a concentration-dependent manner (IC_50_ = 0.31 nM; Figure S1C), confirming that the assay could reliably detect anti-inflammatory activity. DCF (0.3 nM) was used as a positive control in subsequent experiments to validate the assay’s suitability.
To assess whether the assay could differentiate between Kampo extracts with varying compositions, we evaluated 128 differing formulations at 100 μg/mL (Figure S2 and Table S3). PGE2 inhibition varied widely, depending on the constituent crude drugs. Among the tested formulations, HST exhibited the strongest suppression of PGE2 production (6.49% of IL-1β control), demonstrating that the assay responded sensitively to compositional differences.
Using the established cell-based assay, we tested a representative HST sample. HST inhibited PGE2 production in a concentration-dependent manner (IC_50_ = 23.84 μg/mL; Figure 1A). No cytotoxicity was observed at concentrations up to 300 μg/mL, as assessed by the effect of HST on HOK cells using the reduction of WST-8 as an indicator (Figure 1B). Furthermore, there is no influence of HST alone on cytotoxicity and PGE2 production in HOK cells (Figure S1D).
(A) Dose–response relationship between representative HST (Lot# 392107100) and 1 ng/mL IL-1β–induced PGE2 production in HOK cells (n = 3 wells; IC50 = 23.84 μg/mL). (B) Effect of HST on HOK cell viability (n = 3 wells). Black plots and bars: medium + medium; blue plots and bars: medium + medium; red plots and bars: 1 ng/mL IL-1β + medium; green plots and bars: 1 ng/mL IL-1β + 0.1–300 μg/mL HST. Blk: blank; ctrl: control. Data are means ± SDs (error bars).
Pharmacological activity and multicomponent analysis of 101 HST samples
The 101 tested HST samples were standardized for baicalin, berberine, and glycyrrhizic acid content, but other constituents may have varied among lots. Using a concentration near the IC_50_ (30 μg/mL; Figure 1A), we evaluated anti-inflammatory activity across all samples. All 101 lots inhibited PGE2 production with inhibition rates of 41.33%–67.38% (Figure 2 and Table 1), indicating consistent pharmacological efficacy. However, minor differences in inhibition rates were observed. Analysis of variance excluding the reference lot revealed that between-group variation significantly exceeded within-group variation [F (99, 299) = 2.58, p < 0.0001]. To identify the potential contributing components, we conducted multicomponent analysis.
Comparison of 1 ng/mL IL-1β–induced PGE2 production among 101 HST samples (30 μg/mL) (IL-1β, n = 44 wells; All HST, n = 399 wells; All rep., n = 44 wells; each sample, n = 3–4 wells). All HST represents the average of 100 HST samples excluding the representative HST (rep., Lot# 392107100). All rep. represents the average of the representative HST across assay plates. All values were standardized using the representative HST. Dotted lines indicate the mean of All HST (53.08%) ± 2SD. Data are means ± SDs (error bars). HST: Hangeshashinto; rep.: representative sample.
Each sample was analyzed using targeted LC-MS. In total, 121 peaks were selected based on LC-CAD profiling, and these peaks were subsequently analyzed using LC-TOF-MS for structural characterization. Of these, 55 were identified using authentic standards (based on exact mass, retention time, and MS pattern), and 66 were tentatively assigned using the Dictionary of Natural Products database. These 121 peaks were used as analytical targets for subsequent correlation analysis (Table 2).
Identification of active ingredients via correlation analysis
To identify candidate active ingredients, we performed correlation analysis between PGE2 inhibition data (Figure 2) and the peak intensities of the 121 components across the 101 HST samples. Correlation coefficients ranged from −0.45 to 0.40 (Figure 3A). Table 3 lists the top 20 ingredients with correlation coefficients below −0.30. Among these, 11 ingredients (schaftoside, 2-acetoxy-3-methoxybenzoic acid, glycycoumarin, neoglycyrol, chrysin 6-C-glucoside 8-C-arabinoside, magnoflorine, [6]-shogaol, [8]-shogaol, [10]-shogaol, [8]-gingerol, and [10]-gingerol) were commercially available and selected for validation. Additionally, baicalin, its aglycon baicalein, and [6]-gingerol (a structural analog of [6]-shogaol) were tested. Eight ingredients, namely glycycoumarin, neoglycyrol, [6]-shogaol, [8]-shogaol, [10]-shogaol, [6]-gingerol, [8]-gingerol, and [10]-gingerol, exhibited concentration-dependent inhibition of PGE2 production (Figure 3B).
Figure 3.(A) Pearson correlation between inhibition of PGE2 production and LC-MS peak intensity across 101 HST samples. Solid line indicates correlation coefficient = 0. (B) Effects of selected ingredients on 1 ng/mL IL-1β–induced PGE2 production in HOK cells (IL-1β, n = 32 wells; All DCF, n = 32 wells; each sample, n = 3–4 wells). All values were standardized using DCF (0.3 nM). Data are means ± SDs (error bars). DCF: diclofenac sodium; SFT: schaftoside; AMB: 2-acetoxy-3-methoxybenzoic acid; GLC: glycycoumarin; CGA: chrysin-6-C-glucoside 8-C-arabinoside; NGR: neoglycyrol; BCLi: baicalin; BCLe: baicalein; MGF: magnoflorine; [6]SG: [6]-shogaol; [8]SG: [8]-shogaol; [10]SG: [10]-shogaol; [6]GG: [6]-gingerol; [8]GG: [8]-gingerol; [10]GG: [10]-gingerol.
We performed quantitative analysis on three lots (372200900, 382092900, 392165800) of HST with different manufacturing years. Quantitative analysis of the eight components revealed the approximate content of each ingredient contained in HST (Table S4).
Discussion
We established a cell-based assay to directly evaluate the anti-inflammatory activity of HST against stomatitis (Figures 1 and S1) and demonstrated that all 101 HST samples, controlled for baicalin, berberine, and glycyrrhizic acid as quality control markers, exhibited stable and expected anti-inflammatory activity (Figure 2 and Table 1). Although Kampo medicines are multicomponent formulations and may undergo metabolic transformation in vivo, our use of a cell-based assay was justified by the clinical application of HST as a gargle for treating chemotherapy-induced stomatitis, where it likely acts locally (Matsuda et al. 2015). Furthermore, the results of the analysis of variance indicated that the between-group variation was greater than the within-group variation, demonstrating sufficient power to detect differences in effect. This suggests that our bioassay method is sufficiently stable. We consider that this cell-based bioassay is a stable quality evaluation method. Thus, direct exposure of HOK cells to HST in this assay closely matches the clinical context and serves as a reasonable method for stable assessing its anti-inflammatory effects.
Although baicalin, berberine and glycyrrhizic acid are established as quality control markers for HST (Ministry of Health, Labour and Welfare 2021), other ingredients may vary among production lots. In this study, we tested 101 quality-controlled HST samples at 30 μg/mL (approximately the IC_50_; Figure 2 and Table 1) and observed inhibition of PGE2 production ranging from 41.33% to 67.38%. These results suggest that the current quality control markers adequately maintain pharmacological consistency. On the other hand, considering the results of the analysis of variance, it is also possible to interpret that slight differences in activity were observed between each lot. Given the observed range in inhibitory activity, we hypothesized that variability in ingredient composition among lots accounts for these differences. Therefore, we conducted a correlation analysis between the intensities of 121 LC-MS peaks and the PGE_2_ inhibition rates of 101 samples (Figure 3A). Unlike traditional methods that rely on selecting abundant or unique compounds in Kampo medicine, our method enabled a comprehensive, data-driven exploration for bioactive ingredients. Similar integrated strategies combining bioassays and chemical profiling to identify active ingredients have been reported previously (Li et al. 2019; Ma et al. 2021; Li et al. 2023; Harada et al. 2025), enabling unbiased identification of pharmacologically relevant constituents.
We performed a multicomponent intensity analysis to explore potential active ingredients (Figure 3A and Table 3), identifying eight ingredients (glycycoumarin, neoglycyrol, [6]-shogaol, [8]-shogaol, [10]-shogaol, [6]-gingerol, [8]-gingerol, and [10]-gingerol) as contributors to HST’s stomatitis-mitigating effects and potential pharmacological quality control markers (Figure 3B). Glycycoumarin and neoglycyrol have coumarin as their basic skeleton, while [6]-shogaol, [8]-shogaol, [10]-shogaol, [6]-gingerol, [8]-gingerol, and [10]-gingerol possess a phenylpropanoid skeleton. It is widely recognized that both skeletons exhibit anti-inflammatory effects in natural products (de Cassia da Silveira et al. 2014; Rostom et al. 2022), and a valid skeletal group has been identified. Specifically, glycycoumarin and neoglycyrol have previously been reported to inhibit PGE2 production in RAW264.7 macrophages (Shin et al. 2008; Fu et al. 2013; Tang et al. 2023), and [6]-shogaol, [8]-shogaol, [10]-shogaol, [6]-gingerol, [8]-gingerol, and [10]-gingerol have been shown to inhibit PGE2 production in HOK cells (Kono et al. 2014). Glycycoumarin may activate the Nrf2 antioxidant pathway, indirectly causing anti-inflammatory effects (Zang 2020; Zhang et al. 2020; Tang et al. 2023), whereas neoglycyrol, shogaols, and gingerols are known to suppress PGE2 expression via the COX-2 and NF-κB pathways (Shin et al. 2008; Mao et al. 2019; Bischoff-Kont and Furst 2021; Ballester et al. 2022; Ishfaq et al. 2022; Promdam and Panichayupakaranant 2022; Yücel et al. 2022; Sharma et al. 2023). These mechanisms align with the compounds’ strong negative correlations with PGE2 production in our analysis. As described above, while glycycoumarin and neoglycyrol are known to be anti-inflammatory substances, this study is the first to report their contribution to the anti-inflammatory effects of HST. We believe that selecting pharmacologically relevant quality control marker components in multi-component pharmaceuticals requires the following research and development process: 1) Identifying the primary active ingredients involved in specific pharmacological actions, 2) Manufacturing Kampo medicines that stably control these components, and 3) Validating the pharmacological activity and efficacy of these manufactured products through basic and clinical research. Repeating this cycle enables the selection of more convincing quality control marker components. This research corresponds to Process 1). The newly discovered anti-inflammatory ingredients glycycoumarin and neoglycyrol in this study are expected to advance not only to research on single-component research focusing on the anti-inflammatory effects of HST, but also to discuss the selection of pharmacological quality control markers in HST manufacturing.
In this study, a correlation coefficient of −0.3 was set as the criterion for correlation analysis in active ingredient exploration (Figure 3A and Table 3). This is because the criterion contains many HST ingredients ([6]-shogaol, [8]-shogaol, [10]-shogaol, [8]-gingerol, and [10]-gingerol), which have already been reported to possess PGE2 inhibitory activity (Kono et al. 2014). Furthermore, a correlation coefficient of ±0.3 is interpreted as indicating a weak but significant correlation (Mukaka 2012; Akoglu 2018; Schober et al. 2018). For the above two reasons, this study defined active ingredients as those with a correlation coefficient of −0.3 or lower. The 101 lots of HST samples used in this study were manufactured using crude drugs conforming to the Japanese Pharmacopeia and quality-controlled based on the quality markers (baicalin, berberine, and glycyrrhizic acid). Even within such a homogeneous sample set, the eight active ingredients identified (glycycoumarin, neoglycyrol, [6]-shogaol, [8]-shogaol, [10]-shogaol, [6]-gingerol, [8]-gingerol, and [10]-gingerol) are considered promising candidates for pharmacological quality control markers. On the other hand, only 8 of the 11 ingredients (excluding the 3 arbitrarily added components) whose activity was verified possessed activity, and the detection rate of active ingredients fell short of expectations. In a sample set with low diversity, the active ingredients detected by correlation analysis may have been limited. To detect more convincing active ingredients, it may be necessary to conduct analyses using diverse sample sets and to explore modified correlation analysis methods.
Based on the quantitative analysis (Table S4), the total content of 8 ingredients at 30 μg/mL HST (approximately the IC_50_) is around 0.1 µM. Their mean individual activity at this concentration, 68.56%, accounted for ∼63% of the observed HST activity. This suggests that stable control of these eight ingredients, in addition to the currently monitored markers, could enhance the anti-inflammatory quality of HST. Previous studies have reported that baicalin, berberine, and wogonin also possess anti-inflammatory properties (Kono et al. 2014), and these, along with other unidentified ingredients, may contribute to the remaining activity. However, incorporating low-abundance compounds as quality markers carries the risk of variability, as such ingredients can be easily lost or may be difficult to detect and quantify reliably. Therefore, it is desirable to select additional markers among the identified active ingredients that are technically feasible to measure and capable of improving the consistency of HST’s anti-inflammatory effects.
Conclusions
We demonstrated that consistent anti-inflammatory effects can be expected using the current quality control markers. Conversely, the addition of eight newly identified ingredients as quality control markers may further stabilize the anti-inflammatory effects. Furthermore, the combination of cell-based bioassays and multicomponent analysis is beneficial for objective screening of active ingredients.
We acknowledge that the current findings alone cannot fully explain clinical efficacy or predict clinical outcomes. Validation of the pharmacological effects of the eight identified ingredients using animal models with stomatitis and multicomponent analysis in HST lots that have shown stomatitis-improving effects in clinical practice are further required. Nevertheless, the correlation between the cell-based assay data and multicomponent profiles offers a promising foundation for future research. With further validation, this approach could support the development of predictive in vitro assays for evaluating the clinical efficacy of multicomponent drugs, including Kampo formulations.
Supplementary Material
Supplemental Material
Supplemental materials_Crude drug list for 128 Kampo formulas.xlsx
The reference list from the paper itself. Each links out to its DOI / PubMed record.
- 1Akoglu H. 2018. User’s guide to correlation coefficients. Turk J Emerg Med. 18(3):91–93. 10.1016/j.tjem.2018.08.00130191186 PMC 6107969 · doi ↗ · pubmed ↗
- 2Arai I, Kawahara N. 2019. Kampo pharmaceutical products in the Japanese health-care system: legal status and quality assurance. Trad Kampo Med. 6(1):3–11. 10.1002/tkm 2.1204 · doi ↗
- 3Ballester P et al. 2022. Effect of ginger on inflammatory diseases. Molecules. 27(21):7223. 10.3390/molecules 2721722336364048 PMC 9654013 · doi ↗ · pubmed ↗
- 4Bischoff-Kont I, Furst R. 2021. Benefits of ginger and its constituent 6-Shogaol in inhibiting inflammatory processes. Pharmaceuticals. 14(6):571. 10.3390/ph 1406057134203813 PMC 8232759 · doi ↗ · pubmed ↗
- 5de Cassia da Silveira ESR, Andrade LN, Dos Reis Barreto de Oliveira R, de Sousa DP. 2014. A review on anti-inflammatory activity of phenylpropanoids found in essential oils. Molecules. 19(2):1459–1480.24473208 10.3390/molecules 19021459 PMC 6270723 · doi ↗ · pubmed ↗
- 6Fu Y, Chen J, Li YJ, Zheng YF, Li P. 2013. Antioxidant and anti-inflammatory activities of six flavonoids separated from licorice. Food Chem. 141(2):1063–1071. 10.1016/j.foodchem.2013.03.08923790887 · doi ↗ · pubmed ↗
- 7Harada K, Fukuda Y, Ohkubo T, Sugaya K, Osaki Y. 2025. Correlation between the metabolic profile of Nelumbo Seed, a component of Seishinrenshiin, and its inhibitory activity on bladder smooth muscle contraction. J Nat Med. 79(3):556–567. 10.1007/s 11418-025-01889-440106217 PMC 12058941 · doi ↗ · pubmed ↗
- 8Ikarashi Y, Mizoguchi K. 2016. Neuropharmacological efficacy of the traditional Japanese Kampo medicine yokukansan and its active ingredients. Pharmacol Ther. 166:84–95. 10.1016/j.pharmthera.2016.06.01827373856 · doi ↗ · pubmed ↗